A trading journal records what you planned, what happened and whether you followed your rules. For binary options, it must also capture the contract terms: the strike price, expiry, settlement rule and return offered. A list of wins and losses cannot tell you whether a method made money, whether the records are reliable or whether a winning result came from a poor decision.
Australian retail context: ASIC’s prohibition on issuing and distributing binary options to retail clients began on 3 May 2021 and has been extended until 1 October 2031. The exercises below are for paper practice, historical analysis and reviewing existing records, not a recommendation to open an offshore account. See the ASIC announcement extending the binary options ban.
What a Binary Options Trading Journal Should Show
A useful journal separates three questions. Did the recorded idea produce a positive result? Did the decision meet the rules written beforehand? Is there enough trustworthy evidence to draw any practical lesson?
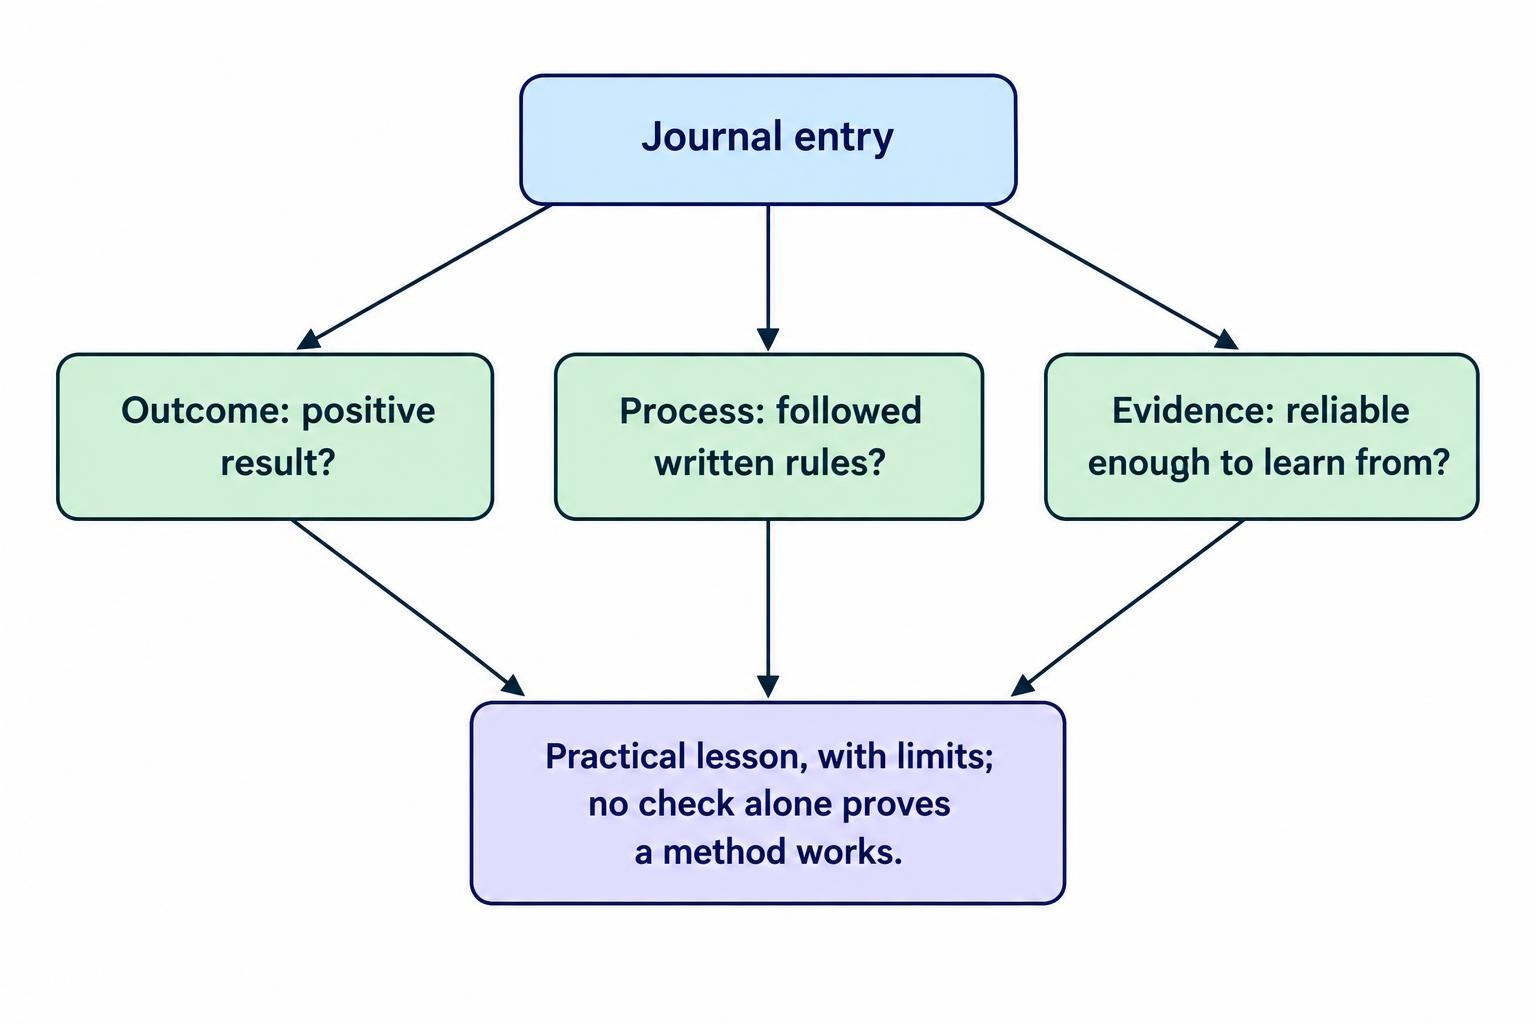
Those questions need separate answers. A profitable paper trade can break every rule in the plan. A losing trade can follow the plan exactly. Treating the result as the only measure gives lucky mistakes a free pass.
For paper trading binary options, record decisions before revealing the outcome. If you inspect the completed chart first, label the entry as a historical observation rather than a decision made without knowing the result.
The journal should preserve unsuccessful ideas, skipped opportunities and errors as well as clean examples. Its purpose is to test a process, not assemble a highlight reel.
A Practical Trading Journal Template
Start with one row per contract or simulated contract. Group related columns together, and use consistent labels rather than writing the same information differently each time.
| Field group | What to record |
|---|---|
| Record identity | Unique entry ID, session ID and environment: paper, historical test, demo or existing live record. |
| Market and price reference | Exact instrument, price provider and any distinction between the analysis chart and settlement reference. |
| Contract terms | Contract type, direction, strike price, expiry condition and treatment of equal prices. |
| Timing | Decision time, submission and acceptance times where available, and exact expiry with time zone. |
| Stake and return | Account currency, stake, quoted net winning return, total credit if successful and applicable fees. |
| Decision rules | Setup name, rule version, entry reason, exclusion checks and whether the entry qualified. |
| Settlement | Settlement price, outcome category, actual or simulated credit, and net result. |
| Evidence and review | Screenshot references, contract ID where available, error tags and a short review note. |
Do not collapse every outcome into “win” or “loss”. Keep separate labels for refunded ties, void contracts, early exits and unresolved settlements where relevant. Apply the recorded settlement and tie rules, rather than guessing from a chart that looks close enough.
Use seconds where timing matters. “Five minutes” is less useful than an expiry timestamp, especially when the decision time and contract start time differ. Store the time zone explicitly instead of relying on whatever your computer displays.
Complete the Entry Before and After the Outcome
Before the decision
Write the reason for the entry, the rule version being tested and the conditions that would disqualify it. Record the stake and available return at that moment. If a minimum acceptable return forms part of the exercise, specify it before seeing the outcome.
Use factual descriptions. “Price met rule BR1” is reviewable if BR1 has a written definition. “Looked strong” is not. Add a brief state tag if relevant, such as rushed, distracted or tempted to recover an earlier loss. Avoid turning the entry into a diary.
After settlement
Add the settlement details and calculate the result. Then assess rule compliance independently: compliant, noncompliant or uncertain. An uncertain label is better than pretending missing evidence exists.
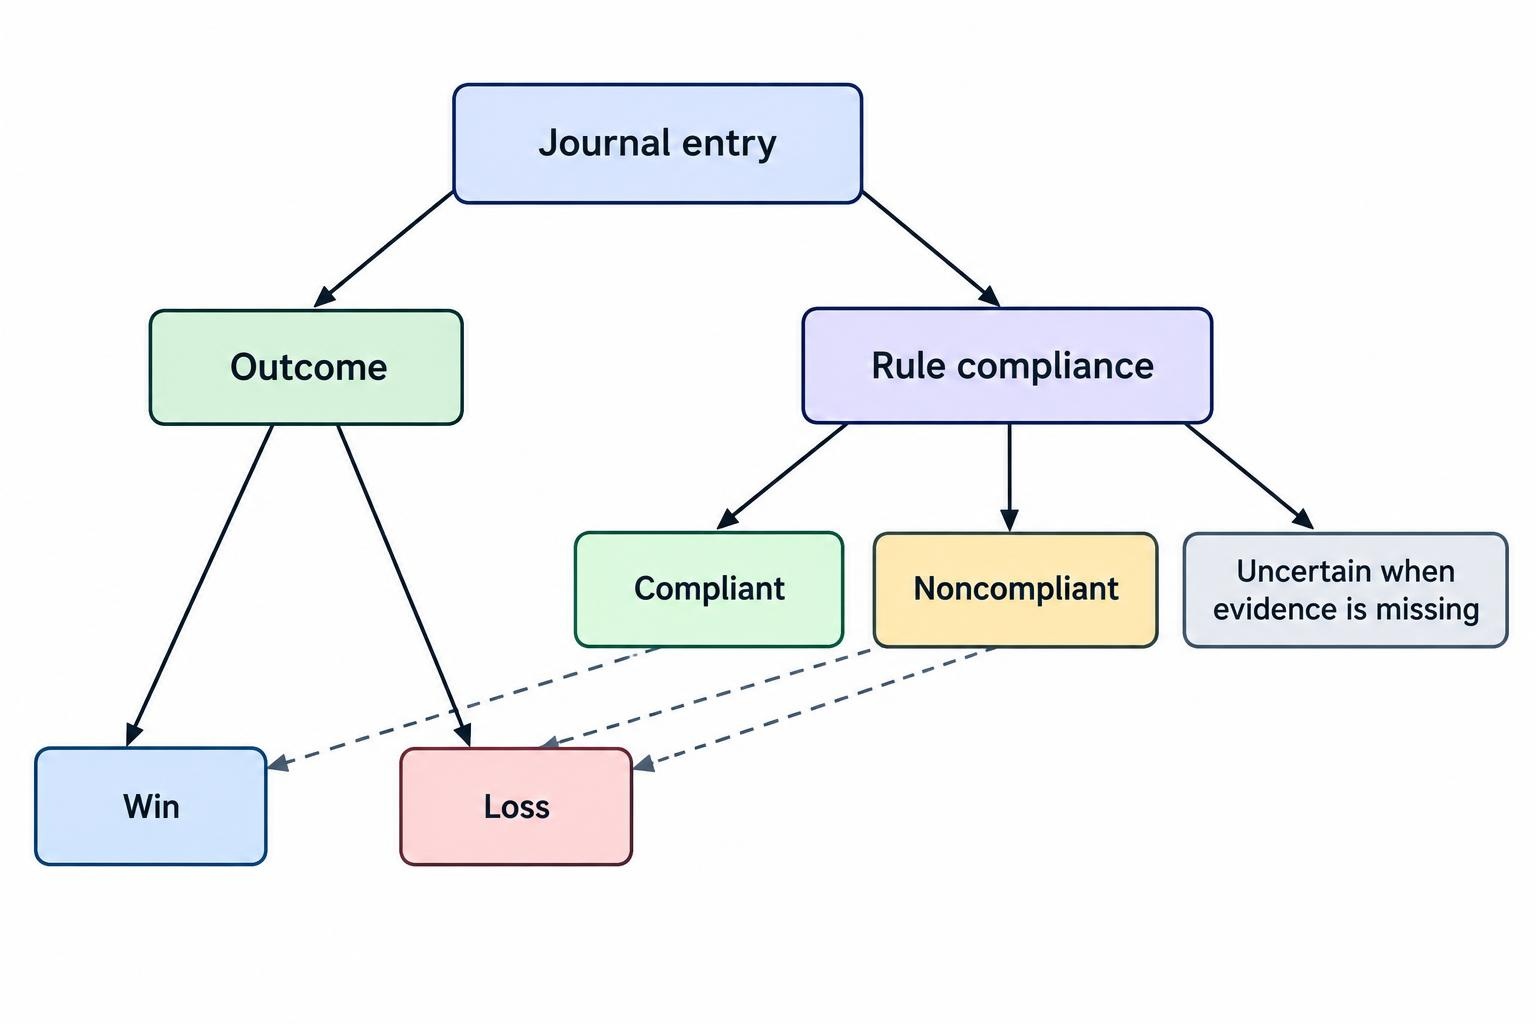
Preserve the original reason. If the entry was late, say so in a new review field instead of rewriting the initial note to make the timing appear intentional. Date corrections and retain the earlier value.
Also keep a small opportunity log for qualifying setups you skipped. Otherwise, you cannot distinguish a method’s results from the effect of selectively taking only some signals. Do not mix hypothetical skipped outcomes into the executed or simulated performance total.
Example of a Completed Journal Entry
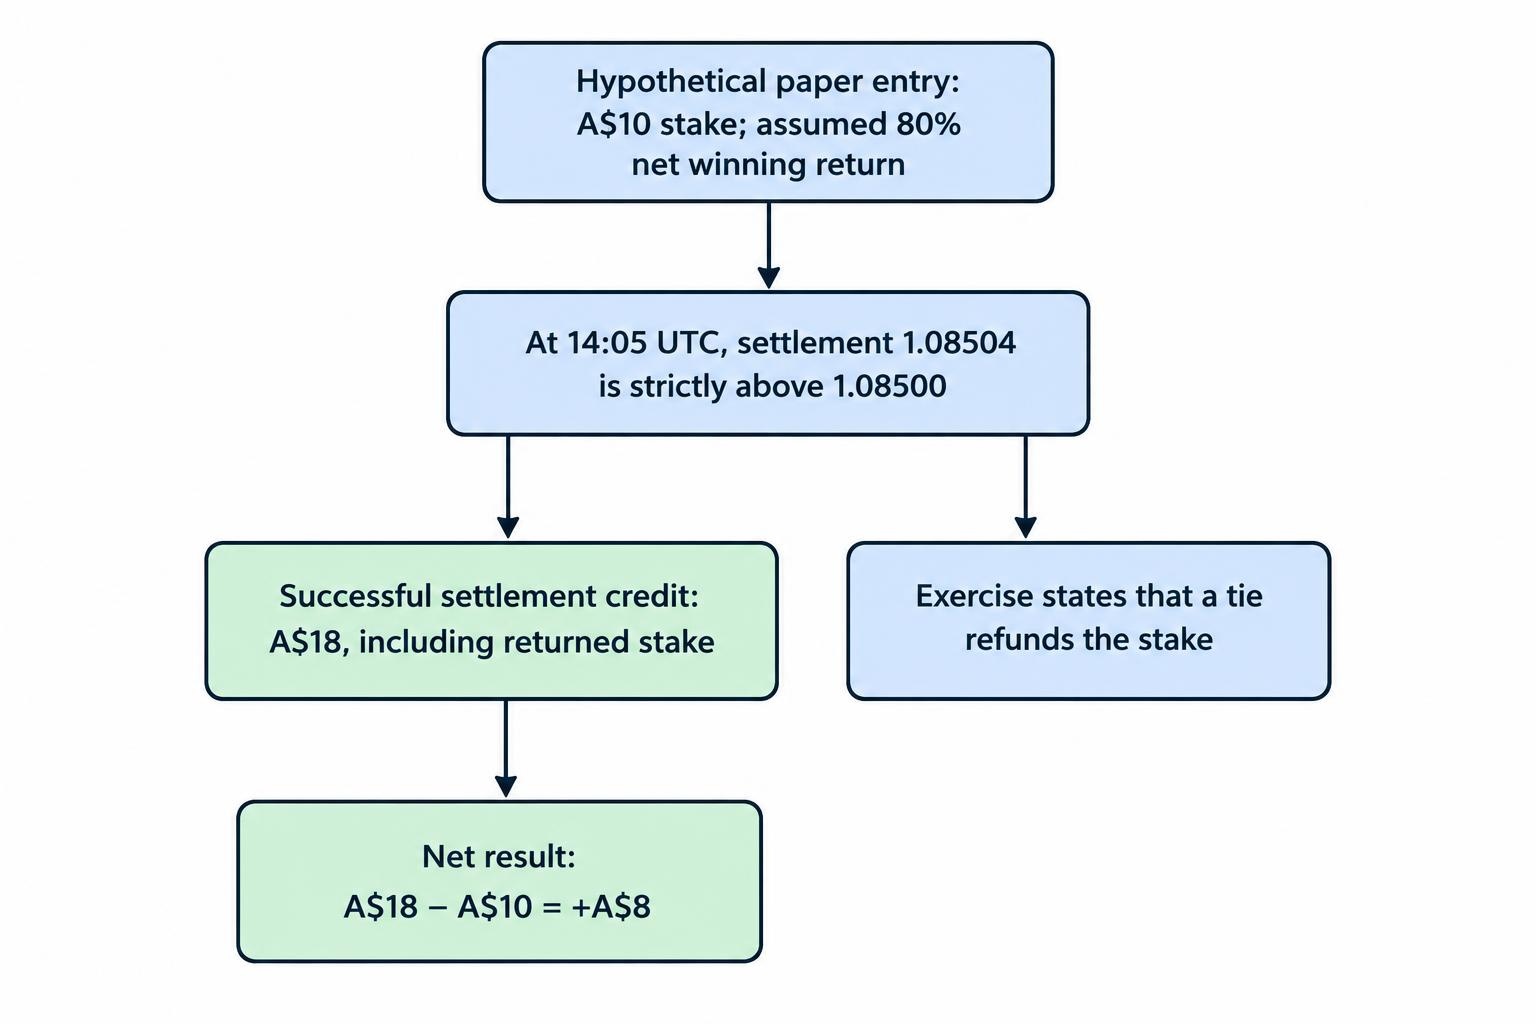
Consider this hypothetical paper entry, with all amounts expressed in Australian dollars:
Record P-024: EUR/USD high-low exercise; condition: settlement strictly above 1.08500 at 14:05:00 UTC. Paper entry recorded at 14:00:00 UTC under setup BR1, version 1. Assumed stake A$10; net winning return 80%; successful settlement credit A$18. A tie refunds the stake under this exercise’s stated rules. Recorded settlement price 1.08504; simulated credit A$18; net result +A$8. Rule compliance: yes. Evidence: entry and expiry screenshots, plus the price data reference.
The review note might read: “Qualified under BR1. Timing and price evidence complete. Retain the rule unchanged for the next review block.” It should not read “strategy proven”. One observation cannot support that claim.
Label assumptions clearly. An assumed return and a manually selected entry price are not evidence that those terms were available for an executable contract. Keep environments separate; the differences between demo and live trading matter when interpreting any journal total.
Calculate Results Beyond the Win Rate
A journal should show both the outcome count and the money calculation. A high win rate can still produce a loss when winning returns are smaller than losing stakes.
Net result per entry
Net result = settlement credit − stake − separately charged fees.
For the example above, A$18 − A$10 = A$8. The A$18 includes the returned stake; it is not A$18 of profit. A full loss with no refund or extra fee produces a result of −A$10.
Do not subtract a fee twice if the settlement credit already reflects it. Keep deposits and withdrawals outside trading profit, and show other account charges separately when reconciling the balance.
Break-even win rate
For equal stakes, a fixed net winning return, full stake losses and no fees or refunds:
Break-even win rate = 1 ÷ (1 + net winning return).
At an 80% net winning return, the calculation is 1 ÷ 1.8, or approximately 55.56%. Winning 55 out of 100 A$10 entries would produce A$440 from wins and A$450 of losses: a net loss of A$10.
That calculation is a threshold, not a forecast. The guide to probability and expected value in binary options covers how return terms and outcome probabilities interact.
Summary measures
Alongside total net result, track the number of entries, decisive win rate, average net result per entry, maximum drawdown and rule compliance rate. Define decisive win rate as wins divided by wins plus losses, reporting refunds and other outcomes separately.
Measure drawdown from a prior peak in the running result to a subsequent low, using a consistent balance or result series. With changing stakes, retain both currency results and stake-normalised results, calculated as each entry’s net result divided by its stake. Neither should replace the other.
Where returns vary between contracts, calculate results row by row. Applying one advertised return percentage to the entire history can misstate performance.
How Much Data Is Enough?
There is no universal trade count that proves a method works. The answer depends on the apparent advantage, variation in outcomes, consistency of the rules and whether observations can reasonably be treated as independent.
Suppose a journal contains 60 wins from 100 comparable, independent decisions with a stable underlying win probability. A 95% Wilson confidence interval is approximately 50.2% to 69.1%. That range includes probabilities below the 55.56% break-even threshold for an 80% net winning return. The calculation uses the method in the NIST guidance on confidence intervals for proportions.
Real journal entries may not satisfy those assumptions. Several contracts on the same market move can share much of the same exposure. Counting them as fully independent evidence would exaggerate what the sample tells you.
Record a session or event ID so related decisions remain identifiable. More rows are useful only when you know what those rows represent.
Review the Journal Without Rewriting the Rules
Choose a review schedule in advance. A weekly data check can identify missing fields and calculation errors; a separate, predefined testing block can govern changes to the method. Do not treat a handful of recent outcomes as a reason to rebuild everything.
At each review, check the following:
- Data quality: Are timestamps, return terms, settlement records and calculations complete?
- Rule compliance: Which entries met the written rules, and which did not?
- Comparable groups: What happened within each setup version, expiry category and return band?
- Next action: Retain the rules, investigate missing evidence, test one revision or stop the exercise.
Keep the full record, including mistakes. You can analyse compliant entries separately, but do not delete noncompliant ones to improve the headline result.
If the review suggests a change, assign a new version number and evaluate it on fresh observations. A filter chosen because it removed past losses needs a separate forward testing process; fitting the old record is not enough.
Separate Platform Problems From Method Results
A timing discrepancy or disputed settlement should not disappear inside a generic “bad trade” label. Preserve the contract terms, acceptance timestamp, settlement reference and any correspondence. Mark the outcome as unresolved until the evidence supports a classification.
Fraud complaints involving binary options have included withdrawal refusals, identity theft and alleged software manipulation of prices or expiry timing. These are documented in the SEC investor warning on binary options fraud. A profitable account display is not, by itself, proof that funds can be withdrawn.
Equally, a difference between two charts does not establish manipulation. Compare the instrument, timestamp, reference price and contractual settlement method before drawing that inference. A journal preserves evidence; it does not certify a provider as legitimate.
Keep the Journal Simple Enough to Maintain
A spreadsheet is a practical starting point. Use separate sheets for entries, rule definitions and review notes. Store screenshots in a folder using the journal ID in each filename, and retain original exports separately from your working calculations.
Use dropdowns for recurring labels, protect calculation cells and keep a dated backup. Avoid storing passwords, identity documents or full payment details in the journal. Redact account identifiers before sharing extracts.
Begin with the fields needed to reconstruct a decision. Add another field only when it answers a review question. Twenty unused tags create more administration, not better evidence.
Connect the journal to a written binary options practice plan that defines the exercise, review schedule and stopping conditions. The useful outcome may be a clearer rule, an identified error or a decision not to continue. A journal earns its place by making those decisions traceable, not by making the results look good.
This article was last updated on: October 22, 2026