A breakout trading strategy looks for price to move beyond a defined support or resistance area, then continue in that direction. The difficult part is not spotting a candle outside a range. It is deciding whether that move provides a repeatable signal, where entry would occur and how long the move needs to last.
For binary options, timing changes the problem. A bullish breakout can develop into a sustained rally while an individual high/low contract still expires at a loss. A useful strategy must connect the chart setup to the accepted strike, settlement price, expiry and payout, rather than treating direction alone as enough.
Australian retail restriction: ASIC’s ban on issuing and distributing binary options to retail clients took effect on 3 May 2021 and has been extended until 1 October 2031. The examples below are for education and paper testing, not instructions to access offshore providers or bypass the restriction. See ASIC’s binary options ban extension.
What a Breakout Strategy Actually Tests
A breakout setup starts with a boundary established before the signal appears. That boundary might be the upper edge of a trading range, a previous swing low or the edge of a consolidation. An upside breakout crosses resistance; a downside breakout crosses support.
The trading hypothesis is that price will continue beyond that boundary. The boundary itself does not prove the hypothesis. Nor does a large candle, an attractive pattern or several indicators agreeing with each other.
For the fixed payout high/low contracts discussed here, the outcome depends on the contract’s proposition at expiry. A winning outcome pays the stated amount, while a losing outcome generally loses the stake. The CFTC’s binary options advisory describes this payoff structure. These examples do not cover touch contracts, whose conditions differ.
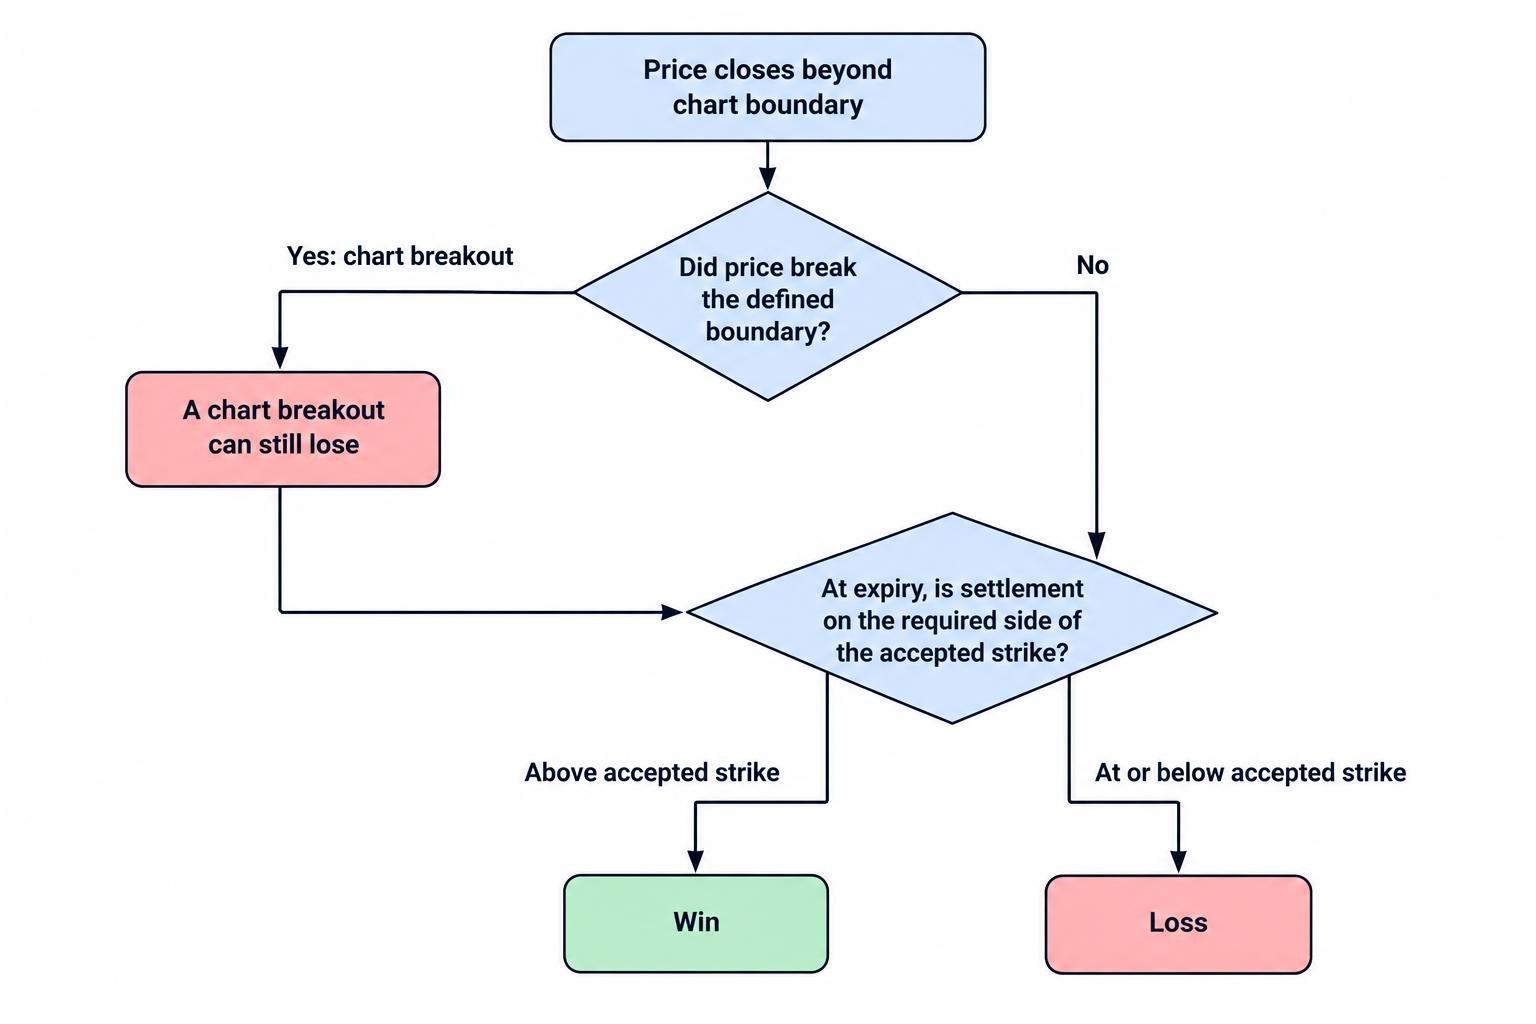
This creates two separate questions: did price break the chart boundary, and did it finish on the required side of the contract’s strike? A strategy needs to test both. Counting every successful chart breakout as a winning binary option will produce misleading results.
Three Breakout Setups to Keep Separate
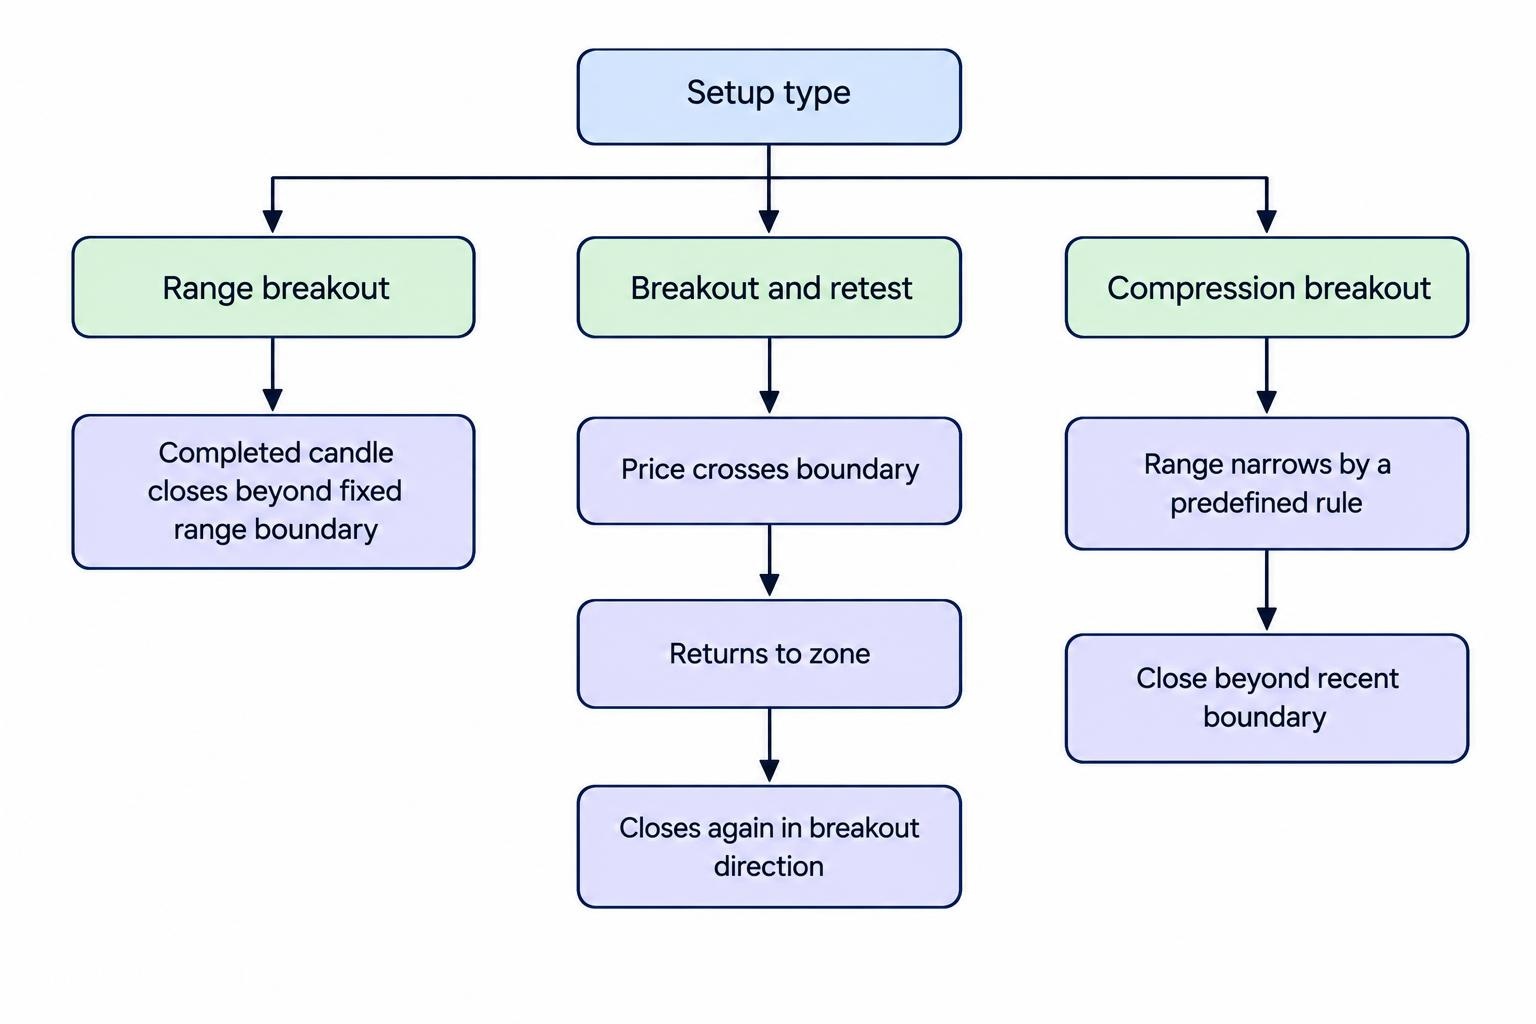
“Trade the breakout” is too vague to test. The following setups use different entry logic and should have separate records. Combining them after the results arrive makes it too easy to keep the winners and explain away the losses.
Range Breakout
A range breakout starts with price trading between an identifiable upper and lower boundary. A paper test might require at least two separated reactions near each boundary, then a completed candle outside the range.
Define the range using only information available before entry. Decide whether its edges follow candle bodies, extremes or a price zone. The support and resistance guide covers those construction choices; the breakout test should then apply one method consistently.
For example, a hypothetical AUD/USD range might extend from 0.6580 to 0.6600. A five minute candle closing at 0.6607 could meet an upside trigger. A candle that briefly reaches 0.6607 but closes at 0.6598 would not meet a rule requiring a close above resistance.
Keep the original boundary fixed after the signal. Moving it to accommodate later price action turns a testable rule into a drawing exercise.
Breakout and Retest
A retest setup waits for price to cross a boundary, return to the broken area and then move away again. Broken resistance may act as support, and broken support may act as resistance. Treat these areas as zones rather than exact prices, consistent with CME Group’s support and resistance framework.
Waiting changes the entry condition. Instead of recording the first close outside the range, the test might require a return to the boundary followed by another close in the breakout direction.
The trade-off is straightforward: some moves will continue without returning. Those become missed setups under this version of the strategy, not reasons to abandon the rule halfway through a session. A retest also does not guarantee continuation; price can pass back through the zone.
Compression Breakout
A compression setup looks for a narrowing price range before the break. Examples include converging highs and lows, a small triangle or a tight consolidation following a directional move. Triangles, rectangles, flags and pennants belong to the conventional continuation pattern framework, but their appearance does not establish a profitable signal.
For a test, replace descriptions such as “tight price action” with a measurable rule. One candidate might require the latest six completed candles to occupy a narrower range than the preceding six, followed by a close beyond the recent boundary.
That is a research hypothesis, not a recommended parameter. Its purpose is to make the setup reproducible. A small range tells you about recent movement, not which direction the next move must take.
Turn the Setup Into Rules Before Testing
A usable strategy should let another person review the same chart and reach much the same decision. If the entry depends on whether a candle “looks strong enough,” the rule needs more work.
Write down the following before collecting results:
- Boundary: how the range, swing point or consolidation edge is identified.
- Trigger: whether entry follows a price crossing, a completed candle or a retest.
- Entry allowance: the maximum delay or distance permitted after the trigger.
- Expiry: the exact settlement time or duration being tested.
- Exclusions: conditions that make an otherwise valid signal ineligible.
- Repeat entries: whether another signal from the same breakout is allowed.
A candle close is a different trigger from an intrabar crossing. It provides information about where that candle finished, but entry occurs later. Whether that trade-off improves results must be measured rather than assumed.
Keep the first version simple. Adding several filters at once makes it harder to identify what helps, what adds nothing and what only fits the historical sample.
Match Entry and Expiry to the Hypothesis
The chart timeframe does not determine the correct contract duration. A breakout identified on five minute candles does not automatically justify a five minute expiry. The test needs to establish what happens after the accepted entry, over the actual settlement interval.
Separate a fixed clock expiry from a duration measured after entry. A contract settling at 10:20 gives an entry accepted at 10:05 almost fifteen minutes, but an entry accepted at 10:17 only three minutes. Those observations should not sit in the same duration bucket without adjustment. The binary options expiry guide examines this distinction.
For paper research, one approach is to compare a small number of expiry intervals chosen in advance. Record the settlement result at each interval from the same simulated entry. Do not select whichever expiry happens to win on each historical chart.
A retest version needs its own entry and expiry records. Starting its clock at the original breakout would credit it with price movement that occurred before its entry condition existed.
Use the Accepted Strike, Not the Signal Price
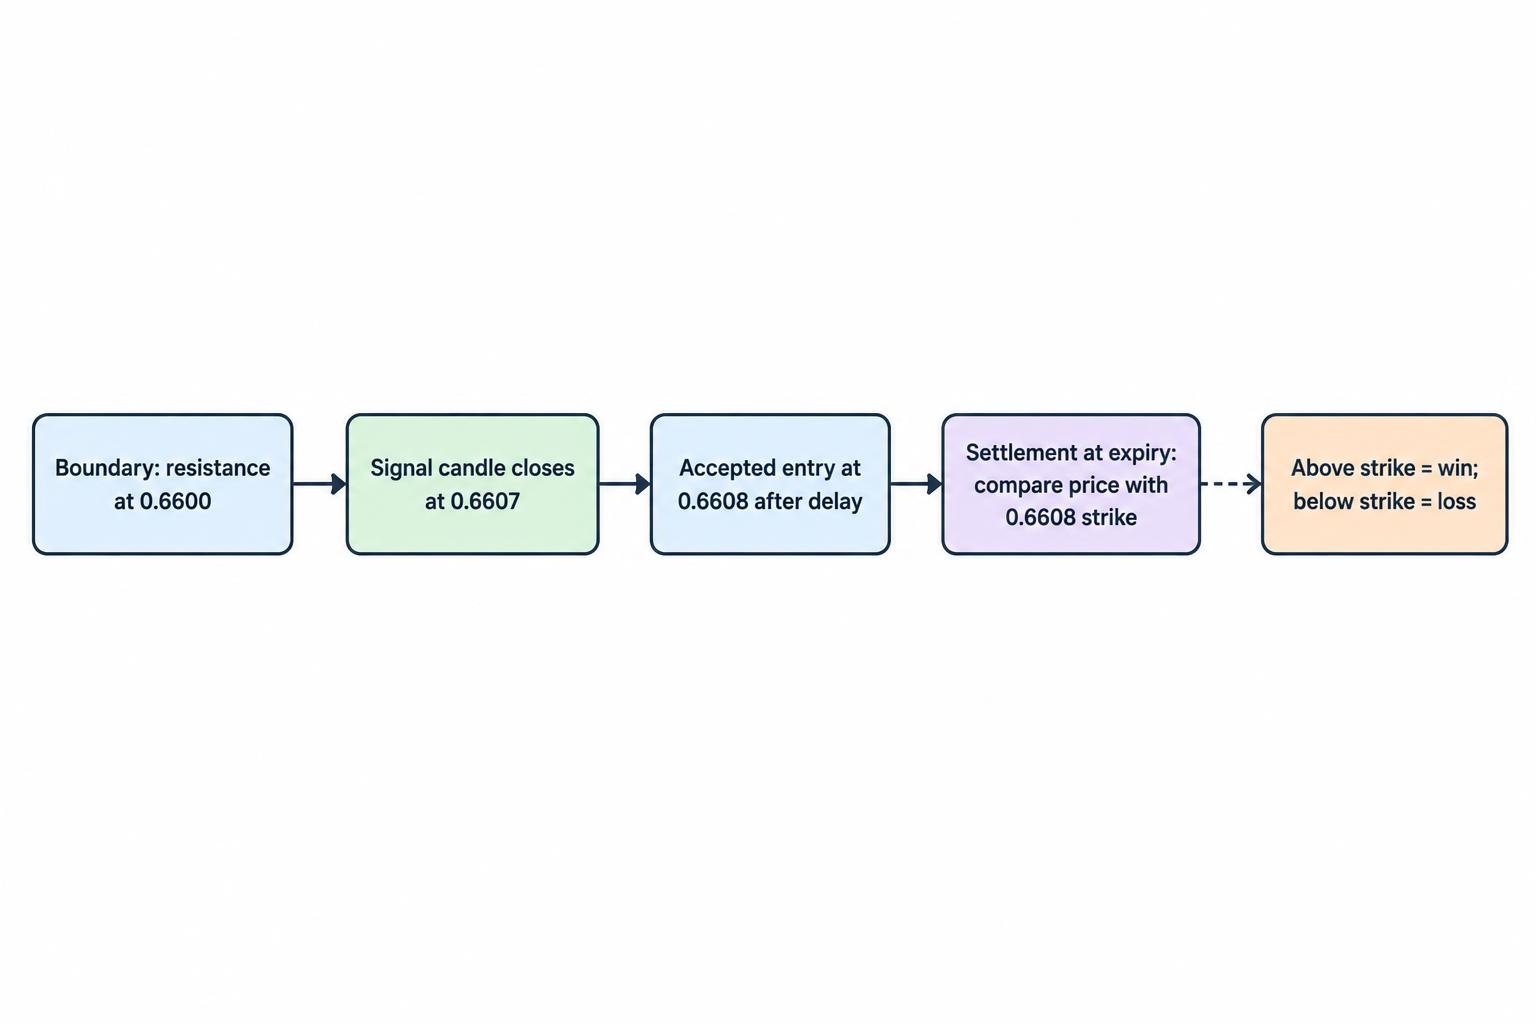
The breakout boundary, signal candle close and accepted strike are different values. Suppose resistance stands at 0.6600, the signal candle closes at 0.6607 and the simulated contract is accepted at 0.6608. For an “above strike at expiry” proposition, settlement must exceed 0.6608, not just remain above 0.6600.
Record the signal timestamp, assumed processing delay and resulting entry price separately. A test that assumes entry at an already completed candle’s closing price may give the strategy an entry that was not available after confirmation. See execution and latency in binary options for the operational distinction.
A maximum entry distance can make the rule clearer. The test might reject entries beyond a predefined distance from the broken zone. That parameter needs testing too, but it prevents “wait for confirmation” from becoming “chase any price.”
Worked Example: Correct Breakout, Losing Contract
Consider this hypothetical paper trade. AUD/USD has traded below resistance at 0.6600. A five minute candle finishes at 10:05 above that boundary. The simulated high contract is accepted at 10:05:02 with a strike of 0.6608 and settlement at 10:20.
Assume an A$100 stake, an A$80 net profit on a win and loss of the full stake on a loss. There are no fees, rebates or ties in this example. Each row below represents a separate possible outcome from the same entry.
| Settlement price | Position relative to 0.6600 resistance | Contract result | Net result |
|---|---|---|---|
| 0.6612 | Above the broken boundary | Above the 0.6608 strike: win | +A$80 |
| 0.6606 | Still above the broken boundary | Below the 0.6608 strike: loss | −A$100 |
| 0.6597 | Back below the broken boundary | Below the 0.6608 strike: loss | −A$100 |
The middle outcome matters. Price remains above the old resistance, yet the contract loses. The breakout may still satisfy a chart analyst’s continuation definition, but it has not satisfied this contract’s settlement condition.
Now suppose price reaches 0.6615 at 10:12 before settling at 0.6606. That temporary rise does not change the stated expiry result. Recording the highest price reached as a “successful prediction” would answer a different question from the one the contract asks.
A retest entry could produce another strike and result, but only if the retest actually occurred and met its rules. It cannot be inserted retrospectively because the first entry lost.
Filter False Breakouts Without Inventing Certainty
For research purposes, define a false breakout objectively. One definition could be a candle closing outside the range followed by a close back inside within the next three candles. Another could require price to return beyond the opposite edge of the breakout zone.
Neither definition is automatically correct for every test. Choose one in advance and keep it separate from the binary contract result. A false breakout can still produce a winning contract before reversing, just as a sustained breakout can produce a losing contract from a late entry.
Filters can be tested against that baseline. Candidate exclusions include a signal candle much larger than recent candles, another chart boundary close ahead or a signal arriving after the permitted entry window.
State the measurement behind each exclusion. “Avoid oversized candles” might become “reject a signal whose range exceeds twice the median range of the previous twenty completed candles.” The numbers are illustrative, not validated settings.
Do not label every reversal a stop hunt or every losing entry manipulation. Price action alone does not establish intent. Record what happened, then test whether a rule could have identified the condition beforehand.
Measure Profitability Against the Payout
A breakout strategy needs more than a win rate above 50% when a loss costs more than a win earns. Under a simple fixed stake model, with no fees, refunds or ties, the break-even win rate is:
Break-even win rate = 1 ÷ (1 + net profit rate on a win)
If a winning contract earns 80% of the stake, the calculation is 1 ÷ 1.80, or approximately 55.56%. An 80% net payout means an A$100 winning stake produces A$80 profit, with the original stake also returned.
Across 100 equal A$100 stakes, 55 wins earn A$4,400 while 45 losses cost A$4,500. The result is a A$100 loss before other costs. Being right more often than wrong was not enough.
The probability and expected value guide develops the calculation. For breakout testing, record the applicable payout alongside each observation. Applying the highest observed payout to every historical signal would overstate the result.
A higher payout does not automatically make a weaker setup attractive. Both the probability of winning and the amount earned or lost matter, and the probability is something the research must estimate rather than assume.
Backtest the Rule, Not the Best Looking Charts
Start with one setup, one entry method and a small set of predetermined expiry intervals. Use consecutive eligible signals rather than screenshots selected because the breakout worked.
Mark boundaries using information available at the time. If identifying a swing point requires later candles, the test must wait for those candles before treating that point as established. Otherwise, future information leaks into the decision.
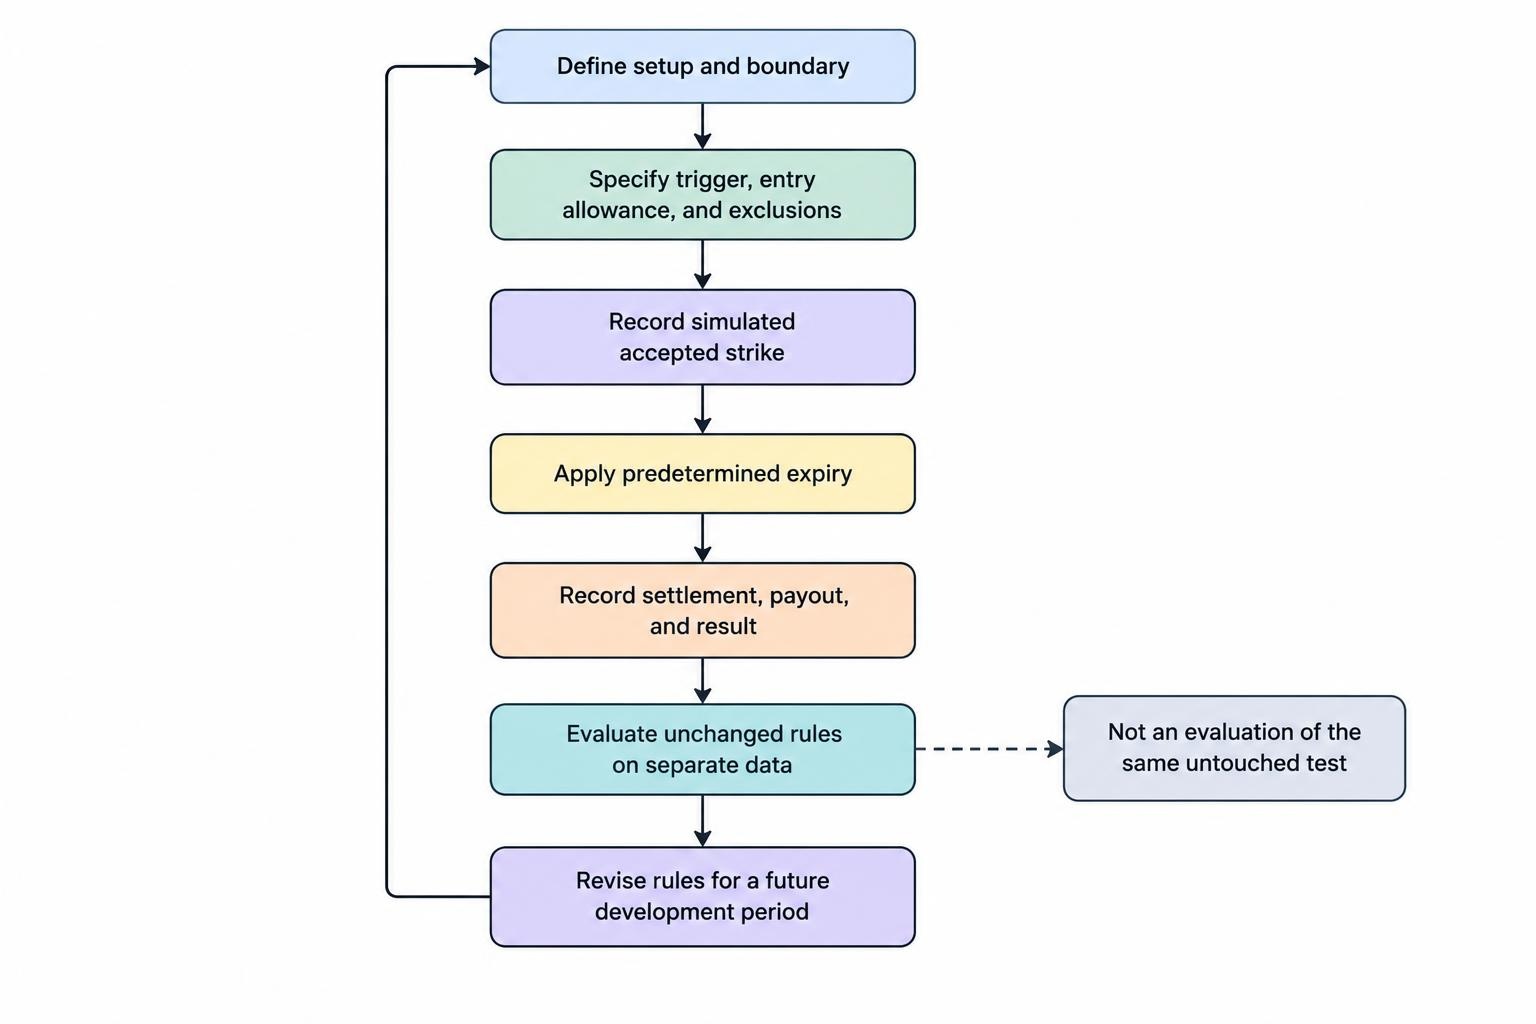
The binary options backtesting guide covers the broader process. A breakout record should include the original boundary, trigger time, simulated accepted strike, expiry, settlement price, payout and reason for any exclusion.
Keep development data separate from evaluation data. Use one period to build the rules, then assess the unchanged version on another period. If you change the rules after inspecting those results, treat that period as development data too.
Report more than the headline win rate. Include net return under the stated payout assumptions, the number of observations, losing sequences and results by setup type. Keep overlapping contracts identifiable: several entries from one breakout are not several unrelated market events.
Finally, conduct a forward paper test. Make each decision before the next candle appears and retain rejected signals as well as accepted ones. A tidy historical chart leaves plenty of room for hindsight; a timestamped decision is less accommodating.
Know When the Strategy Cannot Be Evaluated
A breakout test is incomplete if the settlement benchmark, timestamp convention, tie treatment or accepted strike is unknown. Chart data can help study the setup, but it cannot reconstruct an unknown contract result with confidence.
Platform risk is also separate from strategy risk. Documented complaints include refused withdrawals and alleged software manipulation, including altered expiration countdowns. These risks appear in the joint SEC and CFTC investor alert on binary options fraud. A profitable spreadsheet does not resolve them.
For any paper model, assume the stated maximum loss rather than relying on an early exit that has not been verified. Keep simulated stakes consistent, define a session loss budget and do not increase stakes to recover a failed breakout.
The standard for retaining a breakout strategy is not whether its charts look persuasive. It is whether clear rules produce repeatable results after entry timing, expiry and payout assumptions have been included. Compare it with other binary options trading strategy approaches on that same basis, without treating any pattern as a promise of profit.
This article was last updated on: October 22, 2026