Synthetic indices are computer generated price series designed to imitate market movements without tracking a basket of shares, a currency pair or a commodity. Their charts can show trends, ranges and sudden jumps, but the price comes from a mathematical model rather than trading in an underlying asset.
That distinction matters when a binary option settles against the generated price. You need to assess both the price generation process and the contract that turns that price into a financial result.
For Australian retail clients, the regulatory position comes first. ASIC’s prohibition on issuing and distributing binary options to retail clients took effect on 3 May 2021 and was extended until 1 October 2031. See the ASIC announcement extending the binary options ban. An artificial underlying price does not, by itself, remove a contract from that prohibition.
How Synthetic Indices Generate Prices
In the simulated products discussed here, software combines random inputs with rules governing how the price behaves. Those rules can determine the size and frequency of movements or introduce jumps. These are distinct from products that use derivatives to reproduce exposure to real assets, a distinction covered in DayTrading.com’s overview of synthetic index structures.
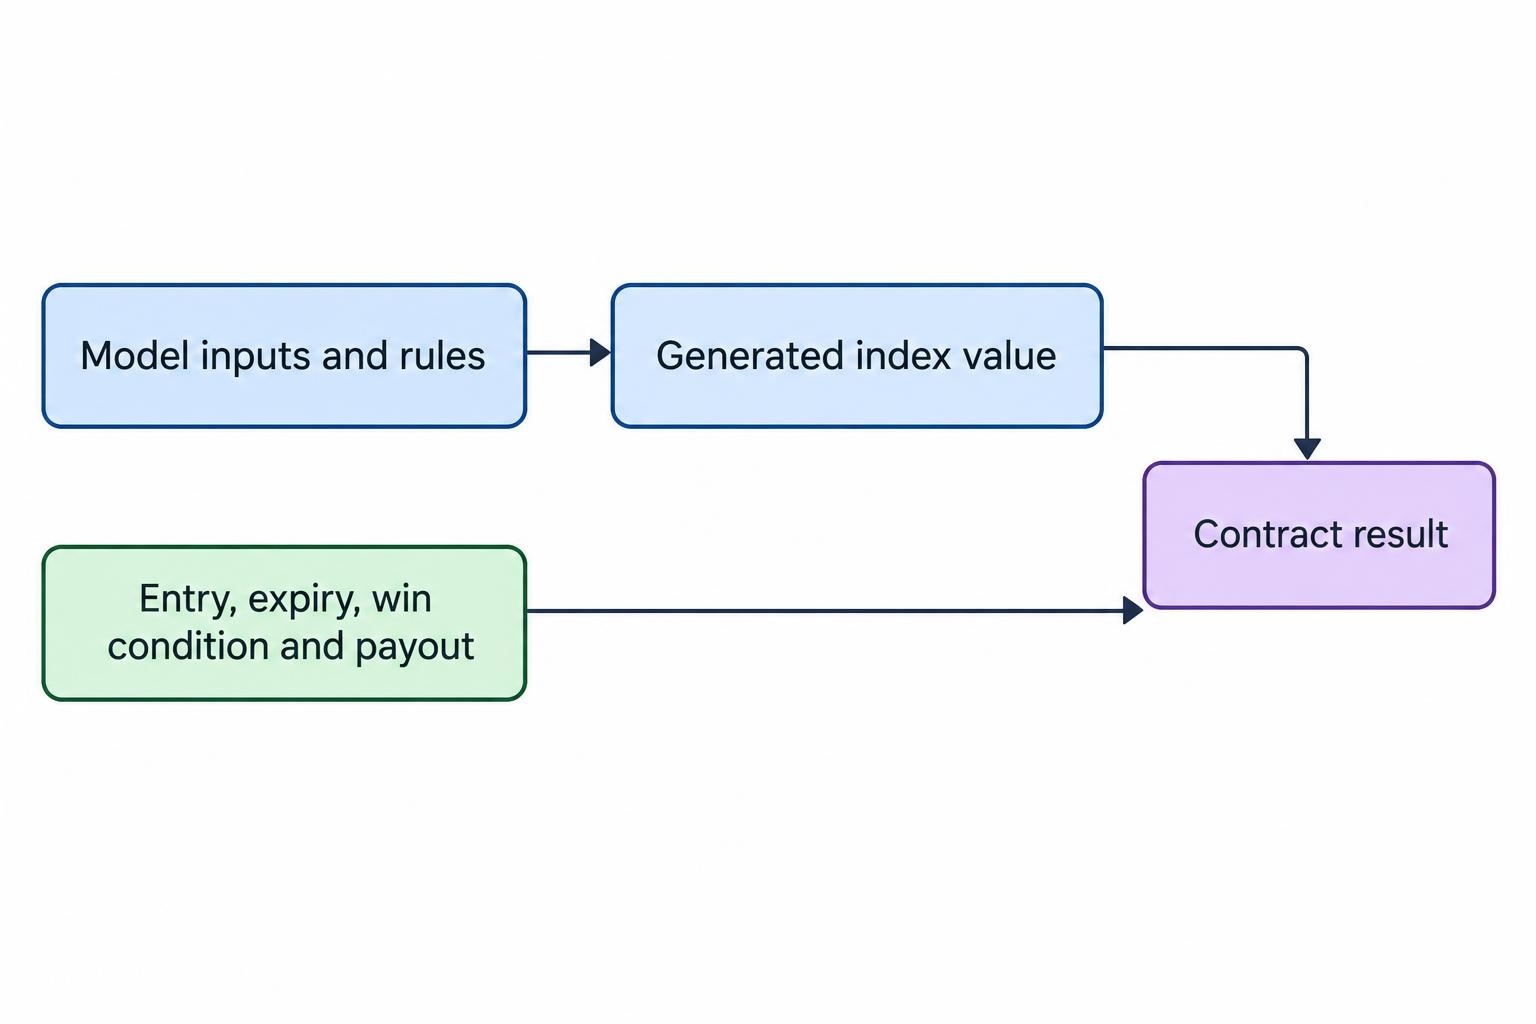
Think of the process as two separate layers. The first produces the index value. The second defines the contract offered against that value: its entry price, expiry, winning condition and payment.
A properly functioning price generator would not settle every question about the contract. The payout could still be unattractive. Equally, an appealing payout would not establish that the price generation process is reliable. Assessing one layer while ignoring the other leaves half the job unfinished.
There is also no reason to treat the displayed index level as a valuation. A generated index at 8,000 is not necessarily expensive relative to its own past, nor does a fall to 4,000 make it cheap. Without underlying earnings, assets or cash flows, that interpretation needs a different basis.
Common Synthetic Index Families
Product names describe intended behaviour, not a universal set of contract specifications. The same broad label should never replace reading the terms for the actual instrument.
| Family | Typical design | What to check |
|---|---|---|
| Volatility indices | A model targeting a stated volatility characteristic | How volatility is defined and over what period |
| Boom and crash indices | A price process containing upward or downward spikes | Whether quoted spike frequency is an average rather than a schedule |
| Jump indices | A price process containing occasional larger movements | Jump direction, size assumptions and timing rules |
| Step indices | Movement through prescribed increments | Step sizes and the probabilities attached to them |
Availability and naming differ between providers; BrokerListings’ comparison of synthetic index product ranges illustrates those differences. None of these family names establishes the probability of winning a particular binary option.
An average event frequency deserves particular care. Suppose a hypothetical model produces a jump every 500 updates on average. That statement does not promise a jump on update 500. Events could cluster, or a long interval could pass without one.
If each update has an independent event probability, a long wait does not make the next event overdue. If the model uses a different process, its documented rules must establish how the probability changes. Counting candles is not a substitute for knowing the model.
Synthetic Volatility Indices Are Not the VIX
The word “volatility” creates an easy naming trap. A simulated volatility index and the Cboe Volatility Index, or VIX, are not interchangeable.
The VIX uses S&P 500 option prices to measure market expectations of volatility over approximately 30 days. Its inputs come from an actual options market, as set out in the Cboe VIX methodology. A simulated index with a volatility label does not acquire that connection because its name sounds similar.
This changes what a chart can tell you. With a simulated series, the research question concerns the model and its statistical behaviour. With a market derived benchmark, the question also concerns the transactions or quotations feeding the calculation.
Nor should an index number be read as a winning probability. A number in a product name does not establish your chance of correctly predicting its next movement. It also says nothing, on its own, about the amount you could lose.
What a Binary Contract Actually Measures
The index supplies a reference value. The contract decides which observation matters.
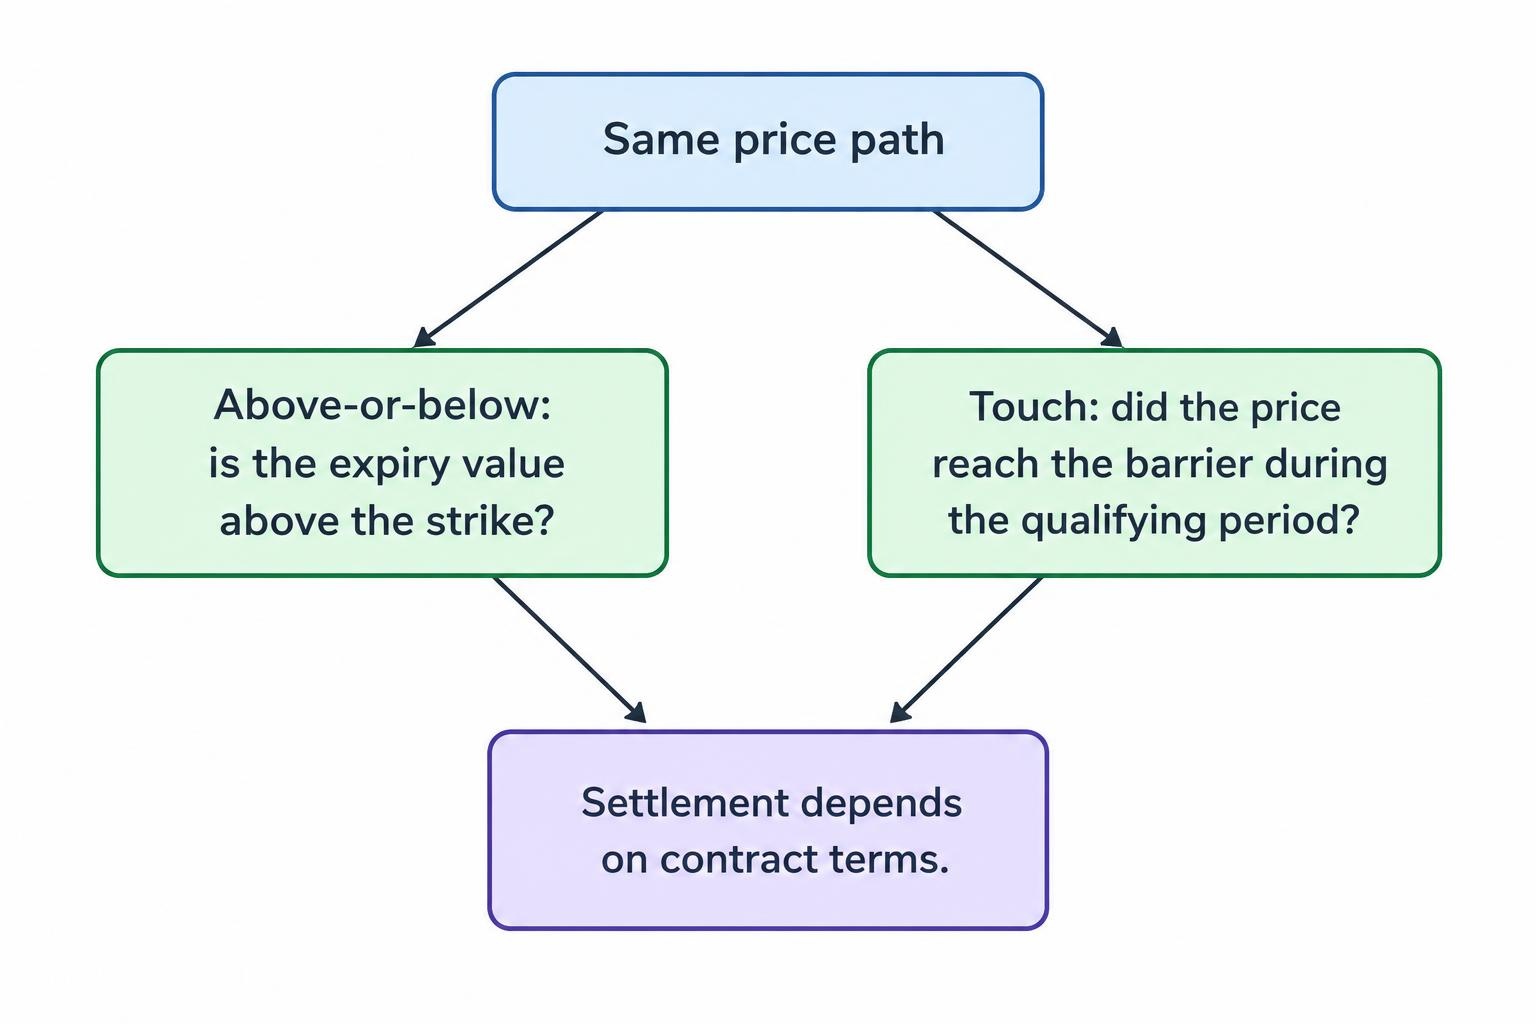
Consider a hypothetical above-or-below contract starting when the index reads 10,000. It wins only if the settlement value is strictly above 10,000 after five minutes. A rise to 10,080 during the contract would not secure a win if the final qualifying value fell to 9,999.
A touch contract would ask a different question. It might depend on whether the price reached a barrier at any qualifying point during the contract. The same price path could therefore produce different results under different contract terms.
Before analysing a chart, establish:
- Which index and price feed determine the result.
- When the entry value becomes binding.
- Whether expiry uses elapsed time, a fixed timestamp or a number of price updates.
- What happens when the settlement value equals the strike.
- How missing prices, interruptions and disputed observations are handled.
These are settlement questions, not minor administrative details. The relevant evidence includes the accepted contract record and the price feed and benchmark rules, rather than a screenshot taken from a different chart.
For research purposes, separate what the chart displays from what the contract records. A rounded chart label might not contain enough precision to reconstruct a result. Ask which stored value is authoritative and whether you can obtain it after the event.
Payouts Matter More Than a Familiar Looking Chart
A price series can look balanced while the contract offered against it has an unfavourable payoff. Randomness and commercial terms answer different questions.
The joint CFTC and SEC investor alert on binary options demonstrates how a payment smaller than the amount lost can create a negative expected return even with an equal chance of winning and losing.
Consider a separate hypothetical example: a $100 stake earns $80 net profit when successful and loses $100 when unsuccessful. Assume no fees, refunds or ties.
Across 100 contracts with exactly 50 wins and 50 losses, winning contracts generate $4,000 of profit. Losing contracts cost $5,000. The result is a $1,000 loss despite getting half the predictions right.
The break-even win rate is:
$100 ÷ ($100 + $80) = 55.56%.
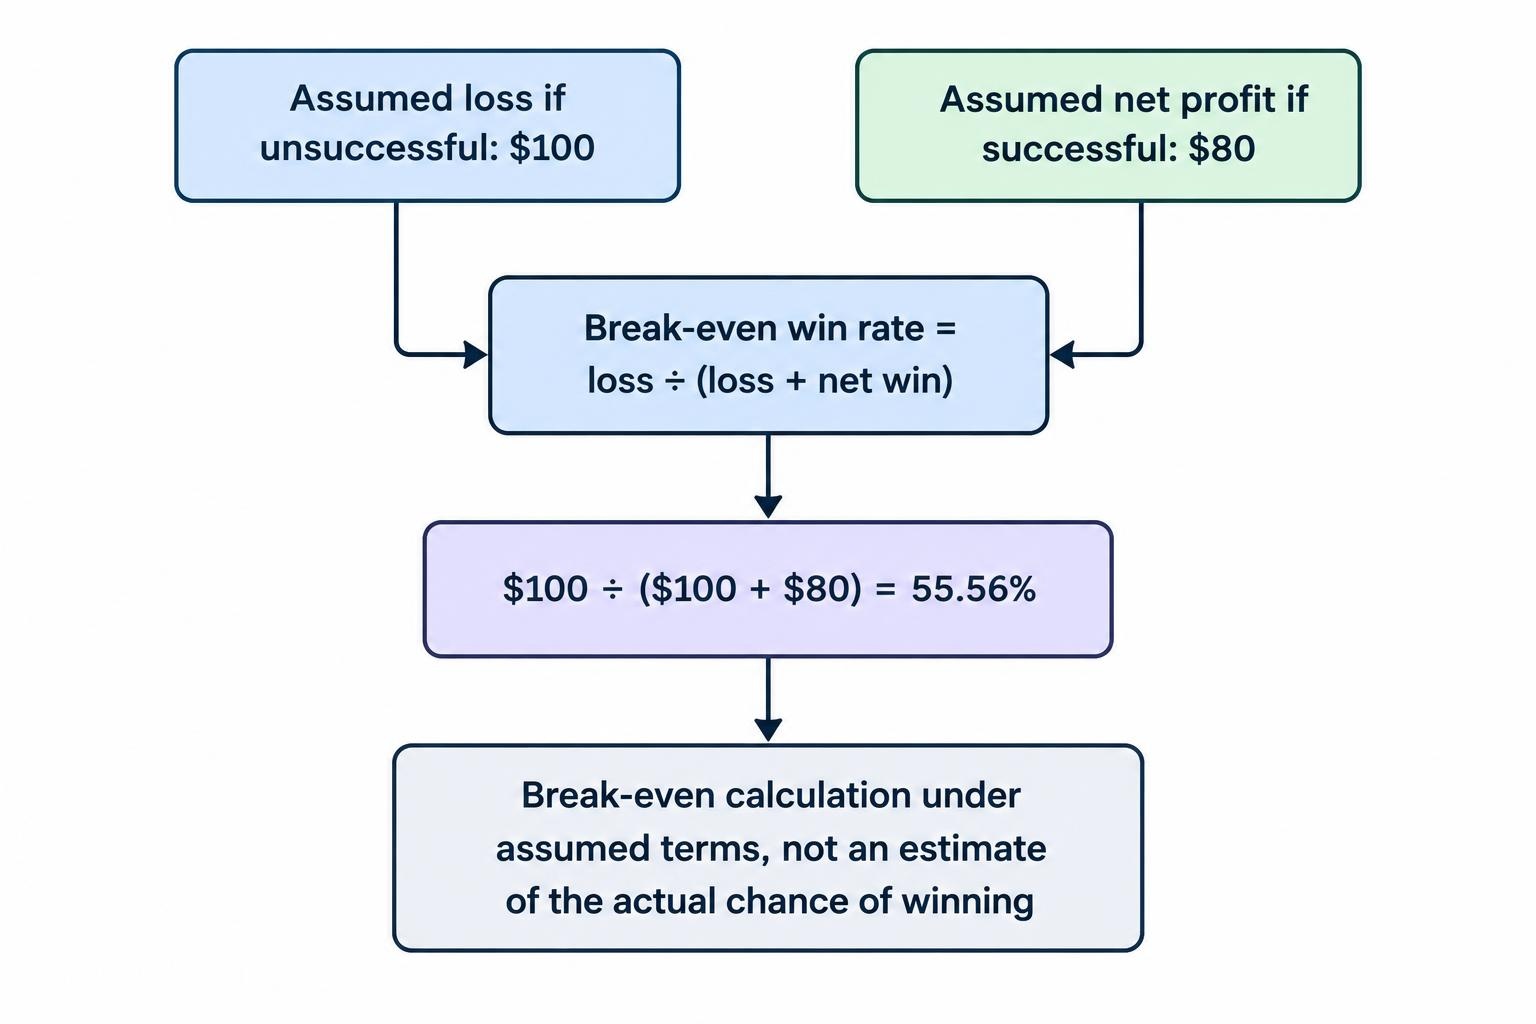
That calculation does not estimate the actual probability of success. It establishes the minimum success rate needed under those assumed terms. Whether a proposed method can reach it is a separate research problem.
A larger possible price movement does not automatically improve the proposition. What matters is the relationship between the winning condition, its probability and the amount paid. The fuller treatment belongs in probability and expected value in binary options.
What Randomness Tests and Audits Can Establish
Claims such as “random,” “secure” and “independently audited” need a defined scope. They should not be treated as interchangeable endorsements.
A randomness assessment might examine the generator’s output. A security review might examine access controls. A settlement review might examine whether contracts use the published prices correctly. Those are different assignments.
NIST’s guidance on statistical testing of random number generators states that statistical tests cannot absolutely certify a generator as suitable for a particular application. Passing a test battery is evidence about the tests performed, not proof of every claim made about a trading platform.
When reviewing an audit claim, ask for the report or a verifiable statement identifying its subject, date and scope. Does it cover the current generator? Does it examine the production system or a sample? Does it include the conversion from random inputs into index prices?
Then ask what remains outside that scope. A generator assessment would not automatically establish that withdrawals are reliable, client records are accurate or a contract offers favourable expected value.
The reverse matters too: an unusual losing sequence is not proof of manipulation. A credible complaint needs records showing a conflict with the published rules, not simply an outcome that felt improbable.
Can Technical Analysis Predict Synthetic Indices?
Indicators can summarise a generated series. A moving average can describe its recent direction, and a volatility measure can describe its recent movement. Neither calculation needs a real underlying asset to produce a number.
The harder question is whether that number predicts the contract’s outcome. Calculation is not validation.
For a hypothetical process with independent future increments and no directional bias, drawing support and resistance on the past does not create predictive information about the next increment. A different model may contain dependence, drift or changing states, but any claimed advantage must be demonstrated rather than assumed.
Explanations borrowed from real markets also need scrutiny. Claims about institutional buying, corporate news or traders defending an order level require evidence that those mechanisms influence the generated series. A familiar candle shape does not establish a familiar cause.
Test the Contract, Not Just the Chart
A useful research exercise starts with fixed rules and untouched test data. Record the signal, entry observation, expiry, payout and result. Include every qualifying signal rather than selecting the cleanest examples afterwards.
Keep any rule development separate from the final evaluation. Trying many indicators and retaining the best historical combination can produce an impressive result by chance. The CFTC advisory on internet trading systems warns about hypothetical performance and the difference between simulated results and actual trading.
For binary contract research, candle data alone may be insufficient. A strategy tested at candle closes may not reproduce an expiry that occurs between them. Likewise, assuming one payout throughout a dataset can distort the calculation if the actual terms changed.
State the assumptions openly. A result based on estimated entries and assumed payouts is an illustration, not a verified trading record. Practice can help test record keeping and contract comprehension; it does not establish that a method will earn money.
Trading Hours and Operational Risk
Simulated synthetic indices can operate outside conventional exchange hours because their calculation does not require an underlying exchange to remain open. Some are offered around the clock. That is an availability characteristic, not a safety feature.
A continuous calculation still leaves practical questions. What happens during platform maintenance? Can a contract expire while the customer interface is unavailable? Which record determines settlement if the displayed chart stops updating?
Use those questions to evaluate the terms rather than assuming uninterrupted access. A calculation engine, customer interface and account system are separate components; the research task is to establish how the contract handles failures between them.
Continuous availability also removes a natural stopping point. For a paper research exercise, define session boundaries and review periods in advance. More observations can improve a dataset, but more impulsive decisions do not improve its quality.
What Australian Readers Should Check
Do not confuse the underlying index with the legal form of the product. A binary option, a CFD and another derivative can reference a similar price series while creating different rights, obligations and risks.
The Australian binary options restriction concerns issuing and distributing the product to retail clients. It should not be casually restated as a ban on every instrument carrying a synthetic index label. Equally, changing the underlying to a generated price should not be treated as a loophole. The broader position is covered in binary options regulation in Australia.
For any product assessment, identify the contracting entity, the actual contract type and the rules applying to the client. A functioning registration form or payment screen does not answer those questions.
The central distinction remains straightforward: synthetic indices provide a designed price process, not ownership of productive assets or a direct reading of an underlying market. Their appearance tells you less than their methodology, settlement rules and contract economics.
When comparing them with other binary options markets, start with where the price comes from. Then establish what the contract measures and whether its terms can support the claimed result. The chart comes after those questions, not before.
This article was last updated on: October 22, 2026