Binary options loss statistics need two things: a number and a clear explanation of what that number measures. The percentage of accounts that lost money is not the percentage of trades that failed. Total client losses are not the same as the average loss per person.
Australian regulatory records provide useful evidence, but their dates, client populations and calculation methods matter. These are historical findings about defined groups, not a current worldwide loss rate or a forecast of what any one trader will lose.
What Australian binary options loss statistics show
ASIC’s 2022 analysis of binary options client outcomes examined data obtained from five licensed issuers, one of which issued no binary options during the reviewed period. Its findings included the following figures. All dollar amounts below are Australian dollars.
| Measure | Finding | Measurement period |
|---|---|---|
| Active retail clients who lost money | 74%–77% in each reporting quarter before the ban | April 2020 to 2 May 2021 |
| Combined net losses of losing retail accounts | $15.7 million | 1 April 2020 to 2 May 2021 |
| Combined net profits of profitable retail accounts | $1.74 million | 1 April 2020 to 2 May 2021 |
| Aggregate retail account result | Approximately $14 million in net losses | 1 April 2020 to 2 May 2021 |
The percentage range describes outcomes within reporting periods. It is not a single calculation of how many distinct people lost across the entire 13 months. The dollar figures also distinguish losses among losing accounts from the aggregate result after profitable accounts are included.
The earlier 80% loss rate and $490 million estimate
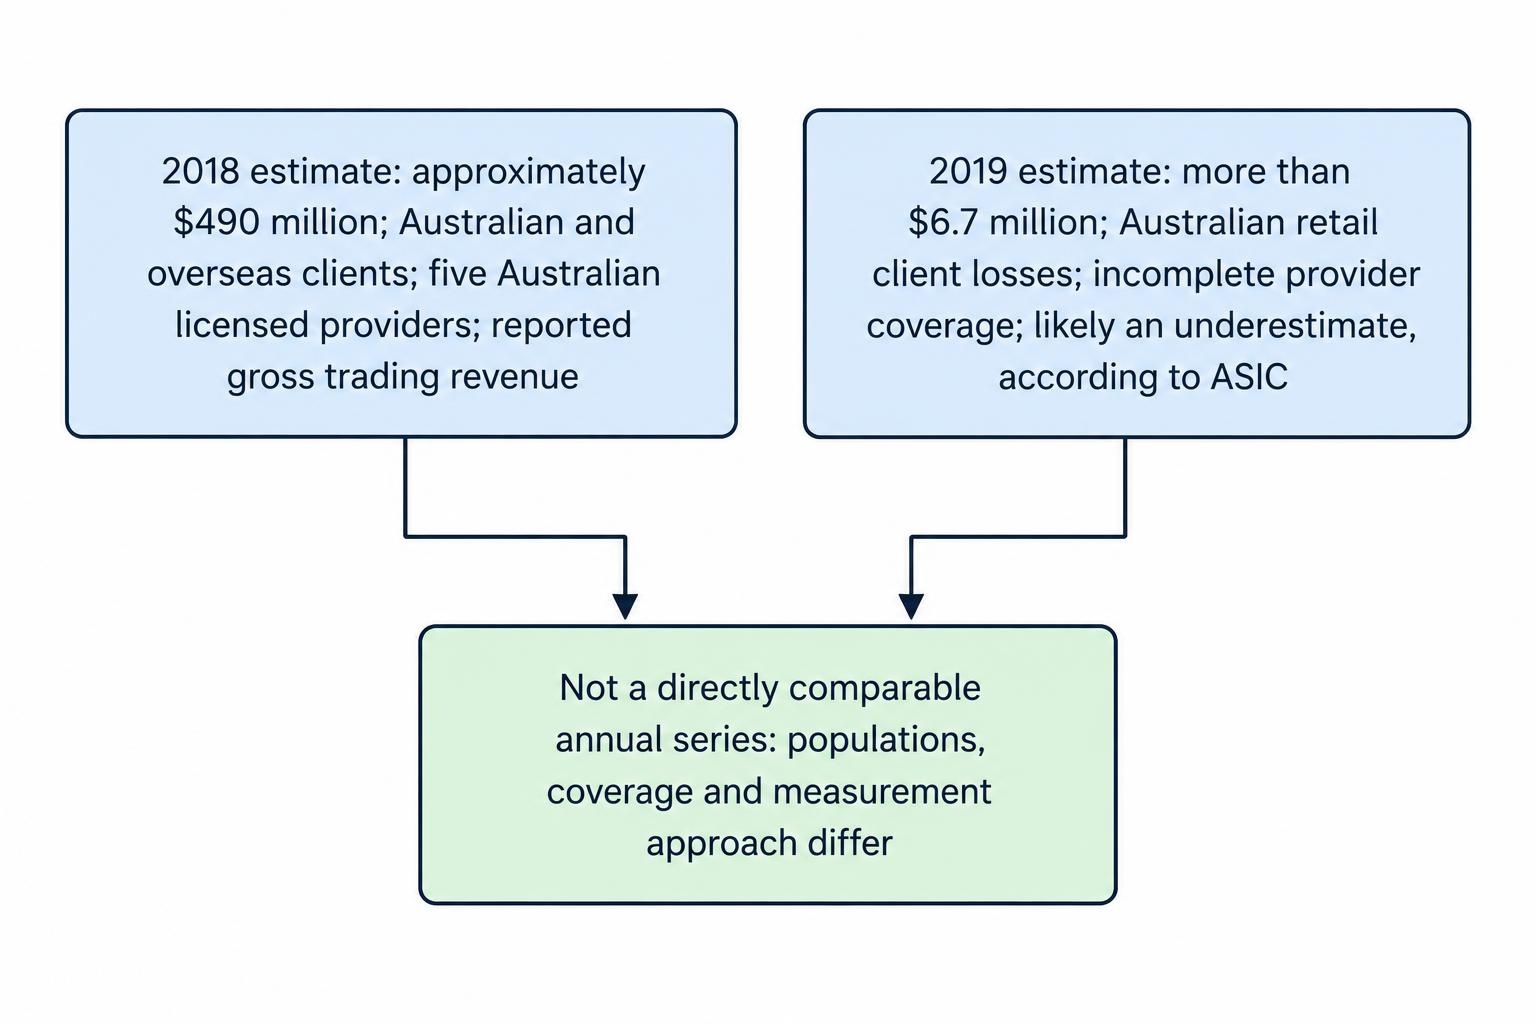
ASIC’s April 2021 public notice supporting the binary options intervention records an earlier finding: providers in its 2017 review reported that approximately 80% of their binary options clients lost money. That population included clients in Australia and overseas.
The notice also records estimated retail client losses of approximately $490 million during 2018, covering Australian and overseas clients trading with five Australian licensed providers. That estimate used reported gross trading revenue, which largely reflected client trading losses plus spreads, fees and commissions.
A separate estimate put Australian retail client losses during 2019 above $6.7 million. It did not capture every licensed provider, so ASIC considered it likely to underestimate the relevant losses.
These figures cannot support a straightforward claim that Australian residents’ losses fell from $490 million to $6.7 million. The populations differ, the coverage differs, and the earlier estimate used a revenue based approach. Putting the amounts beside each other does not make them a comparable annual series.
What does “lost money” actually mean?
A losing account is not a losing trade
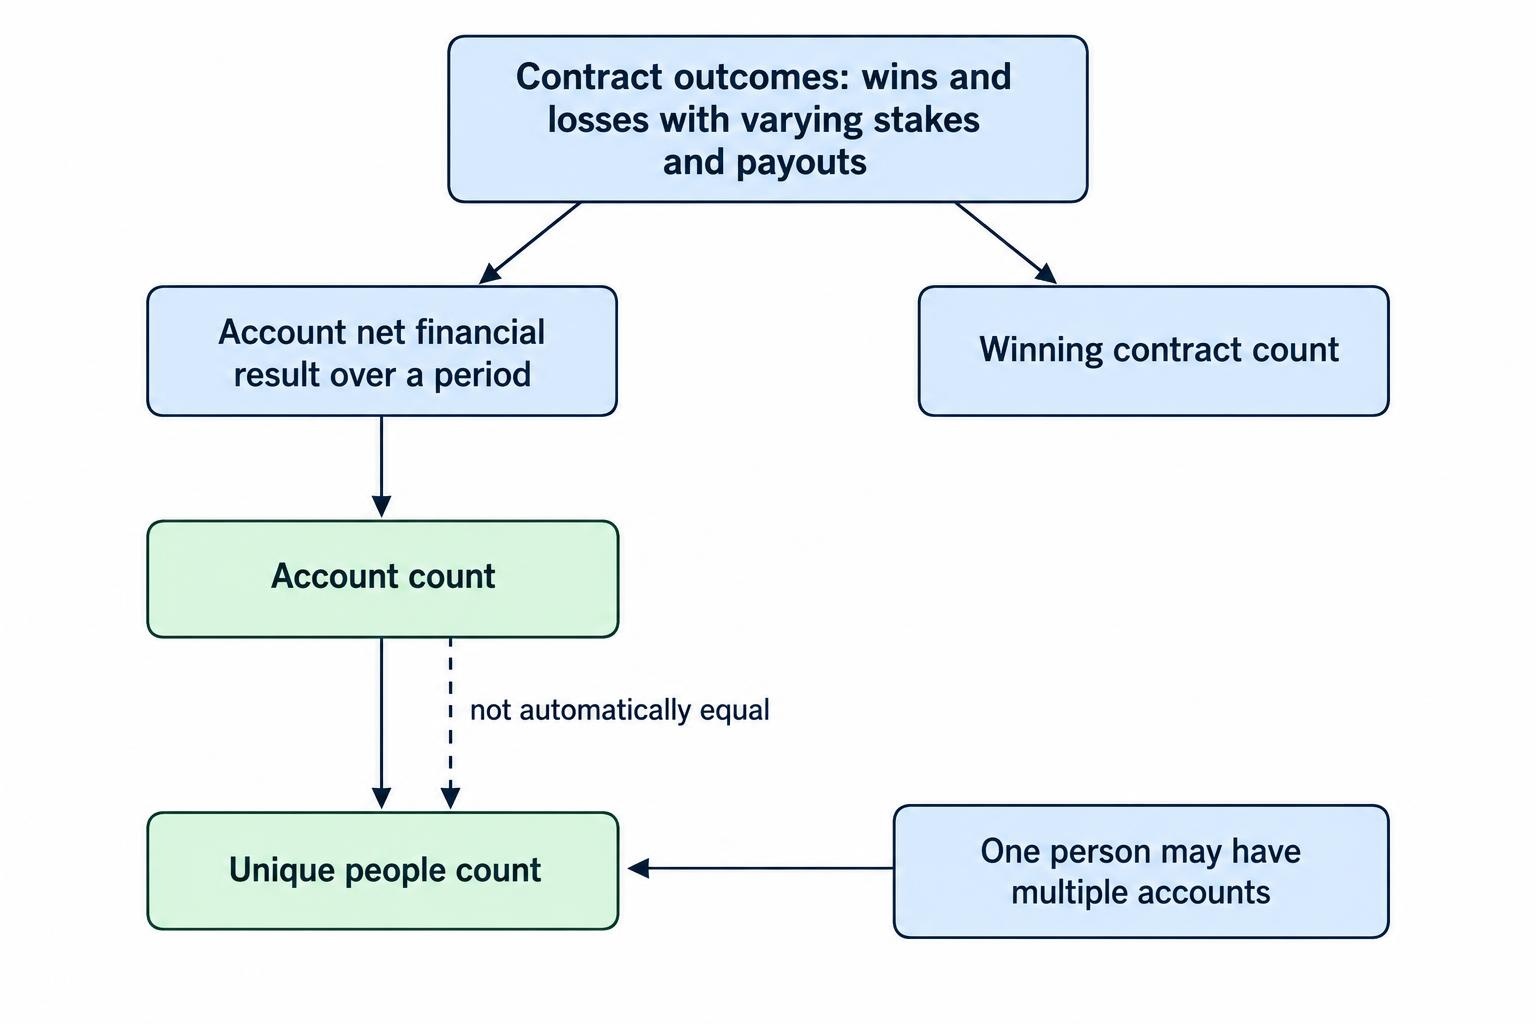
Suppose a hypothetical account completes 100 contracts and finishes below its starting value. That is one losing account, regardless of whether 40, 50 or 60 contracts lost. An account loss statistic measures the financial result over a period; a trade loss statistic counts individual outcomes.
The distinction matters because payout amounts and stakes can vary. A trader can win more contracts than they lose and still finish with less money. Conversely, counting profitable accounts tells you nothing about how much those accounts earned.
Account counts also need careful treatment. One person may hold more than one account. Without a method for identifying the same customer across providers, an account based dataset should not automatically be described as a count of separate people.
A loss does not necessarily mean an emptied account
An account that falls from $1,000 to $990 has lost money. So has an account that falls from $1,000 to zero. A headline reporting the proportion of losing accounts does not distinguish those outcomes unless it also provides the size or distribution of losses.
Useful supporting measures include the median loss, average loss, starting account value and percentage drawdown. Each answers a different question. An average can be pulled upwards by a few large losses, while a median does not reveal how severe the largest losses became.
For an individual record, deposits and withdrawals must be separated from trading performance. Adding $500 to an account is not a $500 profit. A trading journal that records cash movements and contract results separately helps prevent that basic accounting error.
Why a winning trade percentage can still produce losses
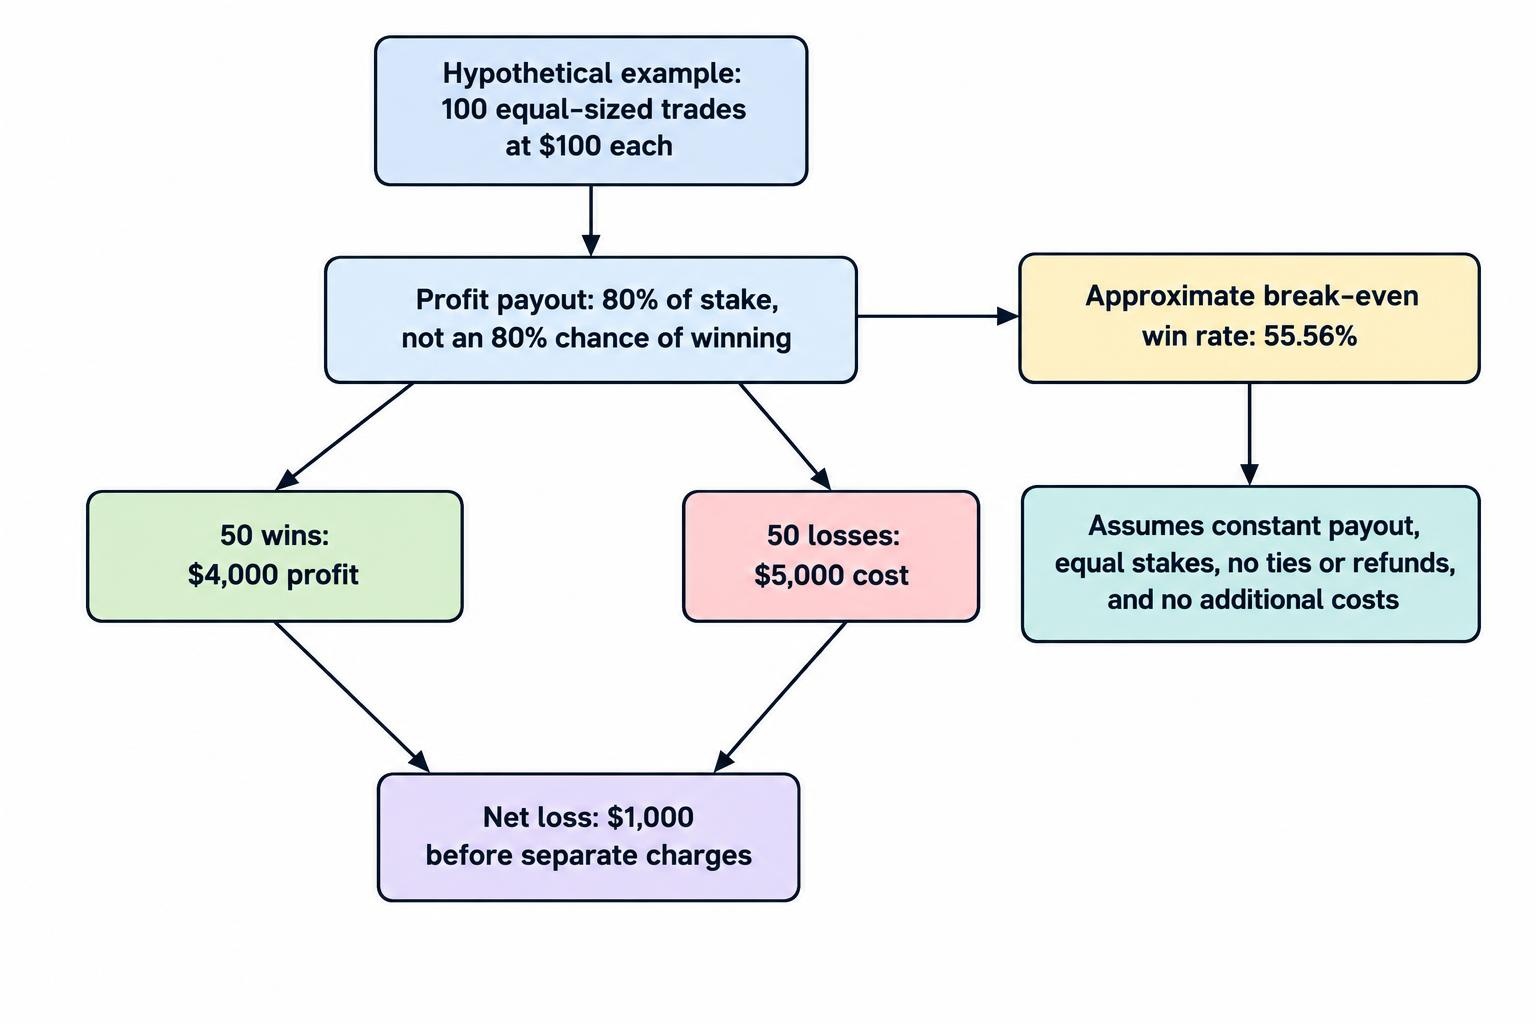
Consider a hypothetical contract with a $100 stake. A winning outcome returns the stake plus $80 profit; a losing outcome loses the full $100. Here, “80% payout” means profit equal to 80% of the stake, not an 80% probability of winning.
Across 100 equal sized trades, 50 wins generate $4,000 in profit and 50 losses cost $5,000. The result is a $1,000 loss, before any separate charges. Half the predictions were correct, but the account still lost money.
With those assumptions, the break-even win rate is:
100 ÷ (100 + 80) = approximately 55.56%.
This calculation assumes a constant payout, equal stakes, no ties or refunds, and no additional costs. It is an illustration of contract arithmetic, not an estimate of traders’ actual success rates.
Stake variation creates another problem for headline accuracy claims. Nine winning $10 trades at an 80% profit payout earn $72. One losing $100 trade then leaves a $28 loss. That record has a 90% win rate. The percentage looks impressive; the account is still down.
A meaningful performance record therefore needs both outcomes and amounts. The relationship between payout, probability and profitability is covered in the guide to probability and expected value in binary options. A published win rate without those details cannot establish a profitable result.
Trading frequency changes what the statistics mean
A one day result and a six month result are different observations. A profitable session does not establish that the same account stayed profitable after further trading. Equally, one losing session does not reveal the eventual result of an entire account history.
In the hypothetical equal stake example above, each trade has an expected loss of $10 if its true winning probability is 50%. Repeating that unchanged setup 100 times gives an expected loss of $1,000. That is a mathematical expectation across possible outcomes, not a promise that every sequence will finish at exactly that amount.
Random variation also matters. Under an independent 50% loss probability, five losses in one designated block of five trades have a probability of 3.125%. That is not the probability of encountering a five trade losing streak somewhere within a much longer history.
These distinctions help explain why a short record cannot settle a claim of lasting profitability. The observation window and the number of trades belong beside the result, not buried beneath it.
How to assess a broker or signal service’s loss statistics
Before comparing percentages, check whether they describe the same thing. A platform’s account profitability figure cannot be directly compared with a signal service’s prediction accuracy. Nor can a demo result establish the financial outcome of a funded account.
A useful disclosure should answer four questions:
- Who was counted? Active accounts, all registered users, paying subscribers or a selected group?
- What period was measured? A calendar quarter, a complete year or selected trading sessions?
- How was performance calculated? Net money earned, winning contracts or returns before charges?
- What was excluded? Closed accounts, refunded trades, missed signals, fees or incomplete records?
Watch the denominator
A profitability rate depends on the population beneath it. A result for customers who completed a training programme does not describe everyone who enrolled. A result for accounts still active at year end does not necessarily describe accounts that closed earlier.
Those exclusions do not automatically prove misconduct. They do change the question the statistic answers. A defensible comparison needs consistent inclusion rules, rather than whichever group produces the most attractive percentage.
Separate a complete record from selected evidence
A screenshot can show an account balance or several successful trades. On its own, it does not establish starting capital, deposits, withdrawals, earlier losses or the length of the trading history.
For signal claims, the record should preserve every recommendation with its original publication time, entry conditions, expiry and applicable payout. Missing or retrospectively edited recommendations make the calculation harder to reproduce. The guide to evaluating trading signal track records covers those checks in more detail.
Ask whether another reviewer could reach the same result from the underlying records. If the calculation cannot be reproduced, a precise looking percentage offers less evidence than it appears to.
Trading losses and fraud losses are different datasets
Fraud introduces a separate measurement problem. The joint SEC and CFTC investor alert on binary options fraud identifies complaints involving withheld customer funds, identity theft and software manipulation intended to generate losing trades.
A reported scam loss is not necessarily a loss from settled market contracts. It may involve money deposited into a fraudulent operation, a balance that cannot be withdrawn, or transactions that were never genuine.
Likewise, the number of complaints does not reveal the percentage of all customers affected unless the total relevant customer population is known. Complaint totals and account trading statistics answer different questions.
Do not simply add the two datasets together. The same money could appear in both a trading record and a complaint, creating double counting. A sound combined estimate would need clear definitions, matching dates and a method for removing overlap.
What the Australian ban means for interpreting current claims
Australia’s prohibition on issuing and distributing binary options to retail clients took effect on 3 May 2021. It remains in force, with the ban extended until 1 October 2031 through the 2022 binary options product intervention extension.
That creates a break in the data. Pre-ban client results should not be relabelled as the loss rate for Australian retail traders in 2026. A post-ban disclosure would need to identify the provider, jurisdiction, customer classification and products involved before it could be compared with the earlier evidence.
Nor would an absence of trading losses in a population that no longer trades demonstrate improved trading ability. No exposure and profitable exposure are different outcomes. This is a measurement point, not a small technicality.
The guide to binary options regulation in Australia explains the legal position separately. Historical loss statistics should not be read as an invitation to find a platform outside that framework.
Reading the evidence without overstating it
The regulatory findings document substantial losses within the populations examined. They do not establish a universal personal loss probability, a worldwide average loss or a guaranteed outcome for every account.
The most useful statistic identifies its population, period, financial measure and exclusions. Keep those details attached to the number. Without them, “most traders lose” may communicate a warning, but it cannot do the work of a properly defined dataset.
This article was last updated on: October 22, 2026