Forward testing binary options strategies means applying fixed trading rules to new market data as it arrives, recording decisions before the outcome is known. The purpose is to check whether a strategy remains workable without hindsight, not to turn a promising backtest into a profit guarantee.
For Australian retail readers, this is an educational exercise using paper records or simulation. ASIC’s ban on the issue and distribution of binary options to retail clients took effect on 3 May 2021 and extends until 1 October 2031. ASIC’s binary options ban extension sets out that restriction. A successful simulation does not change it.
What Forward Testing Actually Measures
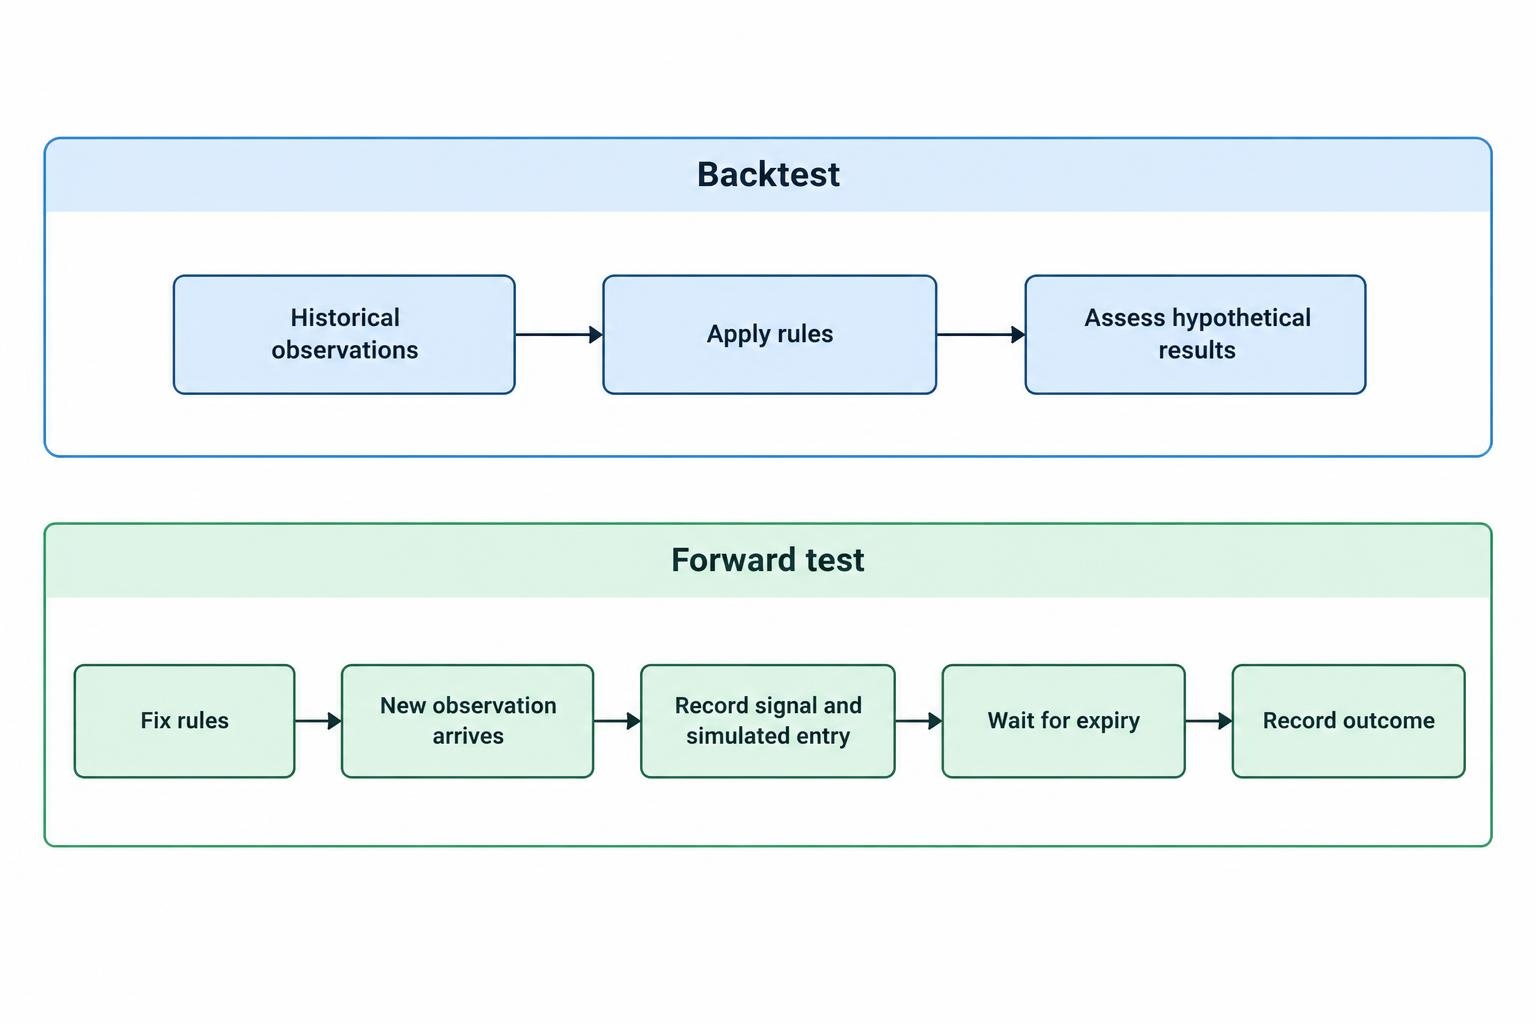
A backtest applies rules to historical data. A forward test applies rules to observations that become available after the rules have been fixed. Both can use hypothetical trades; “forward” does not mean “funded”.
The distinction from backtesting binary options strategies is the timing of the decision. Looking at yesterday’s completed chart and marking trades is still historical analysis. Recording a signal now, then waiting for its expiry, is forward testing.
That timing helps answer practical questions. Can the entry condition be recognised before the opportunity passes? Is the expiry unambiguous? Do the rules produce the same decision on repeated occasions, or does every chart require a fresh interpretation?
Forward testing also provides another check against selecting a strategy that happened to fit past noise. Repeatedly searching historical data for the best settings raises the risk of false discoveries, a problem examined in the research paper The Probability of Backtest Overfitting. A fresh test is useful evidence, but it does not erase the number of unsuccessful versions tried before it.
Freeze the Rules Before Collecting Results
Start with a dated strategy specification. Someone else should be able to read it and reach the same decision from the same information. “Enter when momentum looks strong” leaves too much room for interpretation.
The specification should cover five areas:
- Market and observation window: the instrument, data feed, trading session and time zone.
- Signal and entry: the exact conditions, whether they require a completed candle, and the permitted delay before a simulated entry.
- Contract assumptions: direction, strike, expiry, net payout, settlement data and treatment of ties.
- Exposure: a fixed virtual stake, permitted overlapping positions and any session stopping rule.
- Review conditions: the planned observation period, sample objective and reasons for pausing the test.
Separate signal time from entry time. If a condition becomes valid at a candle close, do not automatically award the simulation that candle’s closing price. Specify how the next observable quote will become the simulated strike.
Likewise, distinguish “expires 15 minutes after entry” from “expires at the next quarter hour”. They create different holding periods when an entry occurs between clock intervals.
Keep the virtual stake unchanged during the first evaluation. Increasing it after losses mixes signal performance with a staking system. The cleaner question is whether the strategy earns a positive return per unit staked under its stated assumptions.
Record Decisions Before Recording Outcomes
Choose What the Simulation Represents
A manual paper test can record hypothetical contracts against a continuing price feed. A demo environment may provide simulated acceptance, expiry and settlement records. Label these methods separately rather than combining them into one performance total.
If a chart is the only data available, describe the exercise as a price direction proxy test. It does not reproduce a contract unless the strike, expiry and settlement rules are also defined. An assumed payout should remain labelled as an assumption, not presented as an available offer.
Write down how missing quotes, feed interruptions and unclear settlement observations will be handled. Do not improvise those rules after discovering whether the affected trade would have won.
Keep an Auditable Journal
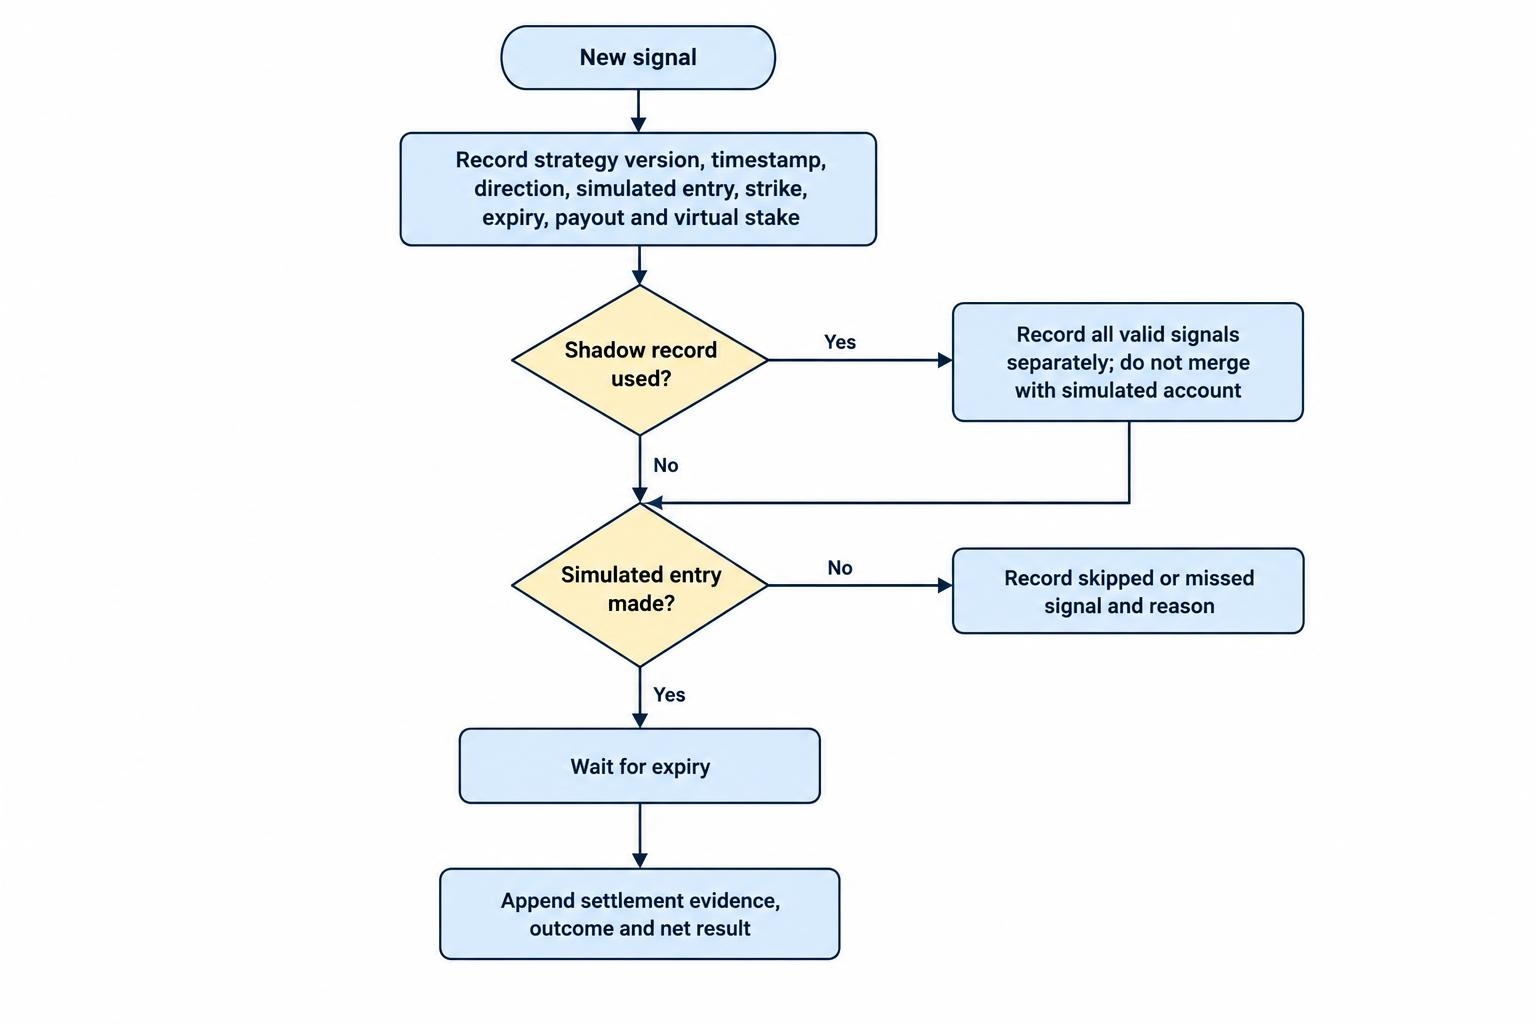
Record the strategy version, signal timestamp, direction, simulated entry timestamp, strike, expiry timestamp, payout and virtual stake. After expiry, append the settlement observation, outcome and net result. Use one time standard throughout, such as UTC.
A structured trading journal should also preserve screenshots or other contemporaneous evidence where practical. The record needs to show what was available at the decision point, not just a chart captured after the winning move.
Log skipped signals with reasons. A rule compliant skip, such as an entry outside the observation window, differs from a valid signal missed because the operator was distracted. Those are different findings and deserve separate labels.
Do not add a missed winner to the simulated account at its earlier price. The entry was missed, it stays missed. If useful, maintain a separate shadow record of all valid signals, with each signal documented before its outcome. Never merge that record with the account the operator actually simulated.
Measure Returns, Not Just Winning Trades
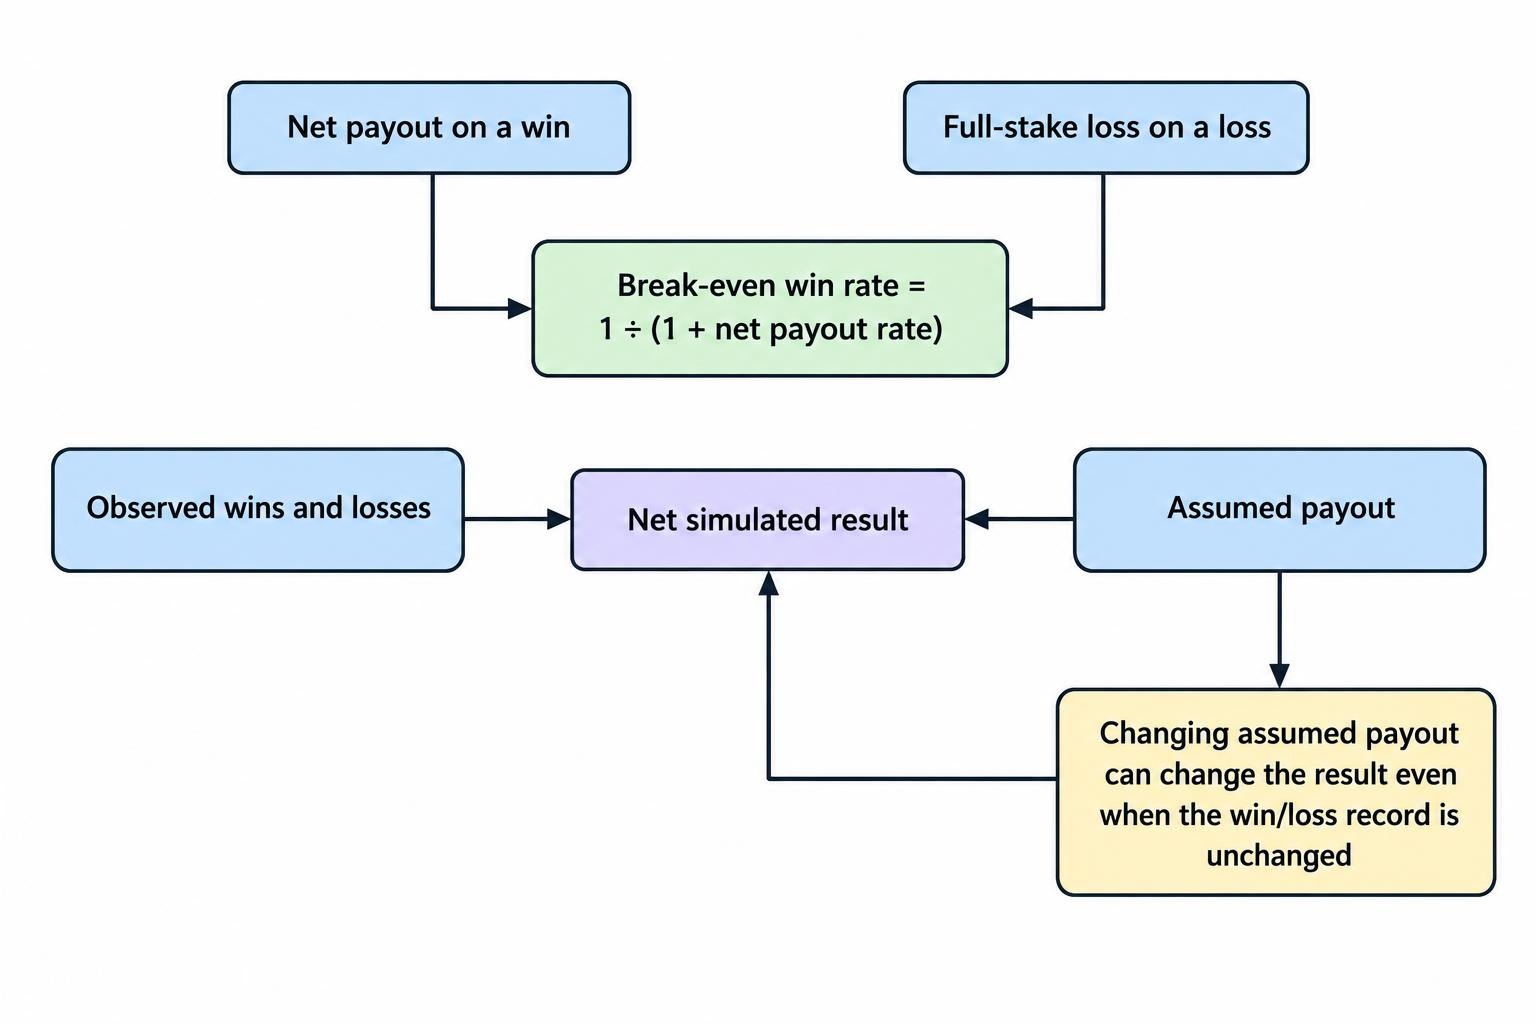
For a contract that loses the full stake when unsuccessful, the winning percentage alone cannot establish profitability. The net amount earned on a winner matters just as much.
Suppose a hypothetical winning contract returns the original stake plus 80% profit. A $100 virtual stake then produces an $80 net gain on a win or a $100 loss on a loss. Assuming no fees, refunds or ties:
Break-even win rate = 1 ÷ (1 + net payout rate)
At an 80% net payout, the break-even rate is approximately 55.56%. This relationship is developed further in the guide to probability and expected value in binary options.
Consider an illustrative forward test with 200 simulated trades, 112 wins and 88 losses. Every virtual stake is $100. The table holds those outcomes unchanged and varies only the assumed payout.
| Net profit on a winner | Break-even win rate | Net result over 200 trades |
|---|---|---|
| 75% | 57.14% | −$400 |
| 80% | 55.56% | +$160 |
| 90% | 52.63% | +$1,280 |
These are arithmetic scenarios, not forecasts of results under different market conditions. At the baseline 80% payout, the $160 gain equals 0.8% of the $20,000 total amount staked. It is not a return on starting account capital.
Where recorded payouts vary, calculate each trade’s net result separately and then sum them. Keep refunds, losses, wins and unresolved outcomes distinct. Do not quietly remove awkward observations to improve the percentage.
How Much Forward Testing Is Enough?
Neither a fixed number of trades nor a fixed number of weeks can settle every strategy evaluation. Set both a sample objective and an observation window before starting. A strategy producing several signals each session presents a different collection problem from one producing a few signals each month.
The 200 trade example also shows why a small positive result deserves restraint. With 112 wins, the observed win rate is 56%. Under an independent, constant probability binomial model, a two sided 95% Wilson confidence interval is approximately 49.1% to 62.7%, calculated using the NIST method for confidence intervals for proportions.
That interval includes the 55.56% break-even threshold for an 80% payout. The sample therefore does not establish that the underlying win probability exceeds break-even. A green balance is not the same thing as persuasive evidence.
Choose review points in advance rather than ending the test as soon as the account turns positive. Record results at those points even when they are disappointing. If collection ends early because of a data failure or a breached pause rule, report the shortened test rather than presenting it as a completed evaluation.
Check Whether the Observations Are Comparable
The statistical model also needs scrutiny. The NIST description of the binomial distribution assumes a fixed success probability across trials. A strategy tested across changing sessions or market conditions may not fit that assumption well.
Overlapping positions create another concern. Ten hypothetical contracts opened seconds apart on the same move should not automatically be treated as ten independent pieces of evidence. Tag related signals and report their concentration by session or event.
Keep predetermined breakdowns by market, session and expiry where relevant. Treat patterns noticed only after inspecting the results as ideas for a later test, not as established filters. “It works on Tuesdays” is a hypothesis until fresh observations support it.
Keep Strategy Changes Out of the Validation Sample
Forward testing loses its purpose when every losing patch triggers a new filter. Changing the indicator settings, payout threshold or expiry after inspecting results turns the same observations into development data.
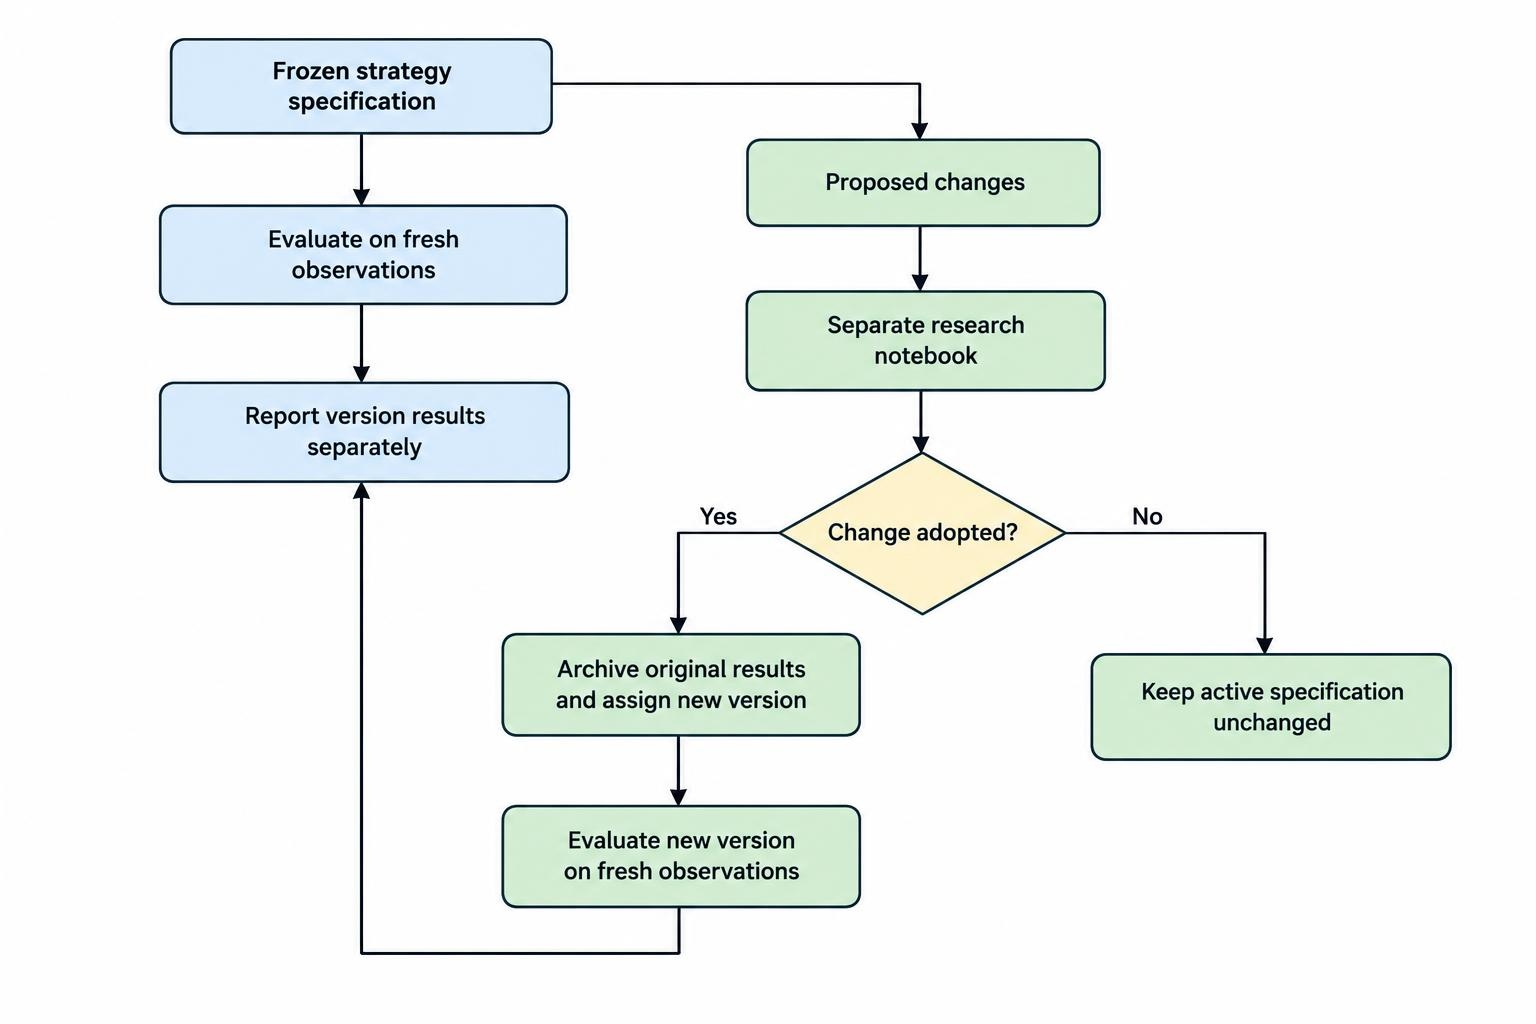
Keep a separate research notebook for proposed changes. Record the proposed rule and why it might help, but leave the active specification untouched until its planned review.
If a change is justified, archive the original results and assign a new version number. Begin evaluating that version on fresh observations. Do not combine its improved results with selected parts of the previous version.
The same discipline applies when several strategies run in parallel. Preserve the results for all of them, including abandoned versions. Reporting only the eventual winner conceals the selection process.
For an adaptive strategy, freeze the adaptation procedure instead of pretending the settings will remain constant. State when recalibration occurs, which past observations it can use and how the next evaluation block will be scored. Future outcomes must stay outside that recalibration process.
What Simulation Cannot Establish
A forward paper test still produces hypothetical performance. It does not establish that transactions would have been accepted at the assumed prices, or that someone would make the same decisions with money at risk. The CFTC warning on hypothetical trading system results describes how simulated performance can misrepresent actual trading conditions and a trader’s ability to absorb losses.
Use sensitivity checks to expose dependence on assumptions. Recalculate results with a lower payout, apply a predetermined extra entry delay, or mark trades unresolved when settlement evidence is missing. Keep these checks separate from the original record.
Do not choose whichever delay makes each historical trade win. That is optimisation wearing a laboratory coat.
Read the distinction between demo and live binary options trading before interpreting simulated account growth. A demo record is not evidence of successful withdrawals, counterparty solvency or lawful retail availability. Those questions sit outside strategy performance.
Review the Evidence Before Deciding What Comes Next
At the planned review, assess three things separately: whether the rules were followed, whether the data can be audited, and whether the return supports further investigation.
Report the net simulated result, return per unit staked, maximum decline from a previous simulated balance peak, longest losing run, unresolved trades and rule violations. State whether the reported result uses fixed or varying payouts and whether it includes any assumed costs.
A negative result under the original assumptions is a reason to reject or redesign the strategy. A small positive result with broad uncertainty supports further observation, not a claim of proven profitability. An incomplete or selectively recorded sample needs better collection before stronger interpretation.
The useful outcome of forward testing is a defensible decision about the strategy. Sometimes that means another carefully separated simulation. Sometimes it means stopping. Finding that an idea does not survive fresh data is a valid research result, and considerably cheaper with virtual stakes.
This article was last updated on: October 22, 2026