TradingView can support binary options analysis by helping you study price movements, define chart conditions and record hypothetical signals. Its value is in making a research process repeatable. A convincing chart, however, does not establish that a binary contract would have won, paid out or been available legally.
For Australian readers, the regulatory position comes first: ASIC’s prohibition on issuing and distributing binary options to retail clients remains in force until 1 October 2031. The ASIC announcement extending the binary options ban sets out that restriction. This guide concerns chart study and hypothetical testing, not a route around it.
What TradingView Can and Cannot Do
TradingView provides price charts, drawing tools, technical indicators, alerts, custom scripts and historical replay. These TradingView charting and research features support several parts of an analysis routine: marking a price level, defining a condition, reviewing when it occurred and examining what happened afterwards.
Keep those tasks separate from contract execution. Seeing an asset on a chart does not establish that a binary option on that asset is supported. An alert is not an accepted order, and a chart price is not automatically the price used to settle a contract.
The useful question is therefore not “Can TradingView predict the next candle?” It is “Can this workspace help me test a clearly defined proposition without changing the rules after seeing the result?”
That distinction also helps when comparing binary options trading software. Chart analysis, signal generation, order handling and performance accounting are different jobs. Treating them as interchangeable makes a research record harder to trust.
Match the Chart to the Market Being Studied
Before adding indicators, identify exactly what the chart represents. An asset name alone is not enough. A cash index, a futures contract and a product tracking the same index are not interchangeable price series.
The same principle applies to currencies and cryptocurrencies. Record the complete symbol and data provider rather than writing “AUD/USD” or “Bitcoin” in a notebook and assuming that settles the matter.
| Check | What to record | Why it matters |
|---|---|---|
| Instrument | Full symbol, venue or provider, and contract month where relevant | Prevents comparisons between different instruments |
| Quote basis | Last trade, bid, ask or another stated calculation | A small difference can change a result near the strike |
| Data timing | Whether the selected feed is current, delayed or missing updates | A stale observation cannot represent a current entry |
| Session and clock | Included trading sessions, time zone and timestamp convention | Keeps signals and outcome checks aligned |
Suppose a chart shows a settlement-time price of 0.66004, while a hypothetical contract benchmark shows 0.66002. Against a strike of 0.66003, those observations imply opposite outcomes. Neither a screenshot nor an indicator reading resolves which benchmark the contract requires.
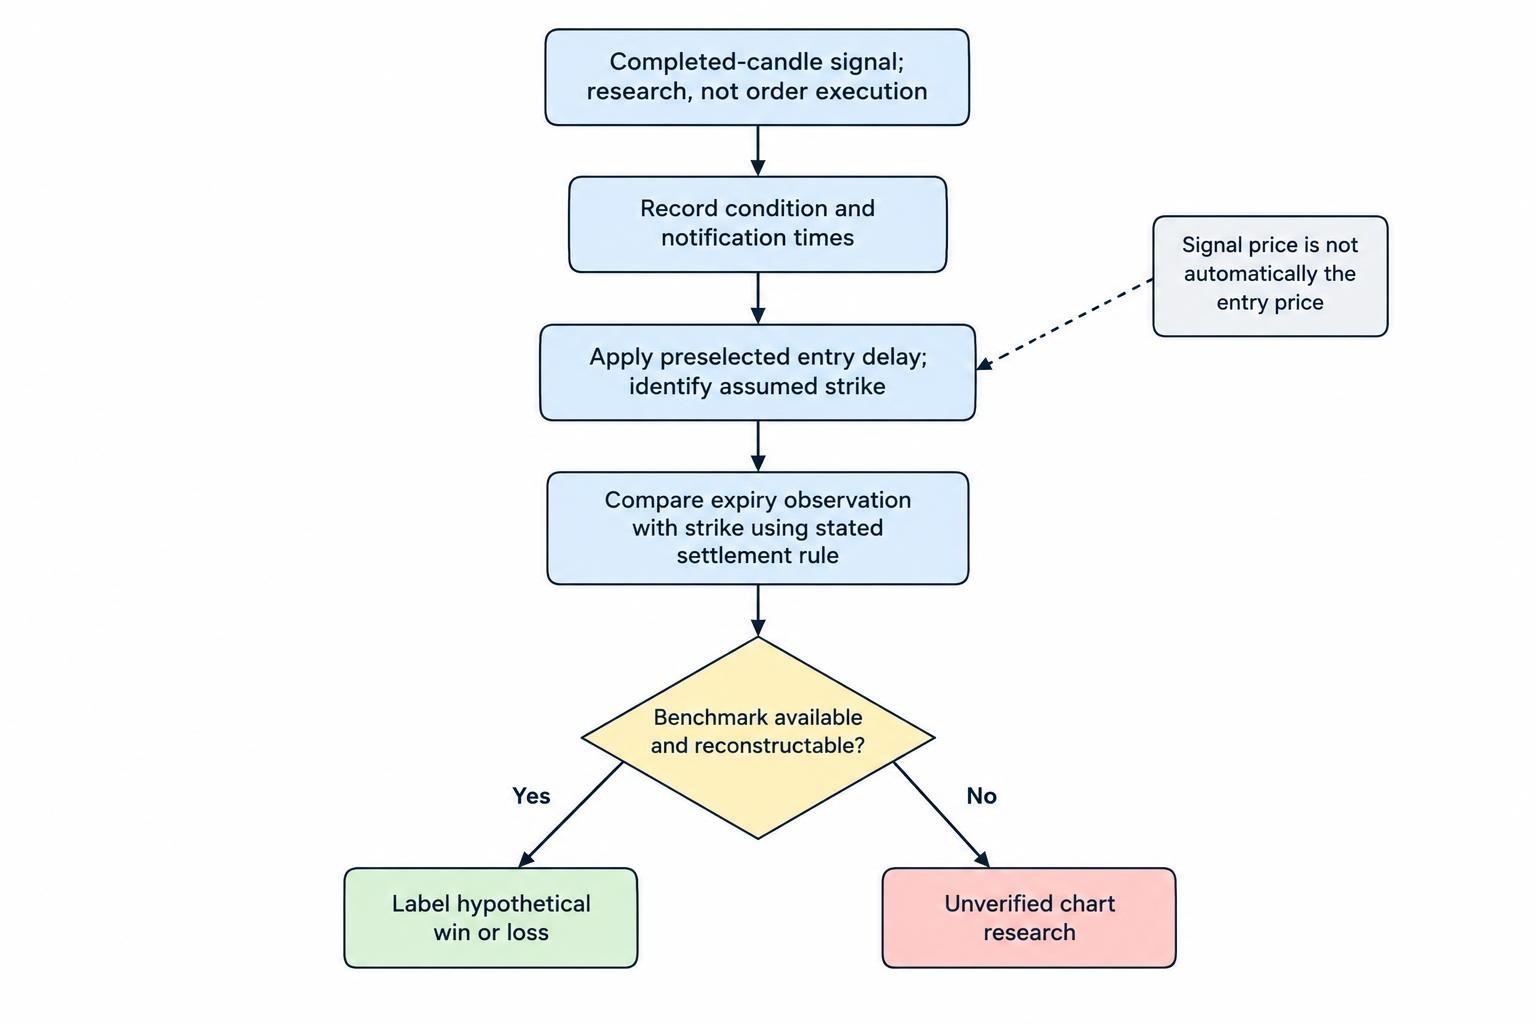
The guide to price feeds and settlement benchmarks covers that distinction in more detail. For a TradingView study, establish the price source before counting wins. If the required benchmark cannot be reconstructed, label the result as chart research rather than verified contract performance.
Build a Layout Around One Research Question
Start with ordinary candles, a clear time display and only the tools needed by the rule being tested. Keep the main chart readable enough that another person could identify the proposed signal without an explanation over your shoulder.
A reasonable research layout might use a broader interval to classify market conditions and a shorter interval to observe the trigger. For example, a fifteen minute chart could provide context while a one minute chart supplies the observation used in the test. These are study choices, not recommended trading settings.
Do not confuse the chart interval with the outcome horizon. A one minute candle summarises one minute of prices. It does not establish that a one minute contract is appropriate, or that a signal should be assessed at the next candle close.
Write down whether the hypothetical contract expires at a fixed clock time or after a duration measured from acceptance. The difference between those arrangements is covered in the guide to binary options expiry times.
Every indicator should answer a stated question. A moving average might classify direction; an oscillator might describe recent momentum. If three tools repeat roughly the same information, do not count them as three independent confirmations. More indicators can turn one decision into a committee meeting.
Use Alerts as Observations, Not Instructions
An alert should identify a condition worth recording. It should not replace the remaining checks in the study.
Define the trigger precisely: which symbol, which interval, which threshold and whether the condition must hold at candle close. “Price looks strong” cannot be tested consistently. “The completed candle closes above the level marked before the session” is at least a rule that can be examined.
Separate an Open-Candle Signal From a Confirmed Signal
An indicator can cross a threshold during an open candle and move back before that candle closes. Historical and live displays can therefore differ. Scripts can also create misleading histories by placing markers into earlier bars or using information that was not available at the apparent signal time. These behaviours are addressed in TradingView’s documentation on repainting.
For a study based on completed candles, require confirmation in both the signal rule and the alert configuration. This addresses some repainting problems, not every possible cause. A script using data from a longer interval also needs scrutiny: closing a short candle does not necessarily confirm the longer candle.
Before relying on a community script, ask when its marker first becomes visible, whether that marker can move, and whether the historical display reproduces what was observable live. A polished chart is not an audit trail.
Measure the Gap After the Alert
Record the condition time, notification receipt time and assumed entry time separately. Do not assume they are identical.
For hypothetical testing, choose a consistent delay rule before evaluating outcomes. Then examine how results change when that delay increases. A method that works only when entry occurs at an already vanished price needs a different description than a usable signal.
A Worked Example: Correct Direction, Losing Contract
Consider a hypothetical AUD/USD study using one minute candles. All times below use the same clock, and all prices come from the same assumed price stream so that the example isolates entry timing.
A completed candle produces an upward signal at 10:00:00, when the reference price is 0.66002. The study assumes that an entry is accepted three seconds later, at a strike of 0.66005. The fixed expiry is 10:05:00, and the settlement price is 0.66004.
The price finished above the signal-time observation but below the assumed strike. Under a contract requiring settlement strictly above the strike, the hypothetical result is a loss.
Two details matter. The signal price was not the entry price, and the observation period from acceptance to expiry was four minutes and 57 seconds, not five minutes.
A backtest that compares the expiry price with 0.66002 would count a win that the stated entry assumptions do not support. This is why marking every upward arrow followed by a higher price is inadequate.
Record the strike, acceptance time and settlement rule alongside the chart signal. Where settlement equals the strike, apply the stated tie treatment rather than inventing one after the event.
Use Bar Replay Without Rewriting the Past
Bar Replay allows historical prices to be revealed progressively. Use it to make a decision before viewing later candles, rather than selecting a chart where the eventual outcome is already obvious.
Choose a starting date, hide subsequent price action and apply the same written rule to each eligible observation. Record rejected setups as well as accepted ones. Otherwise, a discretionary filter can become a convenient way to remove losses.
Keep a separate record of assumed binary outcomes. Do not treat an ordinary buy-and-sell simulation as equivalent to a fixed payout contract. The latter needs an entry benchmark, an expiry benchmark, a payout assumption and a loss rule.
Historical candles may also lack the detail needed by a test. If the question depends on the price three seconds after a signal, a one minute candle’s open, high, low and close cannot identify that price. Mark the observation as unresolved unless suitable finer data is available.
Separate rule development from evaluation. Use one period to define the method, then examine another period without changing it. The broader binary options backtesting guide covers test design; TradingView should serve that process rather than dictate it.
Calculate Binary Returns, Not Just Signal Accuracy
A directional hit rate does not establish profitability. The payout on a winning observation must be weighed against the amount lost on a losing one.
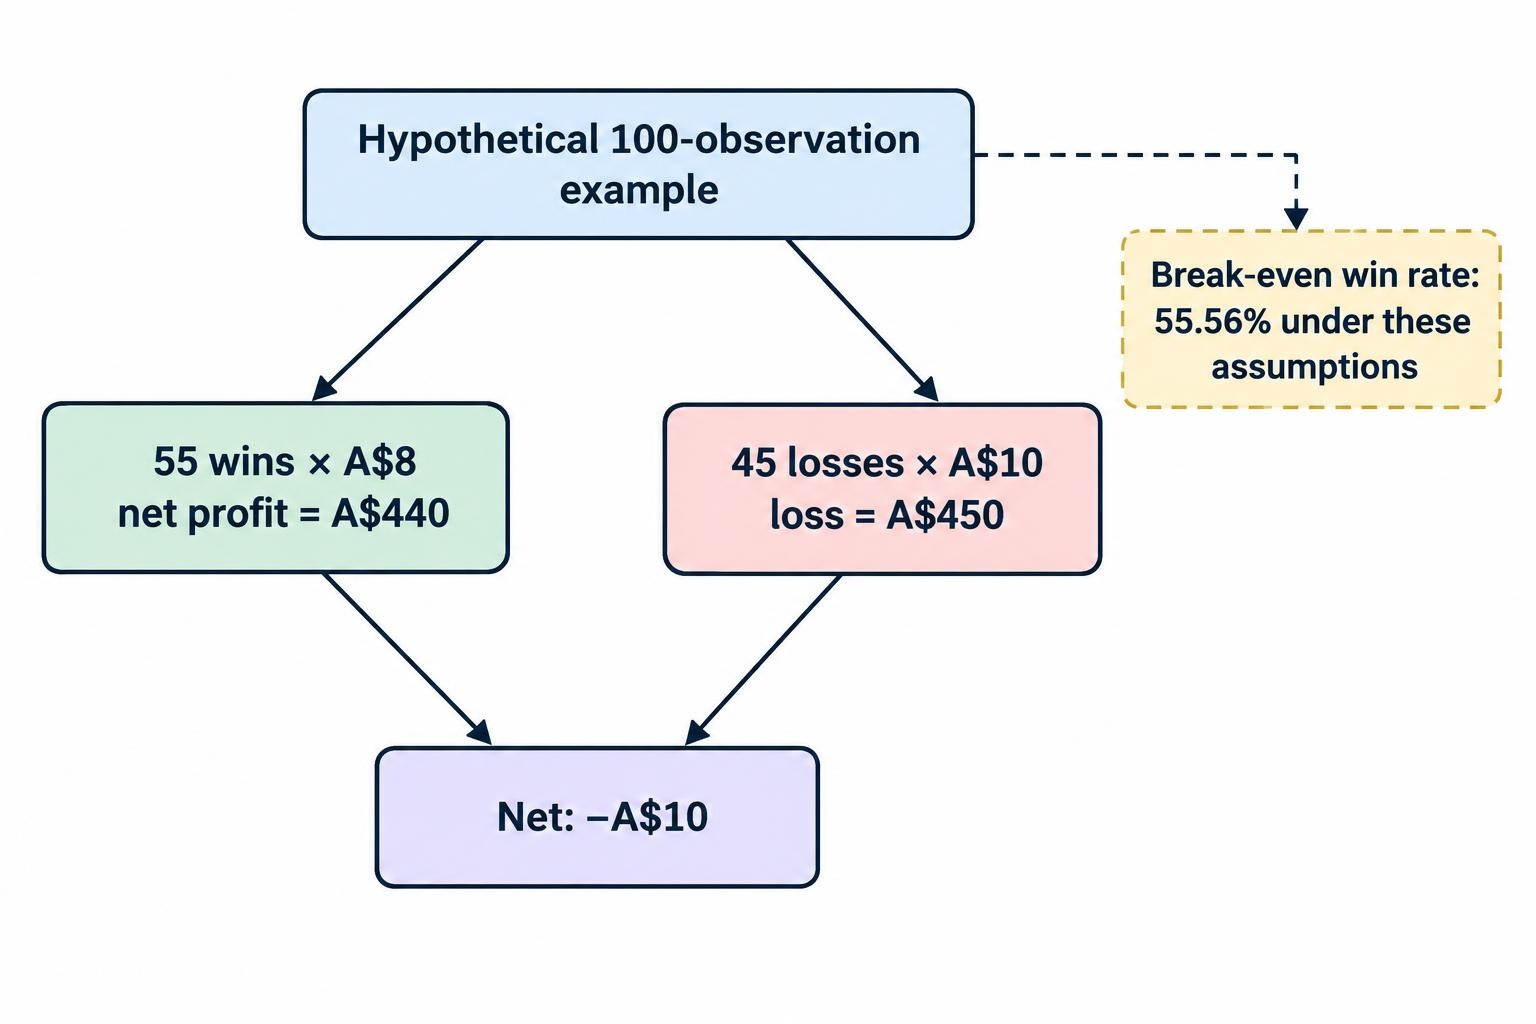
Assume a hypothetical A$10 stake returns A$8 net profit on a win and loses A$10 on a loss. With no ties, refunds or other costs, the break-even win rate is:
A$10 ÷ (A$10 + A$8) = 55.56%.
Across 100 observations, 55 wins and 45 losses would produce A$440 in winning profits against A$450 in losses: a net loss of A$10. Calling 55% “more right than wrong” would be accurate but financially unhelpful.
Use the probability and expected value framework to distinguish accuracy from return. Record the assumed payout for each observation, especially if the study allows it to vary.
Keep evidence labels honest too. If historical payouts are unavailable, describe the result as a return calculated under an assumed payout. It is not a reconstructed account history. A positive result under one assumption should also be tested against less favourable assumptions before drawing anything from it.
Decide Whether a Paid Setup Solves a Real Problem
Before paying for charting software or a script, identify the task that your current setup cannot complete. Check the current allowance for charts, alerts, intervals and historical access against that task. Review data charges separately rather than assuming a subscription answers every data requirement.
A useful purchase decision sounds like this: “The study requires enough historical observations at this interval, and the current arrangement cannot provide them.” It does not sound like “The expensive version should produce better signals.”
Apply the same standard to paid indicators. Request clear rules, an explanation of signal timing and results that include losses. A claimed win rate without the sample, entry assumptions and payout basis is not enough to evaluate the product.
Keep a Record That Can Be Checked
For each hypothetical observation, save the full symbol, interval, signal rule version, timestamp, assumed entry delay, strike, expiry and outcome price. Add the payout assumption and any reason the result could not be verified.
A structured trading journal makes those fields easier to review. Screenshots are useful supporting material, but they should accompany the record rather than substitute for it.
The standard is simple: another reader should be able to reproduce the calculation without guessing what happened between the arrow and the expiry. TradingView is useful when it helps meet that standard. It cannot repair an undefined rule, a mismatched benchmark or an outcome counted at a price that was never available.
This article was last updated on: October 22, 2026