A trading signal track record should let you reconstruct what was recommended, when it was available, whether it could have been followed, and what the outcome was after costs. A headline win rate does none of that on its own. Neither does a screenshot of a profitable account.
When evaluating binary options signals, separate three questions: is the record authentic, does it show a profitable method, and could a subscriber have reproduced the results? A service can pass one test and fail another. Genuine transactions may still lose money after subscription fees. Profitable historical signals may depend on entry prices that subscribers could not obtain.
This guide focuses on checking performance evidence rather than choosing a provider. The broader binary options signals guide covers how these services work.
Australian regulatory context: ASIC’s prohibition on issuing and distributing binary options to retail clients took effect on 3 May 2021 and has been extended until 1 October 2031. Evaluating a signal record does not make the underlying product permissible to offer. The ASIC announcement extending the binary options ban sets out the restriction. The examples below are educational calculations, not recommendations to open or fund an account.
Start with the complete signal history
Ask for a continuous record covering a stated start date and end date. It should include every signal issued through the service being evaluated, not a selection of winning days or the results of its best analyst.
The denominator matters. “Eighty winners” means little without the number of losses, cancelled calls, unresolved outcomes and follow-up trades. A provider should also explain whether its totals cover the public channel, a paid group, an automated strategy or several products combined.
A usable record needs enough information to recreate each decision without guessing.
| Record field | What it should establish |
|---|---|
| Signal identity and publication time | A unique reference, original timestamp, time zone and any later edits. |
| Market and contract | The exact instrument, direction, contract type and relevant platform or price feed. |
| Entry and expiry | The entry rule, strike or accepted entry price, permitted entry window and expiry time. |
| Stake and payout | The amount at risk and the profit offered on a winning contract, recorded at entry. |
| Settlement | The settlement value, result, treatment of ties and amount returned. |
| Exceptions and follow-ups | Cancelled, missed, rejected or amended signals, plus every recovery trade. |
Keep different markets distinguishable. An instrument labelled “EUR/USD OTC” should not silently become ordinary EUR/USD in the summary. Record the provider’s instrument name exactly so the result can be checked against the terms and prices actually used.
Unknown outcomes belong in a separate category. Do not assume they were wins, and do not let them disappear from the record. If unresolved entries could change the assessment from profitable to unprofitable, the evidence is not ready for a firm verdict.
Check what the evidence actually verifies
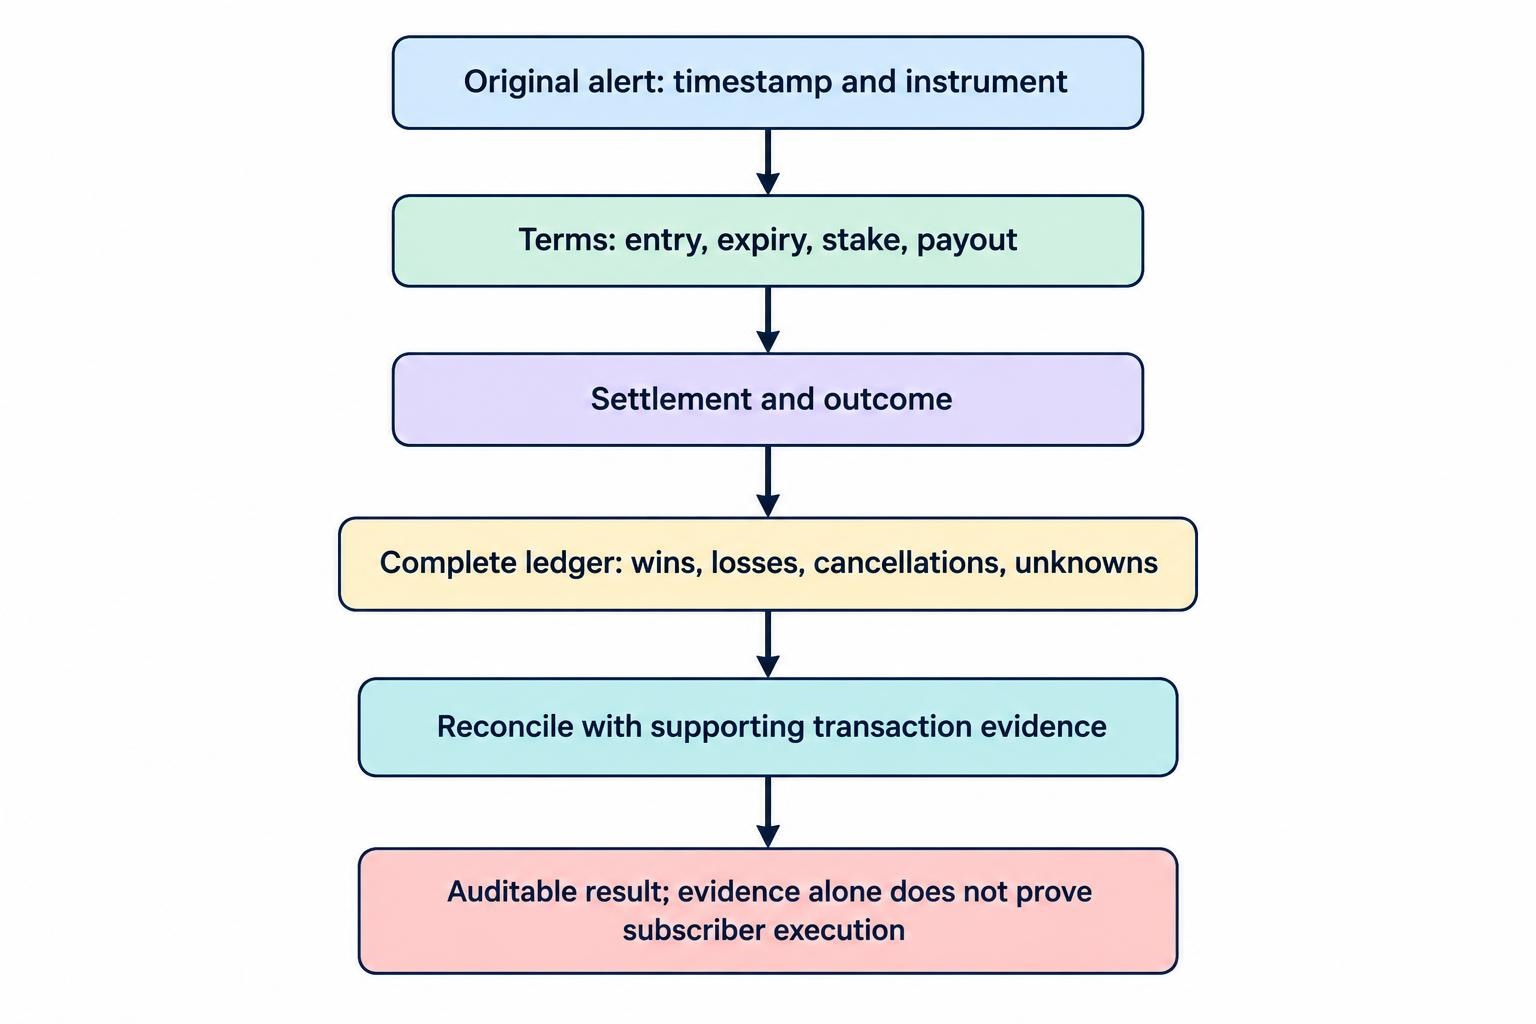
Evidence should connect the original alert to its claimed result. A message published before expiry supports the existence of a forecast. An account statement supports a transaction. Neither automatically proves that the transaction followed the alert at the advertised price.
Match a sample of original alerts against transaction records using timestamps, instrument names, direction, stake, expiry and settlement. Then check the totals against the complete ledger. Redacting names and account numbers need not prevent this reconciliation, provided the relevant transaction details remain visible.
Inspect the scope of any third-party verification. Does it confirm account ownership, transaction history, live account status, or simply data supplied by the promoter? What dates does it cover? Does the verifier have a commercial relationship with the service? A verification badge should answer questions, not replace them.
Keep live, demo and simulated results separate
Ask whether each record represents actual transactions, demo transactions, historical simulation or alerts scored without placing trades. These are different forms of evidence and should not be merged into one performance figure. The CFTC advisory on internet trading systems warns about hypothetical results presented as actual performance, selective historical trades and costs omitted from profit claims.
A record of alerts published in real time is useful, but it is not automatically a live trading record. The provider may have scored every alert using a chart while placing no transactions at all.
For account-based evidence, identify whether the account was live or demo and what that status establishes. The distinction between demo and live binary options trading matters because a simulated result cannot, by itself, demonstrate the outcome of funded transactions.
Convert the win rate into money
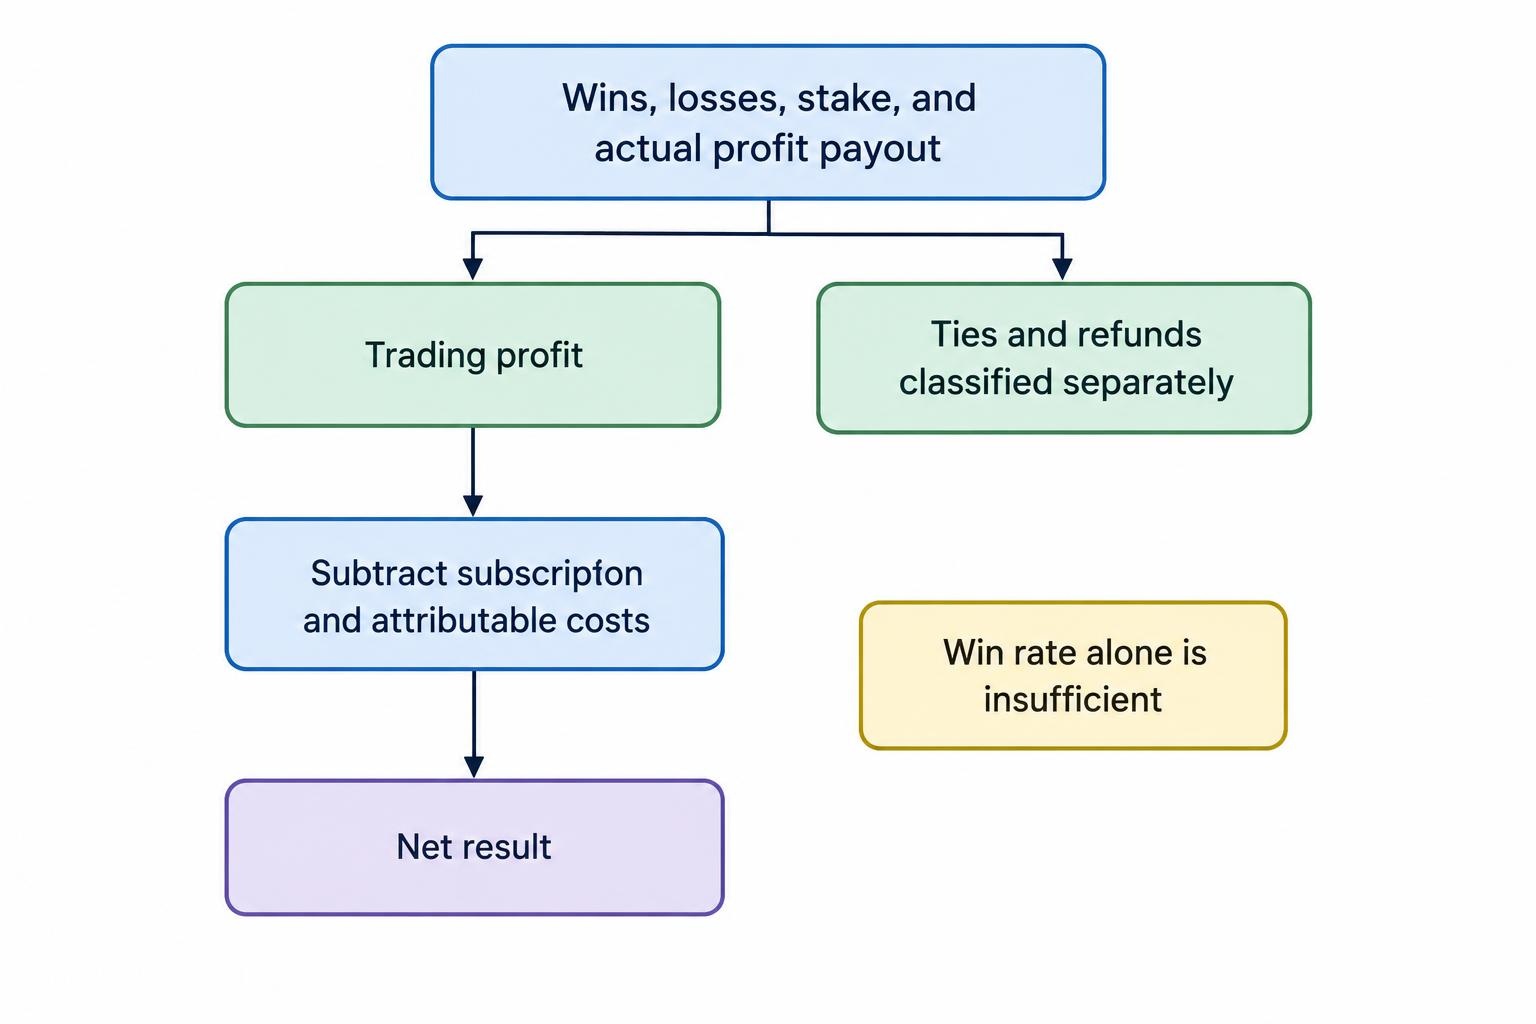
Win rate measures the proportion of counted trades that won. It does not measure profitability unless the payout, losing stake, fees and result classifications are also known.
Consider a hypothetical fixed-stake contract offering an 80% profit on a win. A winning A$10 stake produces A$8 profit, with the original A$10 also returned. A loss costs A$10. Here, “80% payout” means profit equal to 80% of the stake, not a total return of A$8.
With a full stake lost on each losing trade and no fees or refunds, the calculation is:
Break-even win rate = 1 ÷ (1 + profit payout expressed as a decimal).
At an 80% profit payout, the break-even win rate is approximately 55.56%. At 70%, it rises to 58.82%. At 90%, it falls to 52.63%. A provider’s accuracy claim needs to be assessed against the payout actually available, not the highest payout displayed somewhere on the platform.
The related guide to probability and expected value develops this relationship. For a track record, the immediate task is to calculate the cash result of every transaction.
Where payouts vary, use each trade’s recorded terms. Do not substitute one advertised percentage across the entire history. A 60% win rate can produce different financial results depending on which trades won, their stakes and the payouts attached to them.
Check ties and refunds separately. A returned stake is not a profitable trade. If ties are excluded from the reported win rate, that exclusion should be stated, with the number of ties disclosed and their actual cash effects retained.
Separate individual trades from recovery sequences
Some records count a chain of trades as one successful signal if a later attempt wins. That can make a recovery strategy look much more accurate than its individual transactions were.
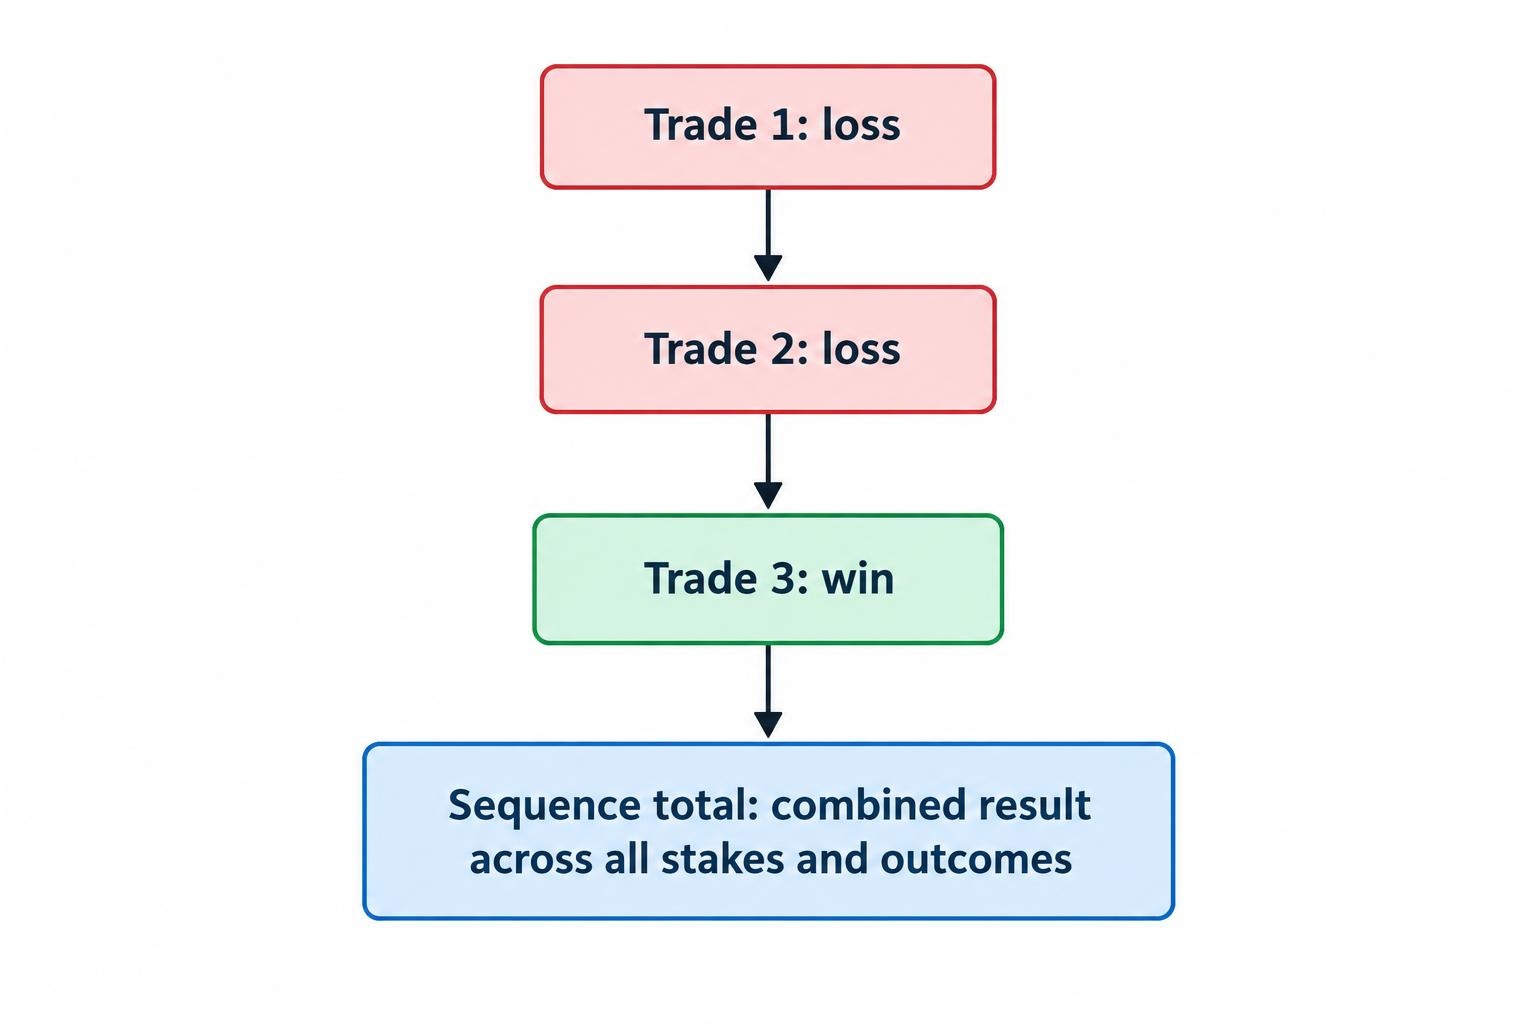
Suppose a provider recommends A$10, then A$20 after a loss, then A$40 after another loss. At an 80% profit payout, a win on the third attempt earns A$32. The earlier trades lost A$30, leaving A$2 profit for the sequence.
Calling that sequence “one win” hides two losing transactions and A$70 of total stakes. It also conceals the increasing amount at risk. The record should show three trades, their individual outcomes and the combined sequence result.
Doubling does not always recover previous losses when a winning contract pays less than the amount staked. After losses of A$10, A$20 and A$40, a winning A$80 trade at an 80% payout earns A$64. That still leaves the sequence down A$6.
Any service using Martingale or similar recovery staking should disclose results both per transaction and per sequence. Request a fixed-stake reconstruction too. This separates the quality of the forecasts from the effects of increasing exposure.
Ask whether losing sequences remain in the published history when the service stops issuing recovery calls. A method cannot claim complete results while counting successful recoveries and leaving abandoned sequences unresolved.
Assess sample size without treating it as a guarantee
There is no universal trade count that proves a signal service works. Statistical uncertainty depends on the observed results and the assumptions behind the calculation. A confidence interval helps show how imprecise a win-rate estimate remains; the NIST guidance on confidence intervals for proportions gives the Wilson method used in the following examples.
For 60 wins from 100 trades, an approximate two-sided 95% Wilson interval is 50.2% to 69.1%. That range includes win rates below the 55.56% break-even level for an 80% profit payout. The observed 60% rate is therefore not strong evidence, on its own, that the underlying win probability exceeds that threshold.
For 600 wins from 1,000 trades, the same calculation gives approximately 56.9% to 63.0%. The estimate is narrower, but its interpretation still assumes independent outcomes and a stable underlying win probability.
Those assumptions deserve attention. Several overlapping signals on the same market should not automatically be treated as independent evidence. Nor does a statistical interval account for missing trades, changing payouts, fees or a provider selected after comparing many competing records. It measures one kind of uncertainty, not every weakness in the evidence.
Look for selection bias and changing rules
A record can be accurately calculated yet misleadingly selected. Ask why the reporting period begins where it does. Did the service launch on that date, change its method, restart after losses, or choose a favourable month for its sales page?
Request monthly results across the full available history. Keep earlier strategy versions visible, but distinguish them from the current method. Otherwise, the provider can combine the best periods from several approaches into a record no subscriber actually received.
Historical testing needs another question: how many alternatives were tried before this result was selected? Testing many indicators, expiry settings and market filters creates more opportunities to find a chance success. The research paper The Probability of Backtest Overfitting examines how selecting strong historical performers can lead to disappointing performance outside the selection sample.
For a signal service, request the dates used to develop the method and the dates used to evaluate it afterwards. Ask which rules were fixed before that later evaluation began. If the provider repeatedly changed the method after reviewing the evaluation period, that period is no longer a clean test of the original rules.
The same discipline applies to manual judgement. “We avoid poor market conditions” is not a reproducible filter unless the conditions were identified before the outcome became known. Excluding a losing alert afterwards because the chart looked unsuitable is a change to the scoring rules.
You do not need access to proprietary source code to ask these questions. The provider can keep its method private while still disclosing strategy versions, reporting boundaries and the basis on which trades entered or left the record.
Check whether a subscriber could reproduce the entries
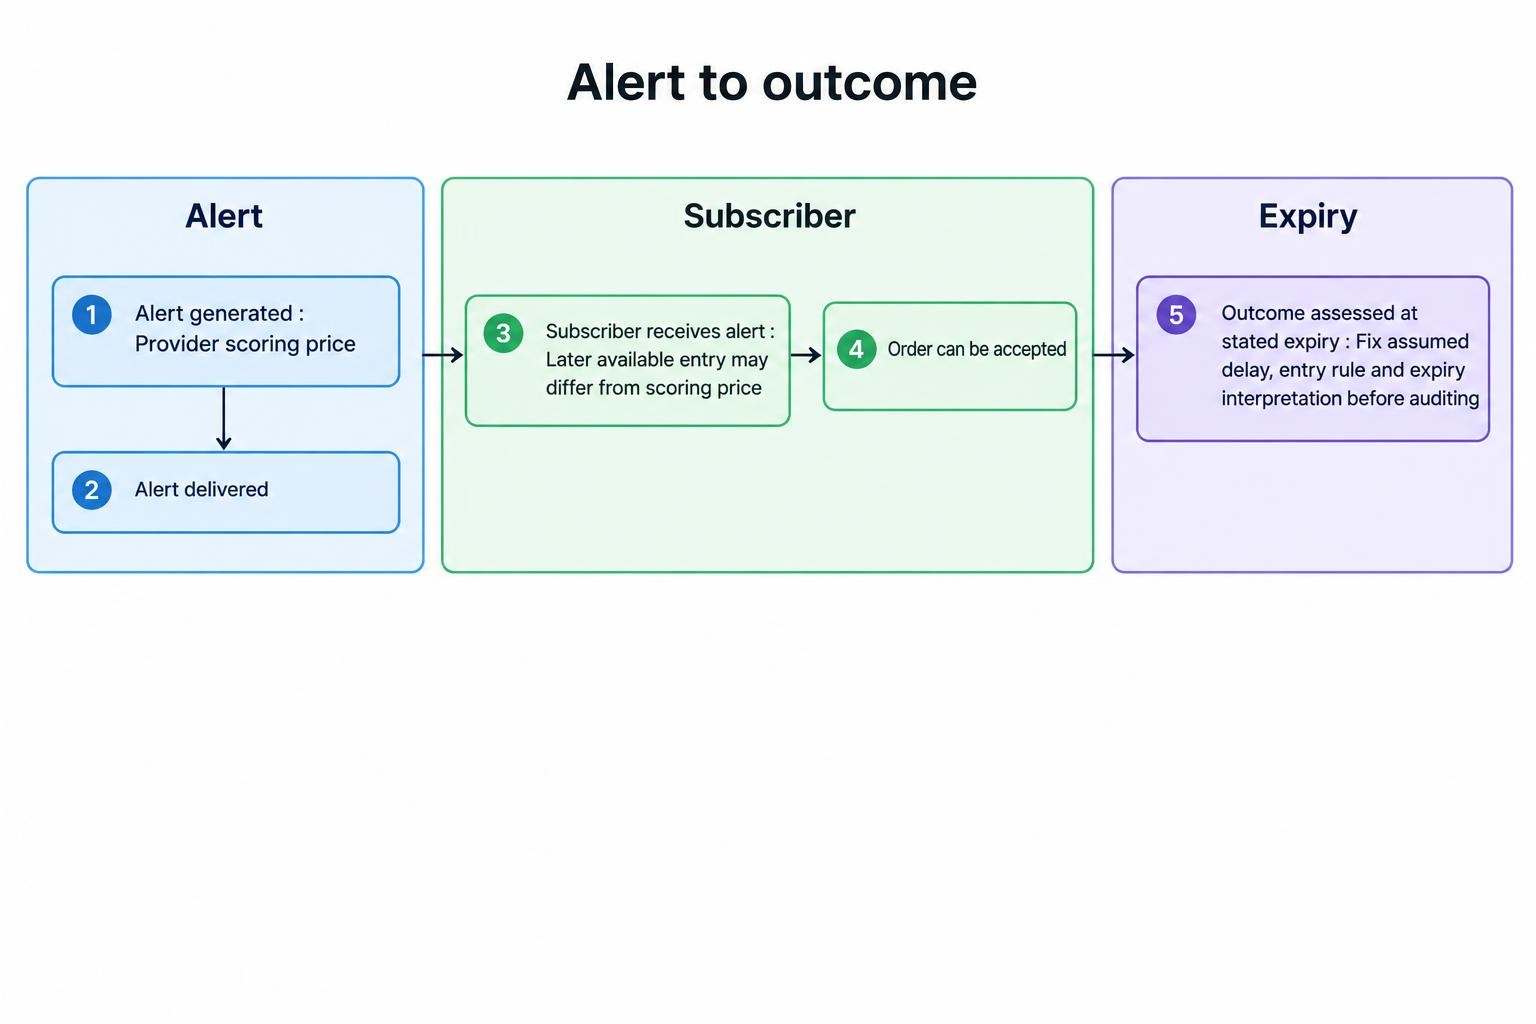
A signal’s publication time and the provider’s entry time are not necessarily the same. The evaluation should distinguish when the alert was generated, when it reached the delivery channel, when a subscriber received it and when an order could have been accepted.
Consider an illustrative alert generated at 10:00:00 and received at 10:00:04. If the provider scores the result using the price at 10:00:00, the subscriber’s available entry may differ. A later entry can change the strike, the time remaining or both.
Record the stated expiry precisely. “One minute” might mean a contract expiring at the next fixed minute or one lasting 60 seconds from acceptance. Those instructions are not interchangeable. Also confirm the time zone and whether the archive handles daylight saving changes consistently.
When reviewing chart-based evidence, distinguish a signal visible during the original decision window from one added or moved later. The guide to signal repainting and latency covers these issues in more detail. A historical chart with neat arrows is not enough to establish when those arrows first appeared.
For an independent paper audit, define the assumed delivery delay and entry rule before recording outcomes. Preserve the original alert and record the price available under that rule. If the required contract or payout was unavailable, classify the signal as unexecutable rather than inventing a fill.
Keep those exceptions visible. A provider might have a profitable forecast record but a weak subscriber record because too many alerts arrive late or require unavailable terms. That is a different problem from inaccurate predictions, but it matters just as much to reproducibility.
Rebuild the result path, not just the final balance
The final profit figure hides the route taken to reach it. Reconstruct the running result in chronological order, then inspect the largest decline from a previous peak, the longest losing sequence and the concentration of losses.
For example, a hypothetical balance falling from A$1,000 to A$700 has suffered a 30% drawdown. Returning from A$700 to A$1,000 requires a gain of approximately 42.86%. The percentage needed to recover is larger because it is measured from the reduced balance.
The trading drawdown guide explains the calculation. For record checking, request both the cash decline under the provider’s actual staking method and a result series using a constant stake.
Keep deposits and withdrawals separate from trading profit. A deposit can lift the displayed balance without recovering any trading loss. Reconcile account movements before accepting an account growth chart as evidence of performance.
Review overlapping exposure as well. Five A$10 positions open at once represent A$50 of simultaneous stakes, not a single A$10 commitment. If those signals depend on the same market movement, the summary should not present them as five unrelated tests.
Finally, check whether a few unusually large stakes produced most of the profit. Reported accuracy may look stable while the financial result depends on one heavily weighted win. Showing both actual-stake results and fixed-stake results makes that dependence easier to see.
Deduct subscription fees and other attributable costs
A signal service should be assessed after the costs required to use it. These may include the subscription, compulsory software, data access and attributable payment or currency conversion charges. Use the charges that apply to the period being reviewed rather than an introductory offer.
Consider this hypothetical monthly record: 100 trades, A$10 staked on each, 60 wins, 40 losses and an 80% profit payout on every winning trade.
The winners earn A$480. The losers cost A$400. Trading profit is A$80 before the service fee. A subscription costing A$100 turns the result into a net loss of A$20, despite the 60% win rate.
Under these assumptions, covering the subscription requires at least 62 wins out of 100. The calculated break-even proportion is approximately 61.11%, but a record cannot contain a fraction of a winning trade. Further costs would raise the requirement again.
This is why signal and software costs belong inside the performance assessment, not in a footnote. A positive result before fees is not evidence of a positive subscriber result.
Be cautious when costs appear manageable only after assuming larger stakes or more trades. That changes the exposure and may change the set of available signals. Do not repair an unprofitable example by inserting trading activity that the record never demonstrated.
Review incentives and access to money separately
Ask how the signal provider earns money. A subscription, referral payment, payment linked to trading activity and performance fee create different commercial relationships. Request a clear disclosure rather than assuming that a free service has no financial incentive.
Then check whether the performance evidence depends on one platform. If the provider requires a particular account, ask whether the advertised payout and contract terms are exclusive to that arrangement. Results from another venue do not automatically establish what subscribers received.
Keep platform reliability separate from signal accuracy. The joint CFTC and SEC alert on binary options fraud documents complaints involving withdrawal refusals, identity theft and alleged software manipulation. A favourable forecasting record does not answer those concerns.
Likewise, a screenshot of a withdrawal verifies little unless its origin, ownership and relationship to the claimed trading period can be checked. Even a genuine payment demonstrates that payment, not the accuracy of every trade in a promotional history.
If the promoter replaces evidence with urgency, guaranteed returns or pressure to deposit through a referral, stop the evaluation. Those issues belong in a separate review of social media signal scams, not in an optimistic adjustment to the performance figures.
Run a prospective paper audit with fixed rules
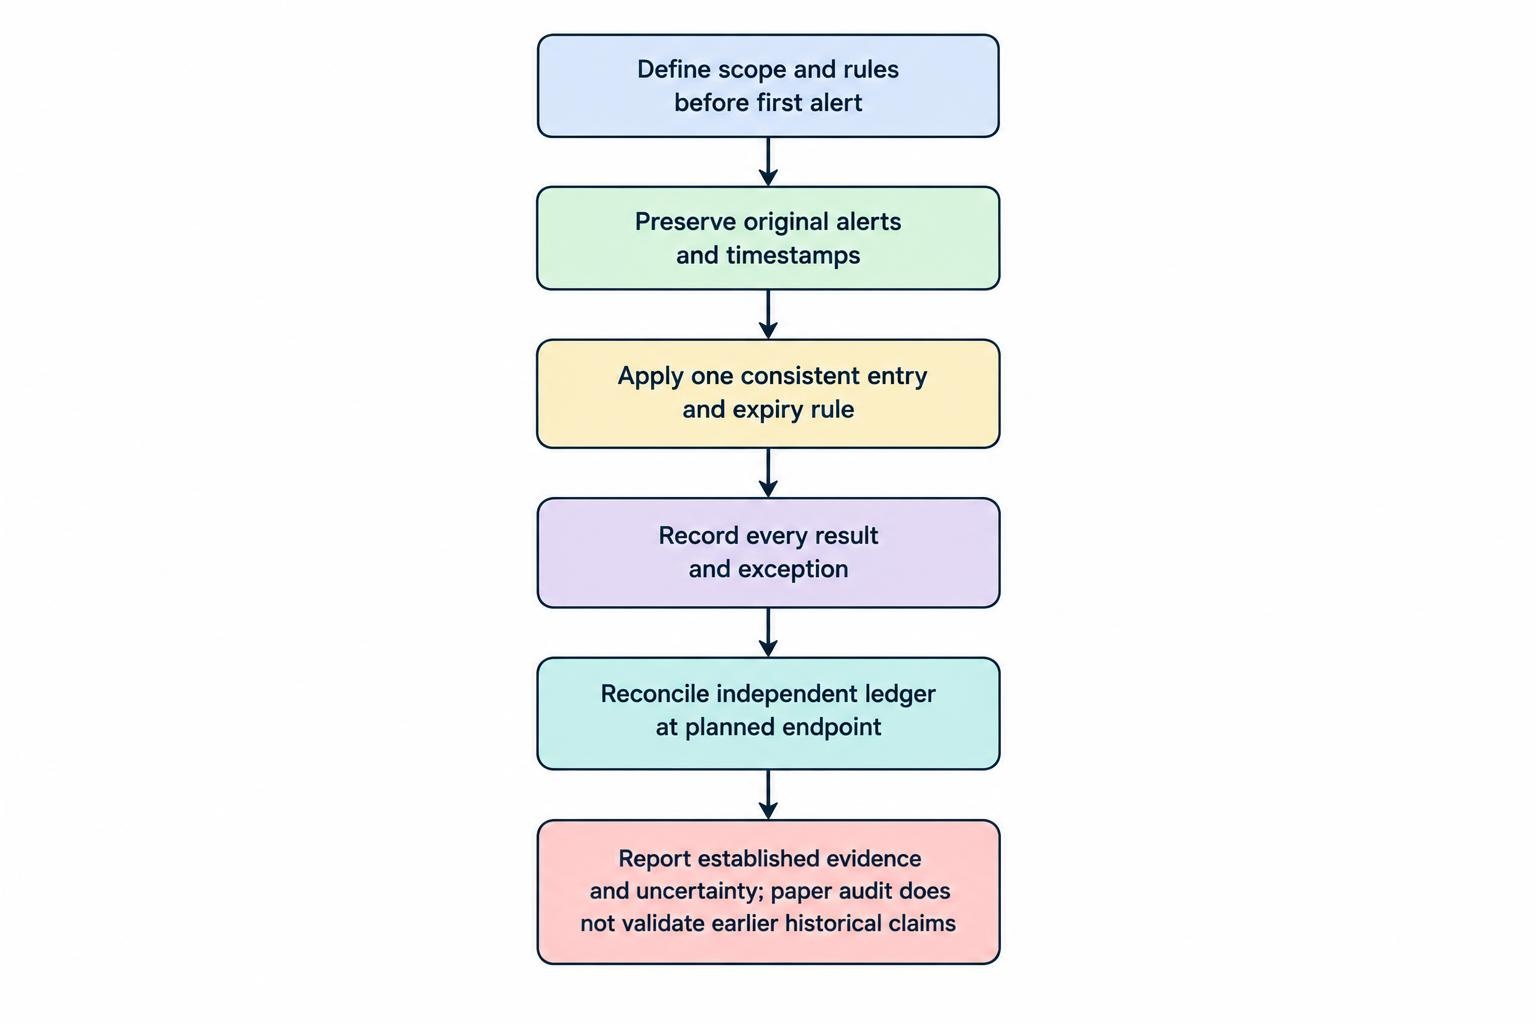
When historical evidence remains incomplete, a prospective paper audit can test whether future alerts are clear, timely and consistently reported. It does not require funding an account, and it does not validate claims about earlier performance.
Set the review rules before the first alert arrives. A practical process is:
- Define the scope. Name the service, channel, strategy version, markets, dates and contract types being assessed.
- Preserve original alerts. Record publication and receipt times, retain message identifiers and note edits without overwriting the original entry.
- Apply one execution rule. Use the same assumed delay, entry window, payout requirement and expiry interpretation throughout.
- Record every outcome. Include losses, ties, cancellations, unavailable contracts and unresolved results, with a reason for each classification.
- Reconcile at the planned endpoint. Compare the provider’s summary with the independent ledger, then calculate fixed-stake results, costs and drawdown.
A structured trading journal can hold the evidence and calculations. Keep observations separate from assumptions: “alert received at 10:00:04” is an observation; “entry assumed at the next available quote” is a rule used by the audit.
Do not stop the review early because the first results look attractive. Equally, do not extend it repeatedly until an unprofitable period becomes profitable. If the method changes, mark the change and begin a separate series rather than silently rewriting the test.
At the endpoint, distinguish what has been established. The alerts may be complete but unprofitable, profitable on paper but difficult to execute, or too sparse for a useful assessment. Each is a valid finding. None needs to be forced into a recommendation.
When the record does not support the claim
Reject a performance claim when the underlying transactions cannot be reconciled, losing trades disappear, recovery sequences replace individual outcomes, or the payout assumptions differ from the terms subscribers received. Treat inaccessible evidence as unverified, not as evidence that deserves the benefit of the doubt.
A defensible assessment is narrower than “this service works”. It states what was checked: a complete period, a defined method, recorded contract terms, transparent exclusions and results after stated costs. Any remaining uncertainty should remain visible.
The strongest track record makes itself possible to challenge. If a provider offers only a percentage and a deposit link, there is not enough evidence to evaluate.
This article was last updated on: October 22, 2026