Support and resistance mark price areas where a market has previously stalled, reversed or struggled to continue. They help organise a chart around a practical question: what happens when price returns to an area that mattered before?
For binary options, that question needs a deadline. A market can bounce from support and still settle below the contract’s strike price. Reading the level correctly does not automatically mean predicting the settlement correctly.
Australian retail context: ASIC’s prohibition on issuing and distributing binary options to retail clients remains in place until 1 October 2031. The ASIC announcement extending the binary options ban sets out the restriction. The examples below are hypothetical chart analysis and paper trading exercises, not instructions to access offshore products.
What Support and Resistance Show
Support is an area where a decline has previously slowed or reversed. Resistance is an area where an advance has previously stalled or turned lower. Support usually sits below the current price; resistance usually sits above it.
These labels describe observed behaviour, not a promise about the next visit. A support zone records where buying previously absorbed selling. It does not reveal how much buying interest remains, whether those participants are still active, or what new information might change their decisions.
Think in areas rather than exact prices. If several declines ended between 0.6500 and 0.6504, marking that band can be more useful than insisting that 0.6502 is the only valid level. CME Group’s support and resistance lesson covers previous highs and lows, potential role reversals and the use of zones rather than penny-perfect boundaries.
A zone also needs a timeframe. An hourly support area describes a different stretch of market activity from a small turning point on a one-minute chart. Neither automatically overrides the other. Their relevance depends on the hypothesis being tested and the time available before settlement.
How to Draw Support and Resistance Zones
Start with price structure, not a screen full of indicators. The aim is to identify a small number of areas that could affect the next decision. A chart covered in lines will always have one near the eventual turning point. That is convenient for hindsight, less useful for analysis.
Support and resistance belong within a broader technical analysis framework. They identify location. Trend, price behaviour and volatility provide context. None of these supplies a reliable probability simply because the chart looks convincing.
Start With Visible Swing Highs and Lows
A swing low is a local trough with higher prices on either side. A swing high is a local peak with lower prices on either side. Begin with turns that are obvious at a normal chart scale, rather than enlarging every minor fluctuation until it looks important.
Group nearby turning points into candidate zones. Separate visits are more informative for this exercise than several neighbouring candles hovering at the same price. Five candles within one pause are not necessarily five independent tests.
Only use information available at the time. A swing low cannot be confirmed before the subsequent prices needed to identify it have occurred. Marking it earlier in a historical test introduces knowledge that a live observer would not have had.
Choose a Consistent Boundary Rule
Candle wicks show the highest and lowest prices recorded during the candle. Candle bodies show the opening and closing prices. Both can help describe a zone, but switching between them whenever it improves an example makes the method impossible to evaluate.
One possible rule is to include a cluster of turning points and their nearby wick extremes. Another is to mark a narrower band around repeated closes, while recording excursions outside it separately. These are alternative definitions to test, not universally correct settings.
Choose the rule before reviewing outcomes. If a zone needs constant widening to remain “valid”, the rule is moving with the result.
Keep the Timeframe Hierarchy Simple
For a practice exercise, use one chart for context and one for observation. An hourly chart might establish the surrounding range, while a five-minute chart records the next approach to its boundary. This is an example workflow, not an expiry recommendation.
Previous session highs and lows can serve as consistent reference points. Define the session first, including its timezone. A session boundary that changes between observations produces levels that cannot be compared fairly.
Round numbers can also be candidates, but their appearance alone does not establish support or resistance. Record whether price actually reacted there rather than awarding importance to every price ending in zeros.
Why Price May React—and Why a Level Can Fail
One explanation for reactions around familiar prices is the placement of orders. Carol Osler’s New York Fed research on currency orders and exchange rates examined stop loss and take profit orders at a large foreign exchange dealing bank. It found clustering around round numbers and different placement patterns that helped explain both reversals and continuation after levels were crossed.
That finding does not turn an ordinary chart into a map of current orders. A visible low shows what happened previously. Without suitable order data, it does not establish how much demand is waiting there now.
Repeated touches also deserve caution. They demonstrate that an area has attracted reactions, but they do not prove that each new visit makes it stronger. Two interpretations can fit the same chart: participants continue defending the area, or repeated selling is gradually using up available buying interest.
Keep those as competing hypotheses. Record the depth of each approach, the size of each departure and whether price spends more time inside the zone. Avoid translating “three touches” into an invented success percentage.
A useful level must also be allowed to fail. Decide beforehand what would invalidate the original description. That might be a completed candle beyond the far boundary, or a longer period of trading outside it. The exact rule needs testing; the discipline is not changing it after an inconvenient result.
Distinguish a Bounce, Breakout and Retest
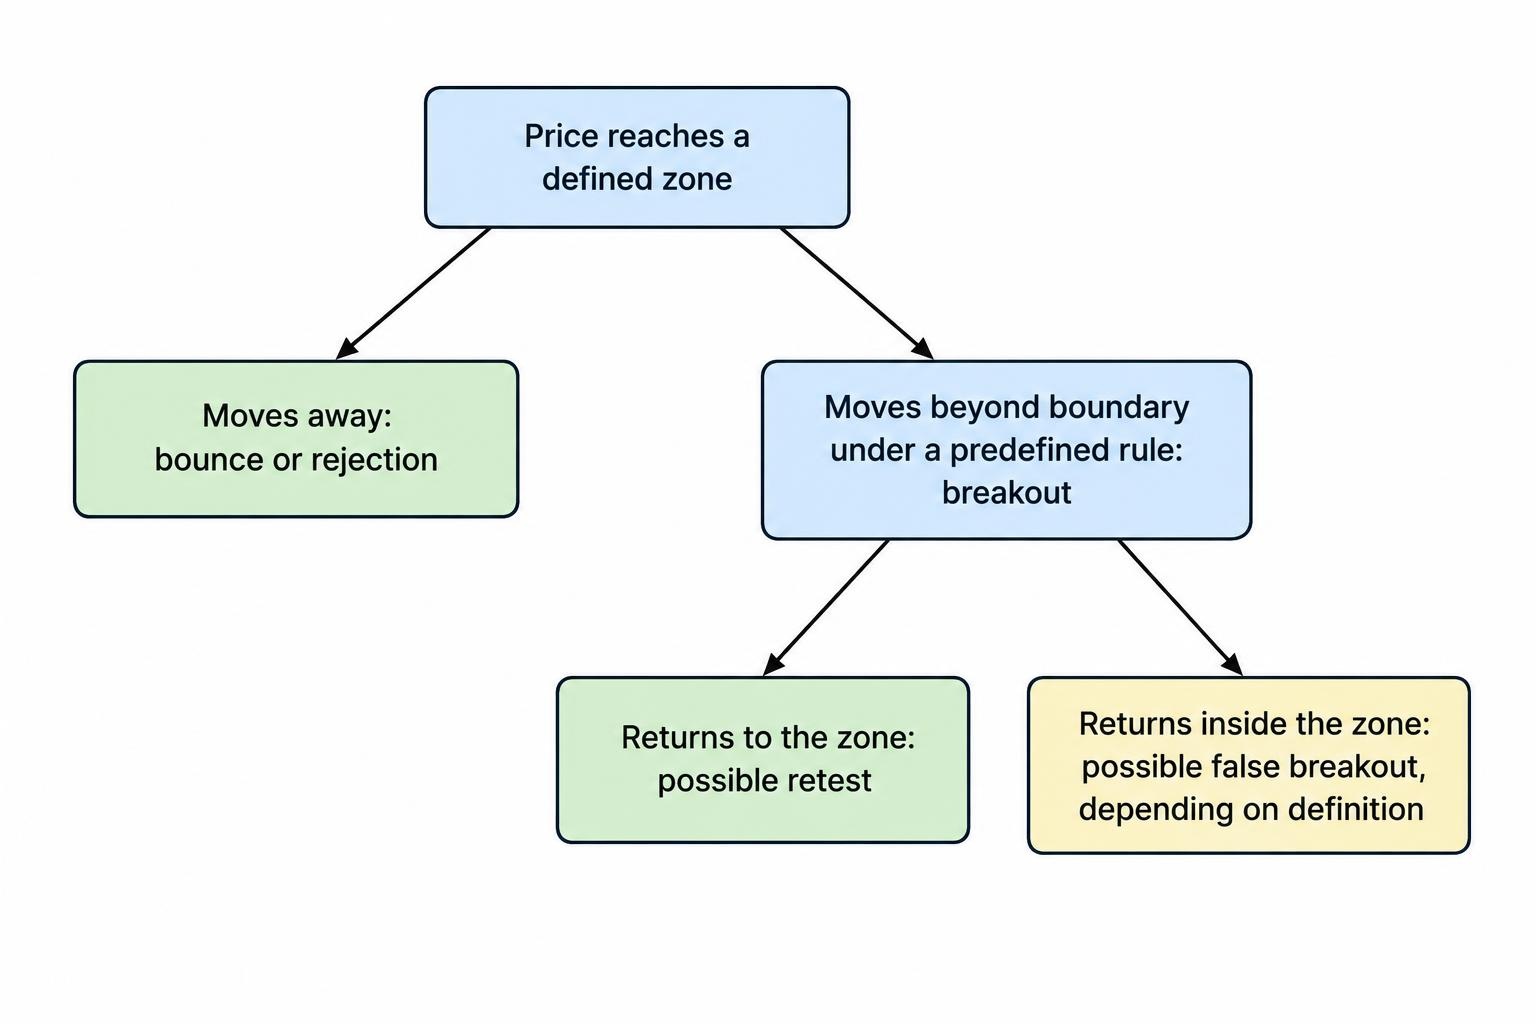
The same zone can produce several patterns. Naming the observed behaviour helps separate what the chart has done from what the analyst hopes it will do next.
| Behaviour | What appears on the chart | What remains uncertain |
|---|---|---|
| Bounce or rejection | Price reaches a zone, then moves back away from it. | Whether the move lasts until the chosen observation time. |
| Breakout | Price moves beyond the zone under a predefined rule. | Whether it continues or returns inside. |
| Retest | Price returns to a previously crossed zone. | Whether the zone changes role or the earlier break fails. |
| False breakout | Price crosses the boundary, then returns inside under a predefined rule. | Whether that return develops into a sustained reversal. |
A brief move below support is not automatically a confirmed breakdown. Equally, a candle closing above resistance does not guarantee continuation. The threshold used to classify the event belongs in the test rules.
The broader entry methods belong in breakout trading strategies. Here, the relevant distinction is simpler: a level that appears to reject price and a level that price has crossed represent different hypotheses. Do not switch between them retrospectively to rescue an unsuccessful forecast.
Former resistance can become candidate support after a break, and former support can become candidate resistance. Treat that role reversal as something to observe, not an automatic consequence of crossing a line. Price may return through the entire area instead.
A Support Level Does Not Choose Your Expiry
A horizontal zone answers “where?” It does not answer “when?” That distinction matters whenever the outcome depends on price at a fixed deadline.
Suppose price reaches hourly support and eventually rises over the next 40 minutes. A forecast assessed after two minutes could still be wrong. The later recovery does not repair the earlier result.
The chart interval and contract duration are separate settings. A five-minute candle does not imply that five minutes is an appropriate expiry. A rule such as “use three candles” is incomplete unless it defines the candle interval, starting point and exact settlement time.
The guide to binary options expiry times addresses those mechanics. For a support and resistance exercise, select the observation horizon before revealing subsequent prices. Otherwise it becomes tempting to choose whichever deadline makes the reaction look successful.
Waiting for confirmation creates another trade-off. A completed rejection candle provides more information about the reaction, but the reference price may now be farther from support. More confirmation does not necessarily mean a better position relative to the strike.
Worked Example: A Correct Bounce, a Losing Contract
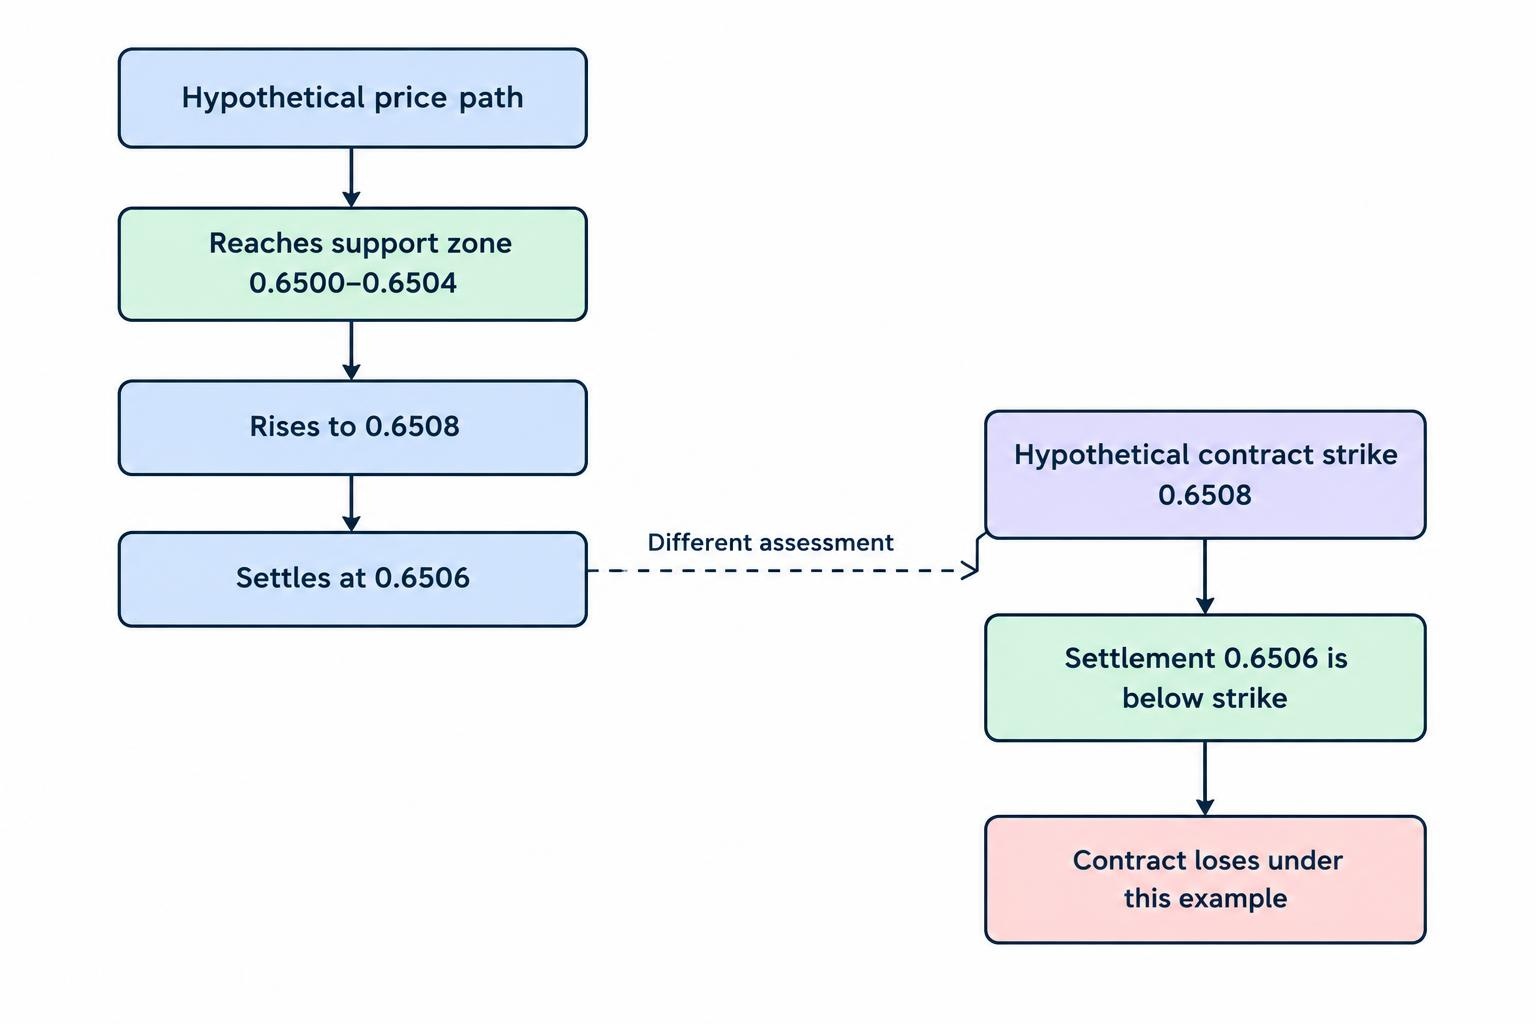
Consider a hypothetical AUD/USD chart with support between 0.6500 and 0.6504. Price reaches 0.6502, then rises to 0.6508. A paper trading rule records a hypothetical higher contract at 0.6508, with a strike equal to that reference price and settlement five minutes later.
At settlement, the stipulated reference price is 0.6506. Support has held under the chart rule, and price remains above the earlier low. Nevertheless, the hypothetical contract loses because 0.6506 is below its 0.6508 strike.
This reflects the distinction between market direction and contract outcome. A binary option’s payment depends on its stated yes-or-no condition, rather than ownership of the underlying asset; the SEC’s binary options investor bulletin describes that payoff structure.
If the hypothetical reference price had instead been 0.6503, the same settlement could produce a different result under otherwise identical terms. That does not make earlier observation inherently better. It shows why a test must record the actual strike rather than judging success from the zone alone.
“The market bounced” and “the contract finished profitably” are different measurements. Keep both in the journal. Combining them makes a chart pattern look more useful than the settlement record supports.
Use the Right Price Series
A support zone belongs to the price series used to draw it. Before comparing analysis with a hypothetical contract result, establish whether the chart and settlement reference describe the same instrument and price convention.
Do not assume that a cash index chart, a related futures chart and a platform-labelled index are interchangeable. The practical check is to identify what each series represents, rather than treating a familiar market name as sufficient evidence.
Record the instrument, data provider, timezone and whether the chart uses bid, ask, midpoint or another price. The price feeds and benchmarks guide covers those distinctions.
Near a strike, an apparently small discrepancy can change the recorded result. If settlement data are unavailable, describe the exercise as a test of chart behaviour—not a verified simulation of a contract’s performance.
Equality at the strike also needs an explicit assumption. A chart candle that appears to finish on the line is not enough to determine the result without the applicable precision and tie rule.
A Convincing Level Must Still Beat the Payout Arithmetic
Even accurate forecasts can lose money when successful outcomes pay less than unsuccessful outcomes cost. Support and resistance do not remove that imbalance.
Assume a hypothetical fixed stake contract risks A$100, returns the stake plus A$80 profit on a win, and loses the entire stake otherwise. Ignore fees and assume no ties or refunds. Its break-even win rate is:
A$100 ÷ (A$100 + A$80) = 55.56%, approximately.
Across 100 such outcomes, 55 wins produce A$4,400 in profit, while 45 losses cost A$4,500. The net result is a A$100 loss before other costs.
This is why the probability and expected value calculation matters more than how persuasive a marked level appears. The relevant question is whether a repeatable rule produces enough favourable settlements at the assumed payout—not whether several screenshots show impressive reversals.
What Research Supports—and What It Does Not
Support and resistance have been studied empirically. A July 2000 New York Fed study of intraday exchange rates tested levels supplied by six firms using data from January 1996 to March 1998. Published levels predicted trend interruptions more often than arbitrarily selected levels, although performance varied across firms and currencies.
That is evidence about historical foreign exchange behaviour under the study’s definitions. It is not evidence that any hand-drawn zone works, that the same findings apply unchanged to current markets, or that a binary options strategy earns positive returns.
A trend interruption is also not identical to a winning settlement. A pause might satisfy a research definition without moving far enough, or lasting long enough, to meet a contract’s condition. The outcome being measured must match the claim being made.
How to Test Levels Without Hindsight
Historical charts make uncertain decisions look tidy because the ending is already visible. A useful practice method must stop future information from influencing level placement, event classification or observation timing.
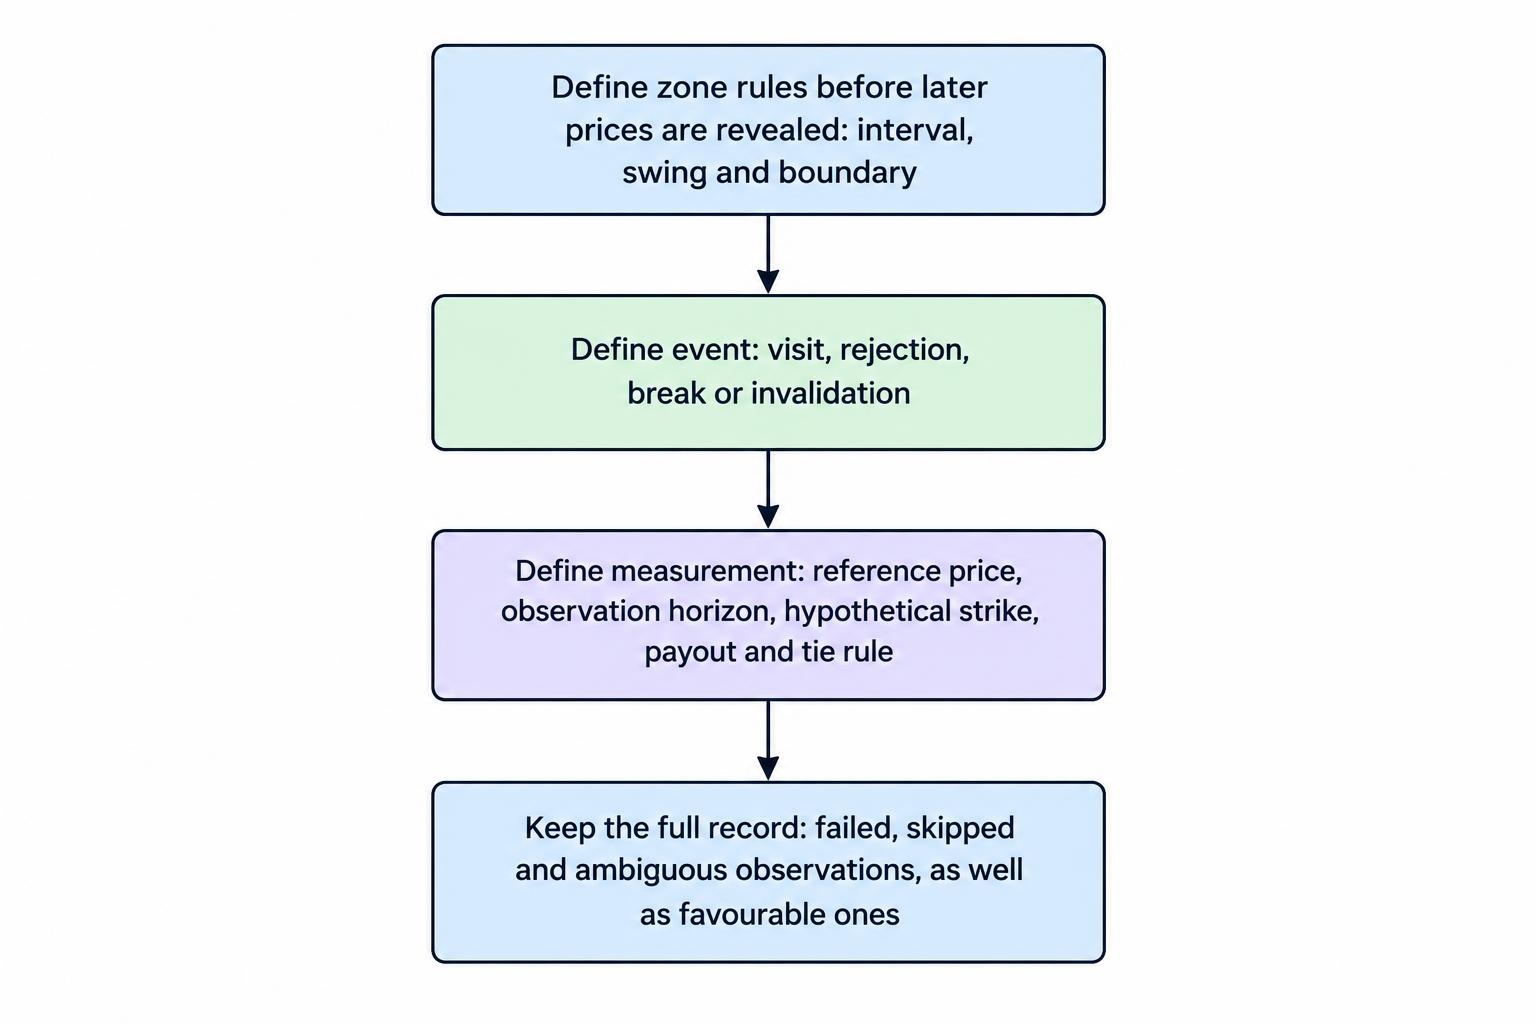
Use a short, written process:
- Define the zone: specify the chart interval, swing rule, boundary method and information needed before a level becomes eligible.
- Define the event: state what counts as a visit, rejection, break or invalidation.
- Define the measurement: record the reference price, observation horizon, hypothetical strike, payout and tie treatment.
- Keep the full record: include failed levels, skipped observations and ambiguous cases, not just favourable examples.
For automated or manual binary options backtesting, preserve a screenshot or timestamped record of each zone before the later prices are revealed. Do not redraw it to fit the reaction.
Check data resolution too. A candle’s high and low do not show which occurred first. If the rule depends on the sequence of a breakout, return and hypothetical entry within that candle, the candle alone may not contain enough information to classify it.
Keep a later period separate from the period used to develop the rules. Repeatedly adjusting zone width, confirmation candles and observation horizons against the same history can produce an attractive result that reflects selection rather than a repeatable relationship.
Keep the Review Focused on Decisions
The most useful record explains what was knowable at the time. Note why the zone qualified, what would invalidate it and whether the observed event matched the written rule. Keep that separate from the eventual result.
A trading journal should distinguish a forecasting failure from a process failure. A valid observation that ends unfavourably is different from a zone drawn late, a changed deadline or a result recorded from the wrong price series.
Avoid taking several overlapping observations from the same reaction and treating them as independent evidence. Also avoid increasing hypothetical stakes after losses to improve the appearance of recovery. Stake changes obscure whether the underlying level rule has any value.
Support and resistance are useful when they make analysis more precise: an identified area, a defined reaction and a fixed measurement period. Their value disappears when every boundary can move and every failed forecast becomes “right eventually”. A level is a testable proposition, not a promise from the market.
This article was last updated on: October 22, 2026