A price feed supplies the quotes shown on a trading platform. A benchmark provides a reference value calculated under a stated method. For binary options, the practical question is not simply whether a chart looks accurate: it is which price series the contract uses, how that series is produced, and which observation determines the result.
Two screens can show different prices without either being wrong. They may display different quote fields, trading venues, instruments or timestamps. Those differences matter most when the reference price sits close to the strike.
For Australian readers, ASIC’s binary options product intervention order bans their issue and distribution to retail clients until 1 October 2031. This article explains pricing and verification, not a route around that restriction.
How a price feed reaches the screen
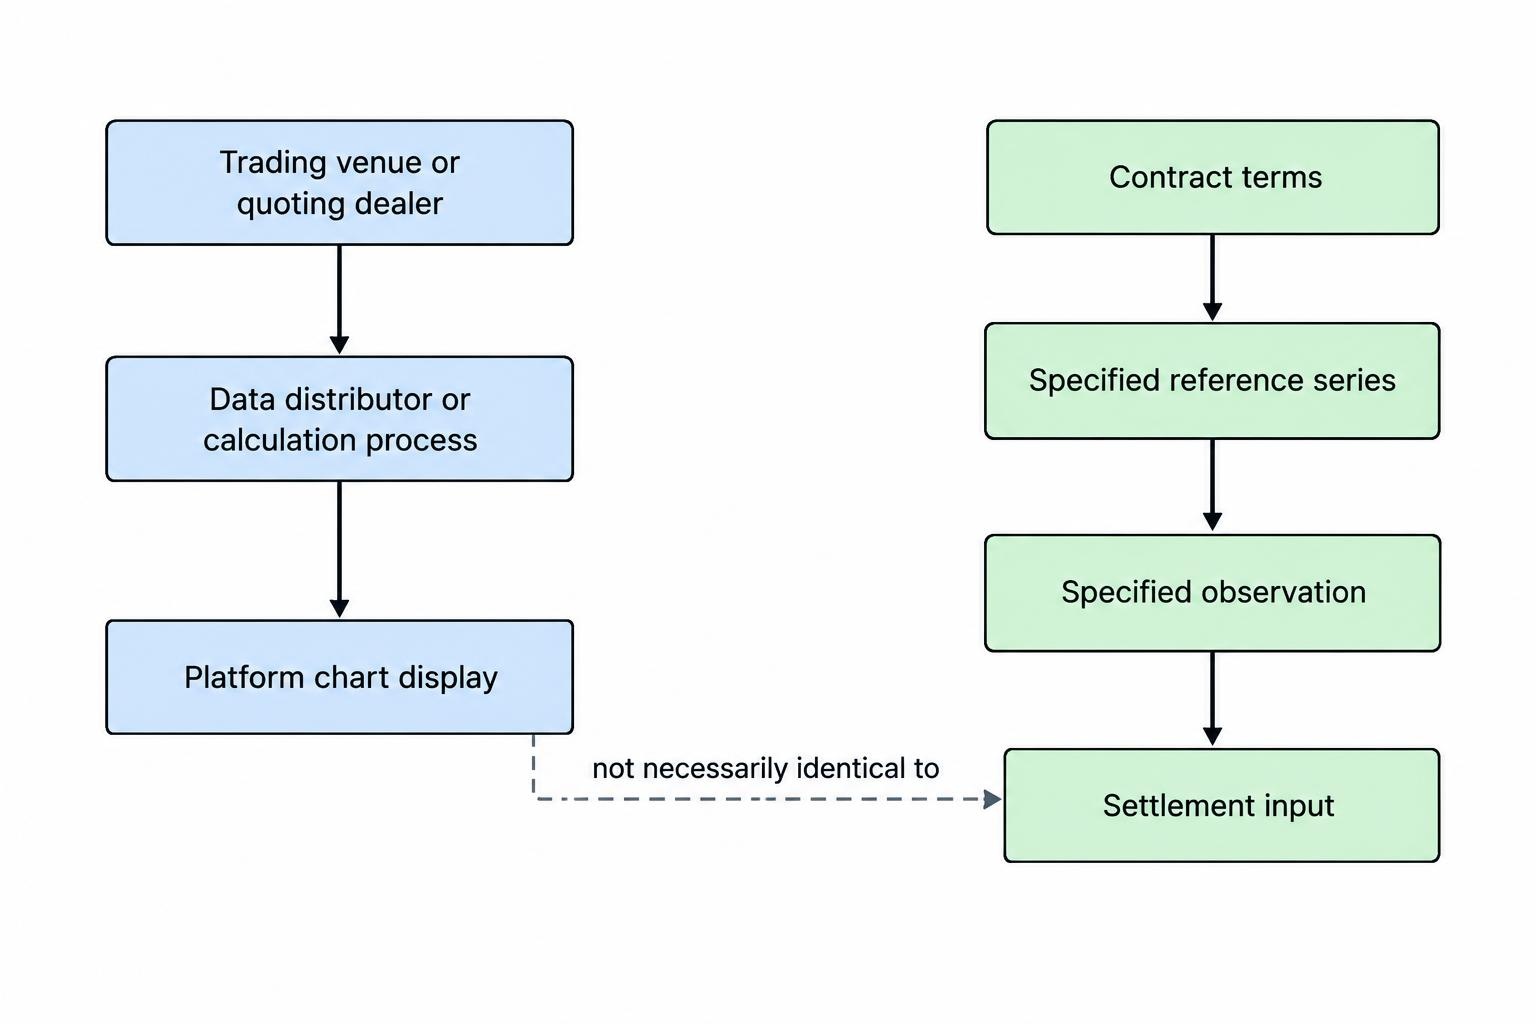
A useful way to assess a feed is to follow the price from its origin to the contract record. The chain may include a trading venue or quoting dealer, a data distributor, a calculation process and the platform displaying the result. Ask what happens at each stage rather than treating the final number as a direct view of “the market”.
The original observation might be an executed trade, a bid, an ask or a calculated index value. A distributor may combine observations from several contributors. The platform then selects which field to display and how often to refresh it. The contract’s settlement process may use that displayed series, another field from the same feed, or a separate reference.
That creates three things worth keeping separate: the chart used for analysis, the price accepted when the contract starts, and the observation used to settle it. Matching the asset name across those screens does not establish that all three use identical data.
Also distinguish the underlying reference price from the binary option’s own price or advertised payout. An AUD/USD quote describes the exchange rate. A payout percentage describes the contract’s potential return. They answer different questions.
The contract terms should connect the feed to the result. The treatment of equality, rounding and the final observation belongs in those terms; the guide to binary options settlement and ties covers those outcome rules separately.
What a benchmark does, and does not, establish
A benchmark turns defined inputs into a reference value. Its method might select a snapshot, average observations over a period, or combine data from several venues. The method matters as much as the organisation publishing the number.
A useful benchmark description identifies the inputs, observation period, calculation and publication schedule. It should also explain what happens when data is missing or appears erroneous. Without that detail, “benchmark price” is a label rather than an explanation.
Official status does not make a rate suitable for every purpose. The ECB framework for euro foreign exchange reference rates states that those rates serve information purposes and are not intended for market transactions, including indirect use as an underlying benchmark. An authoritative daily reference rate is not automatically an appropriate live settlement input.
For a binary contract, ask two separate questions: is the reference method clear, and does the contract actually use it? A recognisable data provider’s logo does not answer the second question. The written specification needs to name the relevant series and explain how it enters the calculation.
Bid, ask, midpoint and last trade are different prices
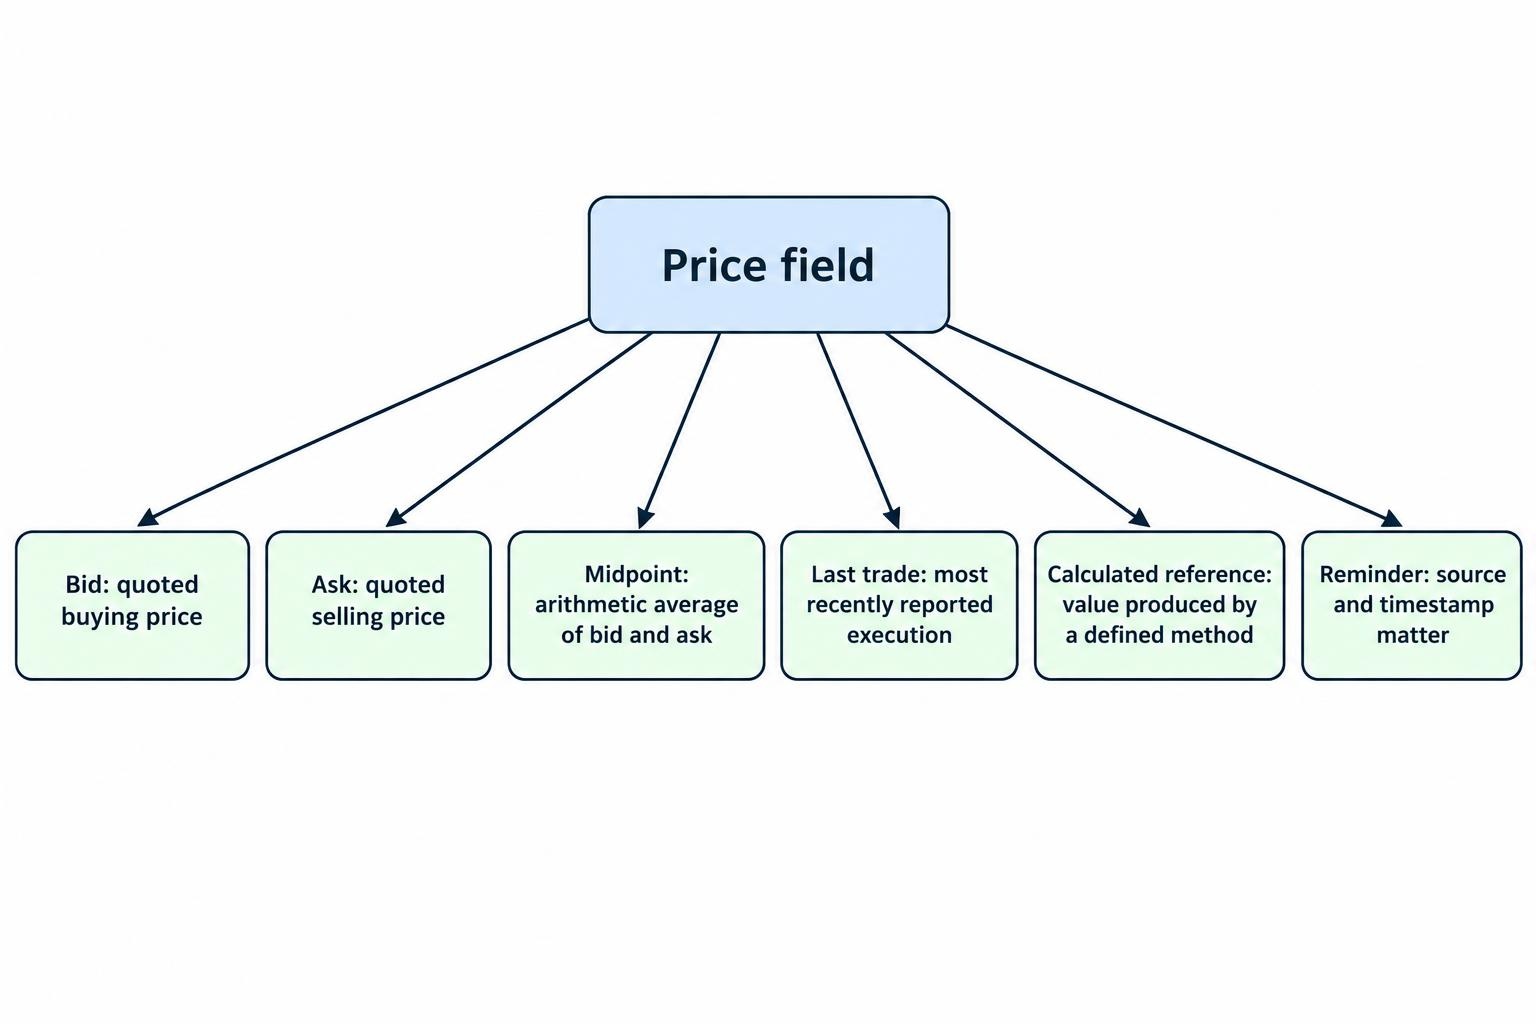
A chart labelled “price” leaves an important question unanswered: which price? Comparing a bid chart with a midpoint settlement series can create an apparent discrepancy even when both calculations are correct.
| Price field | Meaning | What to check |
|---|---|---|
| Bid | A quoted buying price. | Whether the contract uses this side of the quote. |
| Ask | A quoted selling price. | Whether the chart displays the ask or another field. |
| Midpoint | The arithmetic average of the bid and ask. | Whether both inputs share a timestamp and source. |
| Last trade | The price of the most recently reported execution. | When that execution occurred and on which venue. |
| Calculated reference | A value produced under a defined calculation method. | The inputs, observation window and publication time. |
Suppose a hypothetical feed shows a bid of 0.64998 and an ask of 0.65002. Its midpoint is 0.65000. None of those numbers is interchangeable simply because they describe the same currency pair at the same moment.
The midpoint is also not evidence that a trade occurred at that level. It is a calculation. Likewise, the last trade is evidence of an execution, but its timestamp may precede the current quote. “Latest” needs both a field name and a time.
Why the same market name can produce different quotes
Forex feeds can represent different contributors
Spot foreign exchange is decentralised and fragmented, with trading spread across dealers and venues rather than one central exchange. The BIS analysis of FX market structure documents this arrangement. There is no single exchange tape containing every spot forex transaction.
An AUD/USD comparison therefore needs more detail than two matching symbols. Identify the contributor or composite, quote side, timestamp and precision. A difference between feeds can have an ordinary explanation; it is not, by itself, proof of manipulation. Equally, market fragmentation is not an excuse for unexplained departures from a contract’s stated method.
Cash indices and futures are not interchangeable
A cash index and a futures contract linked to that index are different reference instruments. A symbol resembling “S&P 500” does not establish which one a platform uses. Check whether the reference is the published cash index, a named futures expiry or a separately calculated series.
The distinction also matters when reviewing commodity charts. Comparing a contract tied to one futures month with another month does not test the same price series. The separate explanation of cash index prices versus futures prices covers the relationship without treating either as a substitute for the other.
A cryptocurrency benchmark is not a single exchange quote
A calculated cryptocurrency reference can represent observations across venues and time rather than the last transaction on one exchange. The CME analysis of its Bitcoin Reference Rate describes a daily reference built from transactions during a one hour window, divided into intervals for calculation.
That makes it a different object from a live exchange ticker. When comparing cryptocurrency feeds, check the trading pair too: BTC/USD and BTC/USDT do not name the same quote currency. A familiar asset name is a starting point, not a complete data specification.
Timestamps and refresh rates can explain apparent mismatches
A price needs a timestamp before it becomes useful evidence. Even then, establish what that timestamp means. It could record the original market event, receipt by the data vendor, receipt by the platform or the moment the screen displayed an update.
For comparison work, record the date, time zone and available fractions of a second. “14:30” is not enough when the outcome depends on which observation arrived around a deadline. UTC avoids ambiguity from local clock changes, though converting a display to UTC does not prove that its clock was accurate.
Delay is another separate issue. The CME explanation of its public delayed quotes states that prices are delayed by at least ten minutes. A page can refresh regularly and still display delayed market data. A moving screen is not proof of a real time feed.
For a hypothetical contract lasting one minute, a ten minute delayed chart cannot establish the contemporaneous reference price. It might help identify the instrument or review an earlier period, but it cannot support a like for like comparison at the deadline.
Refresh frequency and latency also differ. A screen might receive observations quickly but redraw only at intervals. Another might redraw often using older observations. Contract acceptance introduces a further timestamp, covered in the guide to execution and latency. Keep feed timing and order timing separate when investigating a result.
Why candles are weak evidence of an exact settlement price
A candle summarises observations over a period. Its open, high, low and close depend on the input series and the way the period is defined. It does not reveal every observation inside that period or necessarily identify the observation used by a contract.
A one minute candle can show that its input series traded or quoted above a level during the minute. That does not establish the reference value at a particular second. A touch condition requires evidence of the qualifying observation during its monitoring window; a final price condition requires evidence at the relevant endpoint. The same screenshot cannot automatically prove both.
Historical display settings deserve attention too. Ask whether a chart uses adjusted share prices, a continuous futures series or a reconstruction from stored data. A useful research chart may not reproduce the series recorded for a contract. These distinctions also affect binary options backtesting, where choosing convenient historical data can produce results that do not match the intended contract.
A worked example of a feed discrepancy
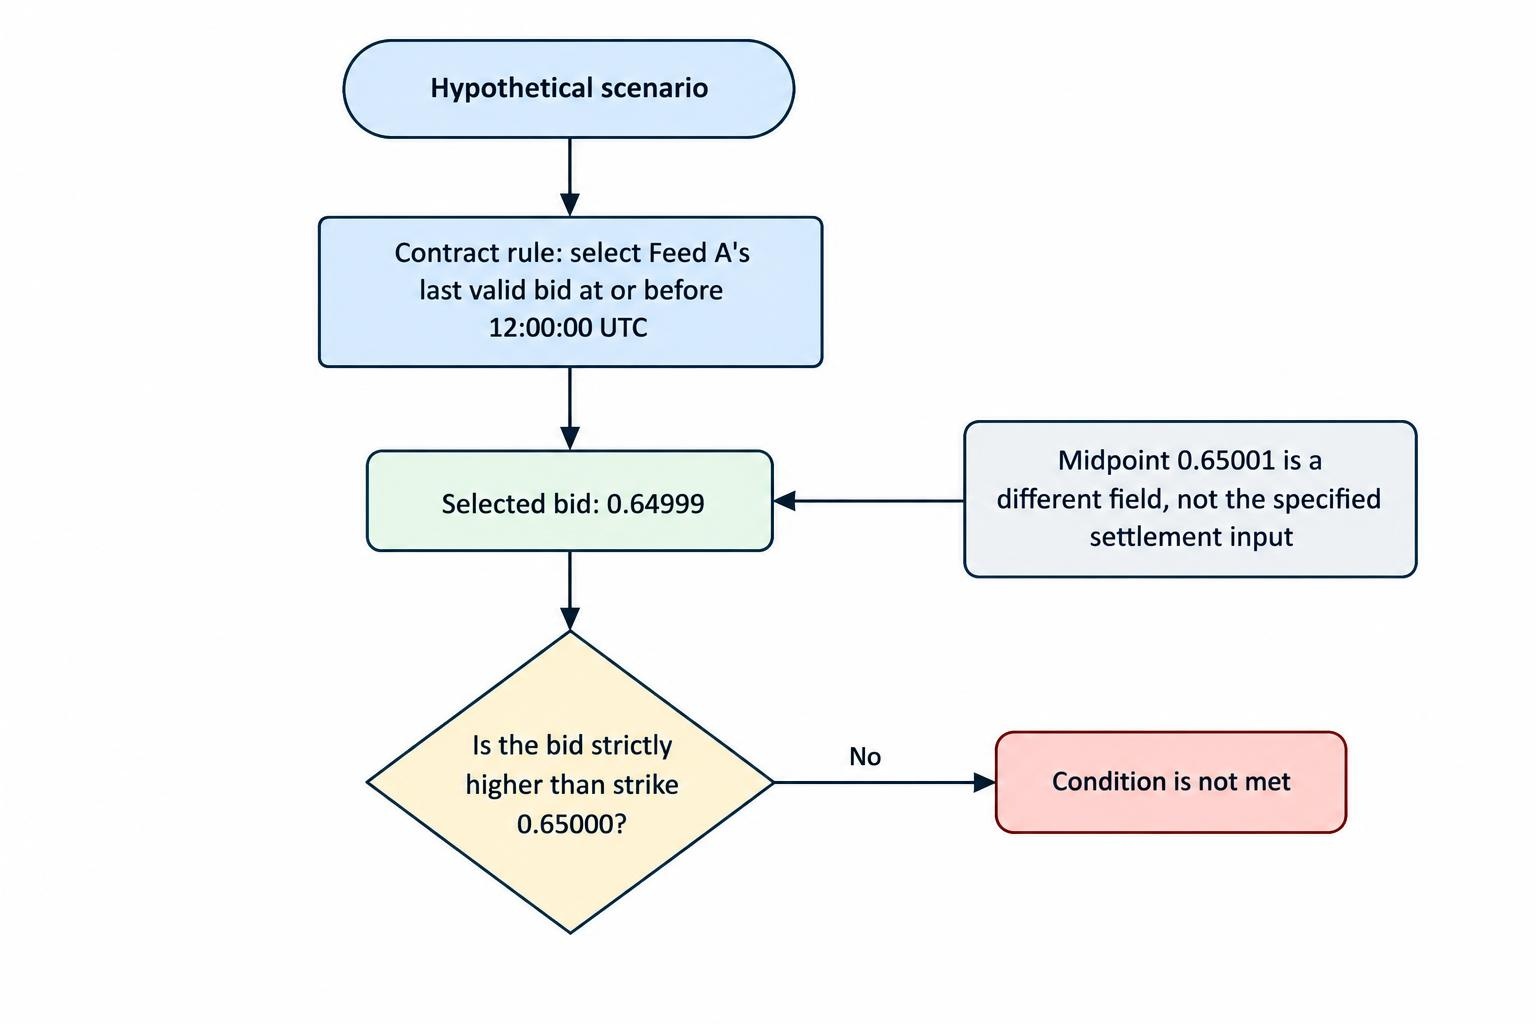
Consider a hypothetical “higher” contract with a strike of 0.65000 and expiry at 12:00:00 UTC. Its written rules use the bid from Feed A, selecting the last valid observation at or before expiry. Success requires a value strictly above the strike.
At 11:59:59.900 UTC, Feed A records a bid of 0.64999 and an ask of 0.65003. The midpoint is 0.65001. Assume no further valid observation arrives before expiry.
Under those stated rules, the selected bid is below the strike, so the condition is not met. An external midpoint chart could show a value above the strike without contradicting that result. The disagreement concerns the selected price field, not arithmetic.
Now suppose the platform displays only four decimal places. The strike, bid and midpoint could all appear as 0.6500 after rounding. A screenshot would hide the difference that determines the result. The record needs the precision used by the settlement process, not just the rounded screen value.
Change the hypothetical rule to use the midpoint, and the result changes. Change the observation rule to the first valid quote after expiry, and a different record becomes relevant. Neither change is something a reviewer should assume. The purpose of the example is to show why a price comparison starts with the contract specification, not a chart chosen after the event.
How to check a price feed method
A useful review should be repeatable: another person should be able to follow the same records and reach the same calculation. Before comparing values, establish the following details.
- Instrument identity: the full symbol, venue or contributor, quote currency and, where relevant, futures expiry.
- Price field: bid, ask, midpoint, last trade, index value or another calculated reference.
- Observation rule: the exact timestamp or window, including whether the method selects an observation before or after the deadline.
- Data timing: the stated delay, timestamp meaning, time zone and update frequency.
- Calculation rules: precision, rounding, averaging, filtering and treatment of missing or stale observations.
- Audit records: the available historical observations, contract identifiers and explanation of any later correction.
Keep the original terms as well as the price record. A clear calculation is still not a full explanation if it uses a method different from the one specified when the contract began. Conversely, an external quote does not disprove a result unless it represents the relevant instrument, field and time.
For practice, compare several observations rather than selecting only a disputed endpoint. Look for a stable offset, a timing shift or differences associated with the bid and ask. These patterns can suggest what to investigate, but they do not prove the cause without supporting records.
Separate ordinary differences from warning signs
A small mismatch is not automatically suspicious. Nor is a large mismatch automatically innocent. The stronger test is whether the difference can be explained using the disclosed method and preserved observations.
Unanswered questions become more serious when they concern the contract’s basic identity. Treat an unnamed reference feed, an unspecified price field or an undocumented outage procedure as unresolved risks. A response that prices are “from the market” does not identify a reproducible series.
The same applies to weekend quotes. If a platform displays a currency pair when the external reference being used for comparison is inactive, first establish what the displayed series represents. Do not assume it is a continuation of that external feed. The guide to OTC and weekend quotes addresses that separate issue.
Ask what happens during an interruption. Does the method suspend settlement, use another named feed, carry forward an earlier value or void the contract? Those are materially different procedures. They should be described before an interruption occurs, not improvised afterwards.
Avoid treating disagreement as an opportunity to exploit a “slow” screen. A visual gap does not establish that a contract can be accepted on the displayed terms, that the reference feeds are comparable, or that the eventual settlement will follow the apparent gap. First verify what the numbers represent.
What to preserve when a price result is disputed
Preserve the contract identifier, accepted strike, expiry timestamp, named reference series and settlement value. Keep the applicable terms and any messages describing the calculation. Where available, retain the underlying observations with their original timestamps and precision.
A screenshot is useful context, but it rarely carries all those details. Capture the instrument label, data provider, quote field, time zone and any delay notice. Avoid cropping away the settings that explain the chart. A carefully cropped number can be visually persuasive and technically useless.
Frame a request for clarification around the missing calculation: which observations were selected, which field was used, what precision applied, and how the terms produced the recorded result. That is more useful than asking why another chart “looked different”.
A trading journal can organise the records, provided it distinguishes observed facts from assumptions. Record an unexplained mismatch as unexplained, rather than assigning a cause that the evidence does not establish.
The standard is straightforward: a named instrument, a defined price field, an identifiable time and a reproducible method. Better chart graphics cannot replace any of them. If those details remain unavailable, the reference price cannot be independently verified with confidence.
This article was last updated on: October 22, 2026