Bollinger Bands place an upper and lower boundary around a moving average to show where price sits relative to its recent behaviour. They help distinguish a stretched price from a changing trend, and a quiet market from one whose price swings are widening. They do not tell you that the next candle must reverse.
For binary options analysis, that distinction matters. A forecast can prove directionally correct after a contract has expired and still produce a losing result. Reading the bands is only part of the task; the entry price, expiry and payout must also make sense.
Australian retail restriction: ASIC prohibits the issue and distribution of binary options to retail clients. The prohibition took effect on 3 May 2021 and was extended until 1 October 2031 under ASIC’s binary options product intervention order. The examples below are for education and paper testing, not a recommendation to open an offshore account.
How Bollinger Bands Are Calculated
The traditional calculation uses a 20-period simple moving average, with the outer bands placed two standard deviations above and below it. Standard deviation measures how widely the prices in the calculation differ from their average.
- Middle band: the 20-period simple moving average.
- Upper band: the middle band plus two standard deviations.
- Lower band: the middle band minus two standard deviations.
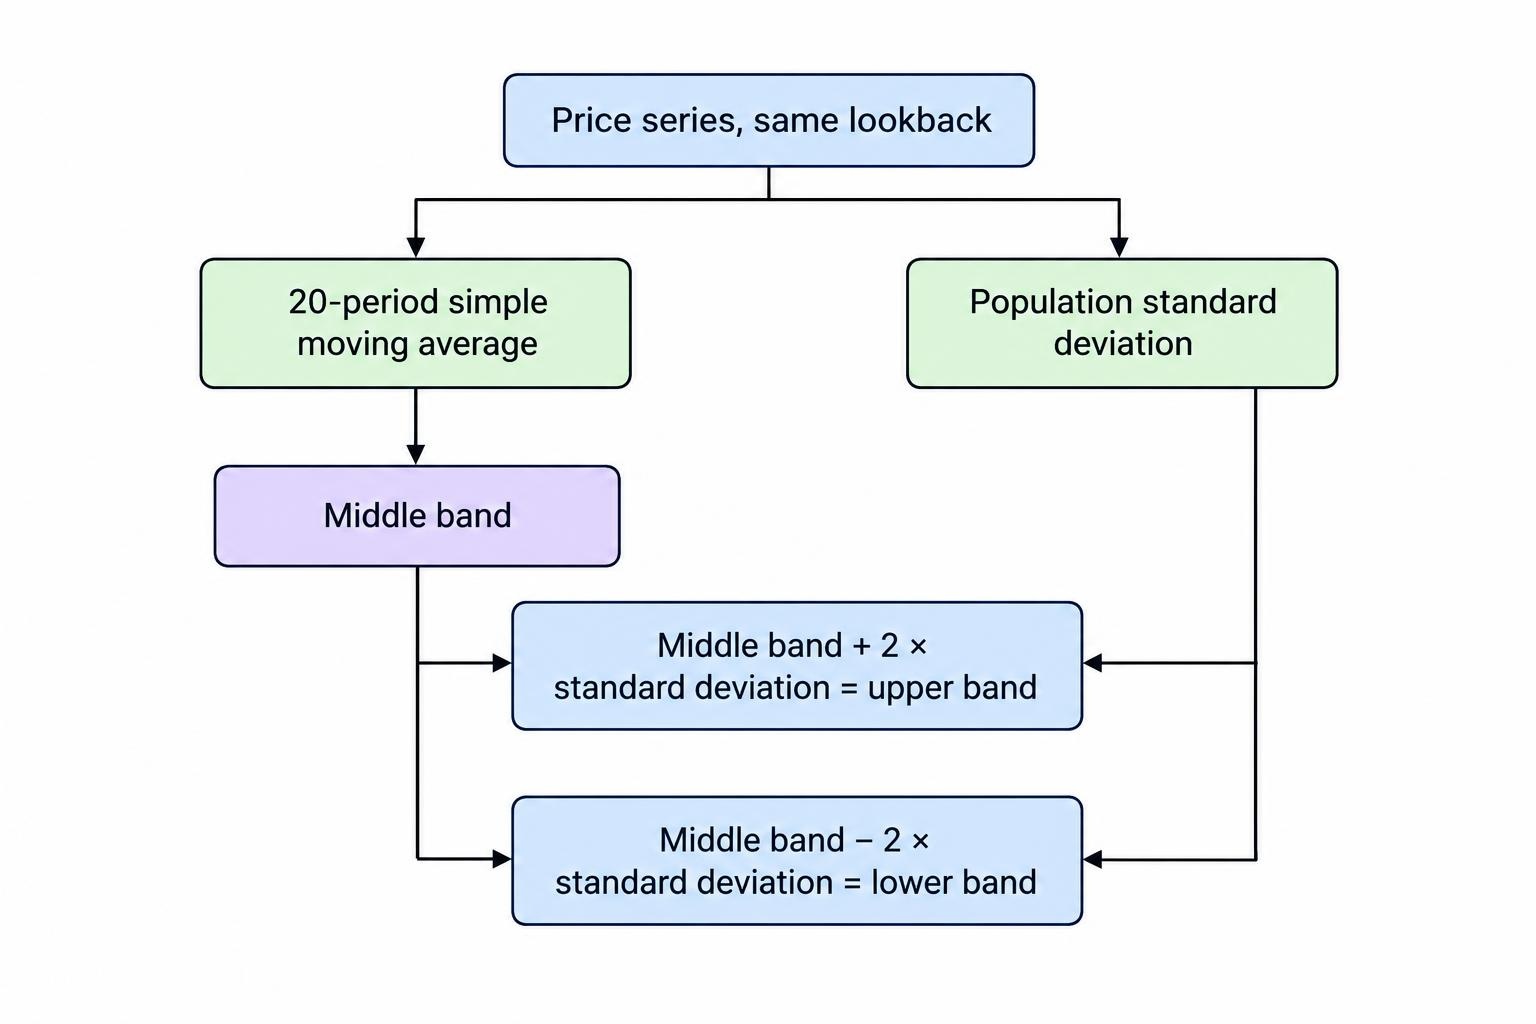
The average and standard deviation use the same price series and lookback. The traditional version uses population standard deviation, rather than the sample calculation. These details appear in John Bollinger’s explanation of the original calculation.
Suppose the last 20 closing prices on an AUD/USD chart have an average of 0.6900 and a standard deviation of 0.0005. The upper band would be 0.6910 and the lower band 0.6890. Those numbers describe the recent price distribution. They are not forecasts that AUD/USD will stop at either boundary.
As another candle enters the calculation and an older one drops out, both the average and the dispersion can change. A band can therefore move because price has changed, because older observations have left the window, or both. Treat the lines as a moving reference, not a fixed price target.
Settings: What 20 and 2 Actually Mean
A period means one chart bar, not necessarily one day. On a five-minute chart, a 20-period lookback uses 20 five-minute bars. On an hourly chart, it uses 20 hourly bars. The same numerical settings therefore describe very different spans of market activity.
Check the price input, average type and offset before comparing charts. Closing price, a simple moving average and zero offset provide a straightforward baseline. TradingView’s Bollinger Bands input documentation identifies these controls and explains how the indicator timeframe can differ from the chart timeframe.
There is no reason to assume that changing the lookback from 20 to 14 makes a strategy more accurate. A shorter window simply changes which observations influence the calculation. A larger deviation multiplier places the outer bands farther from the same average; a smaller multiplier brings them closer.
For a useful comparison, change one setting at a time and keep the entry and expiry rules unchanged. Otherwise, you cannot tell whether the result came from the bands, the timing rule or a convenient combination selected after seeing the outcome.
Also distinguish between a developing candle and a completed candle. If the latest price used in the calculation changes before the candle closes, the corresponding band values can change too. A test based on candle closes must not count a temporary intrabar touch as though it were a completed signal.
Reading the Bands Without Turning Every Touch Into a Trade
An upper-band touch means price is relatively high against the recent calculation. A lower-band touch means it is relatively low. Neither event, by itself, establishes that price should reverse. Price can continue along an outer band during a trend, a behaviour often called walking the band.
Do not turn the two-standard-deviation setting into a claim that the next price has a 95% chance of remaining inside the bands. That probability does not follow from the indicator. Both cautions form part of John Bollinger’s rules on band touches, trends and statistical assumptions.
The practical question is what else has happened around the touch. Has price returned to a previously tested boundary? Has it broken through that boundary? Is the middle band broadly flat, or moving persistently in one direction? These questions create different research hypotheses from the same visual event.
| Chart observation | Hypothesis to investigate | What remains unproven |
|---|---|---|
| Lower-band touch near a previously tested range floor | A possible rejection back into the range | Whether a rebound occurs before the chosen expiry |
| Repeated upper-band closes with rising swing lows | Possible trend continuation | Whether the next entry leaves enough room for a profitable outcome |
| Narrow bands around a compact price range | A period of price compression | The direction and timing of any subsequent break |
| A wide candle outside a band after a sharp move | Continuation or exhaustion requiring further evidence | Whether entering after the move offers any advantage |
Mark price boundaries independently before using the bands to assess them. Otherwise, a moving indicator line can become whatever support or resistance the trade needs it to be. The distinction between an indicator boundary and an established price level is covered in the guide to support and resistance.
Three Ways to Research Bollinger Band Setups
Range Rejection
A range-rejection hypothesis looks for price to move back into an established trading range after testing one of its edges. The band provides context for how far price has moved relative to its recent average. The range boundary provides a separate price reference.
A paper-testing rule could require a broadly flat middle band, several earlier reactions around the range edge, and a completed candle that moves beyond the outer band but closes back inside it. The hypothetical entry would occur only after that candle has finished, using the next observable price rather than its most attractive intrabar price.
The test also needs a cancellation rule. You might exclude a setup if price closes beyond the range boundary, or if the market no longer meets the original range definition. Write those conditions before collecting results.
This is a narrower application of mean reversion analysis, not proof that every deviation must correct. Keep the research question precise: does this defined rejection pattern improve the probability of a favourable settlement over the selected horizon?
Trend Continuation
A continuation hypothesis asks a different question. Instead of fading an outer-band touch, it examines whether price remains biased in the direction of an existing trend.
One research design could require rising swing highs and lows, an upward-sloping middle band, and a pullback followed by a completed candle showing renewed upward movement. A downward version would reverse those conditions. These are candidate rules, not established profitable settings.
Separate the trend filter from the entry trigger. “The trend is up” identifies a background condition; it does not specify a price or a time to enter. A test that treats every candle in an uptrend as an entry will answer a different question from one that waits for a defined pullback.
Record late entries separately. A continuation signal that appears only after a large candle may leave the hypothetical strike far above the price where the setup began. The direction can remain correct while that later entry loses.
The Bollinger Band Squeeze
A squeeze describes bands that have narrowed relative to their own recent history. BandWidth puts a number on that distance:
BandWidth = (upper band − lower band) ÷ middle band × 100
A low reading needs context: what counts as narrow can differ between markets and chart intervals. A break after compression can also fail and return into the previous range. TradingView’s BandWidth documentation covers the calculation, relative narrowness and squeeze behaviour.
For research, define compression numerically rather than deciding that the chart “looks tight.” One candidate rule might require BandWidth to sit below its own trailing 10th percentile, calculated using observations available at the time. That threshold is a test choice, not a recommended universal setting.
Then define what constitutes a break. A completed candle beyond both the outer band and the preceding price range is a different event from a momentary wick outside the band. Test them separately if both interest you.
Compression alone supplies no directional instruction. It also supplies no deadline. A paper test should allow for the possibility that the bands remain narrow without producing a qualifying entry.
Why Binary Options Expiry Changes the Analysis
A return toward the middle band and a profitable binary settlement are not the same outcome. The first concerns a price path. The second concerns a contract condition at a particular time.
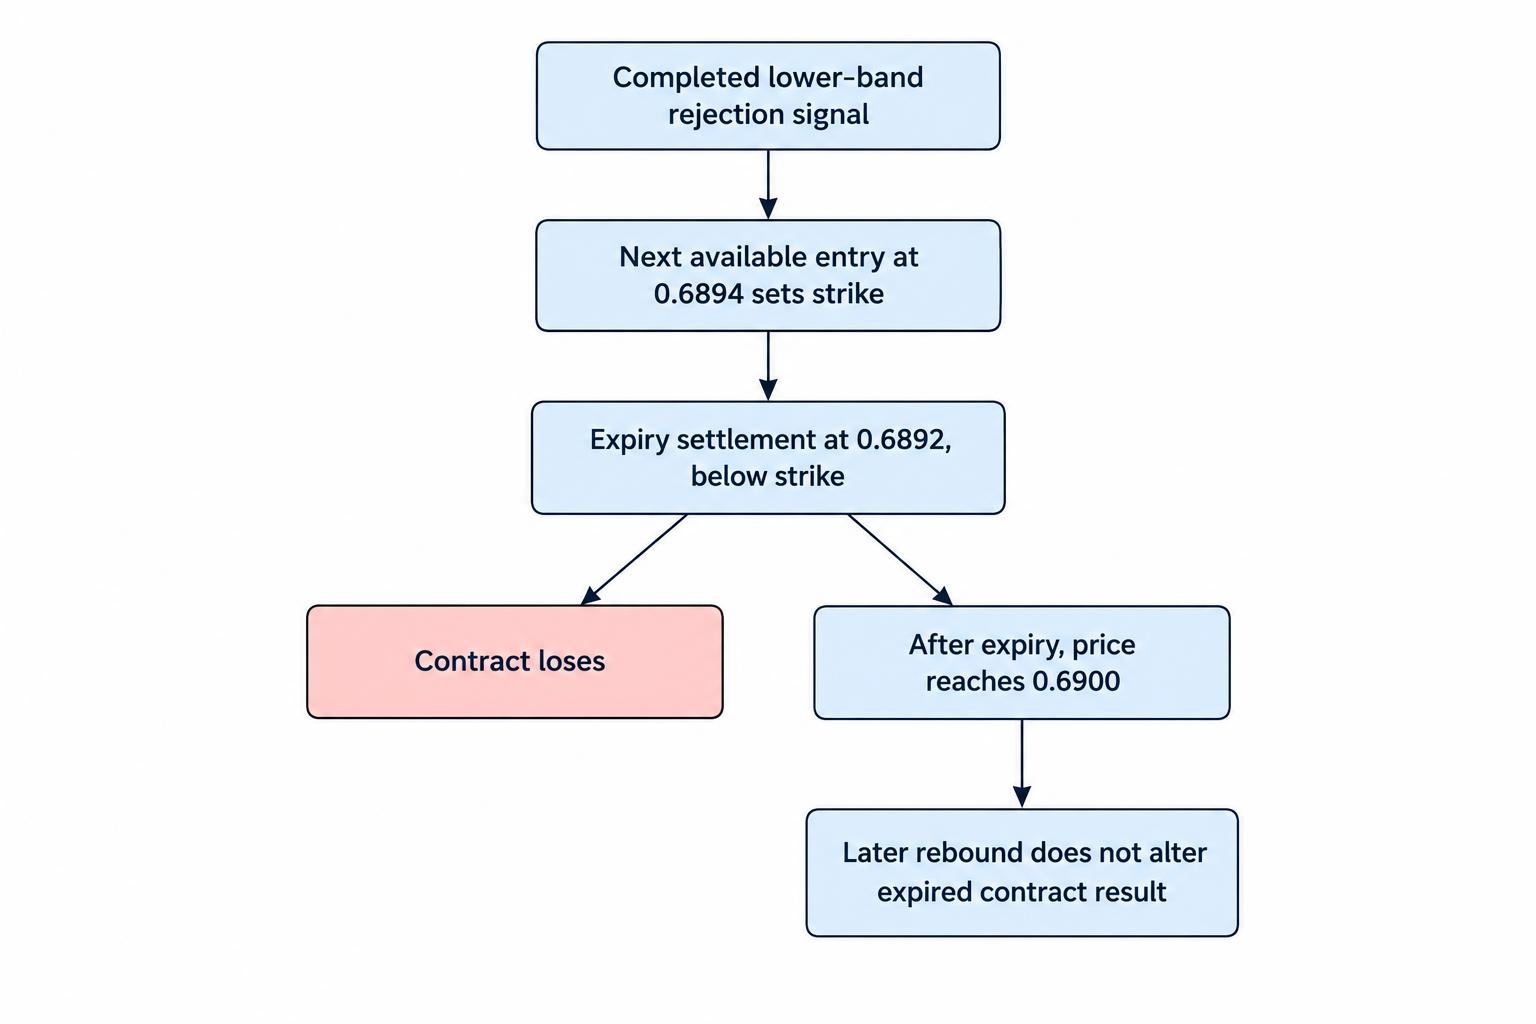
Consider a hypothetical AUD/USD lower-band rejection. Price closes back inside the band at 0.6893, and the next available entry is 0.6894. Assume that entry becomes the strike for a higher-at-expiry contract, with a strict requirement that settlement finish above it.
At expiry, price is 0.6892. Several candles later it reaches 0.6900. The proposed rebound eventually happened, but the contract still lost. A later chart screenshot can make the setup look successful if it hides the settlement time.
Test the entire sequence: signal completion, entry availability, strike and settlement. Changing any one of these changes the result being measured. Keep the contract horizon explicit using the distinctions in the guide to binary options expiry times.
There is no automatic rule that a five-minute chart requires a five-minute contract, or that a signal should receive three candles to work. Those are separate hypotheses. A longer expiry should earn its place through testing, not through the hope that a losing position needs more time.
A Better Win Rate Must Still Beat the Payout
Bollinger Band research should measure hypothetical profit and loss, not just count correct directions. The required win rate depends on what a winner pays relative to what a loser costs.
Assume a $10 stake, an $8 net profit on a win, and a $10 loss on a losing contract. Ignore fees, ties and refunds for this calculation. The break-even win rate is:
$10 ÷ ($10 + $8) = 55.56%
Across 100 hypothetical contracts, 54 wins would produce $432 in profits, while 46 losses would cost $460. The net result would be a $28 loss, despite getting more directions right than wrong.
A claimed 60% win rate would look more promising under these assumptions, but it would still need adequate evidence. A short run, selected screenshots or results obtained after repeatedly changing the rules cannot establish that the same rate will persist.
Keep payout assumptions attached to every test result. Do not apply the best payout observed during the research to every historical trade. The fuller relationship between accuracy, payouts and profitability is explained in probability and expected value in binary options.
How to Test a Bollinger Bands Rule Properly
Begin with one setup family. Combining range fades, squeeze breaks and trend pullbacks under a single “Bollinger Bands strategy” label makes weak results difficult to diagnose. Each setup proposes a different reason for price to behave favourably.
Write down the market, chart interval, band settings, price input, entry trigger and expiry. Define whether signals require a completed candle, how repeat signals are handled, and whether overlapping hypothetical contracts are allowed. A rule should be clear enough that another reader could identify the same entries.
Record failures as carefully as successes. Keep the original signal conditions visible rather than relabelling a losing range trade as a trend trade after the event. That change may be worth investigating, but it belongs in a new test.
Reserve a later period that you do not use for choosing settings. Evaluate the unchanged rules there before drawing conclusions. This separation between rule development and evaluation is addressed in backtesting binary options strategies.
A useful record includes the signal time, entry time, entry price, expiry time, settlement price and assumed payout. It should also capture exclusions, including setups rejected by the rules. Recording only entries makes it harder to check whether discretion has crept into the process.
Do not treat the signal candle’s closing price as a guaranteed executable entry. If a rule becomes known only once that candle closes, use a subsequent observable price or a clearly stated delay assumption. Test whether a modest delay changes the apparent result.
Finally, match the analysis data to the intended settlement reference as closely as the available records permit. If you cannot verify that relationship, label the result as a chart study rather than a contract-performance test. The relevant distinctions are covered in price feeds and settlement benchmarks.
Common Errors That Make the Bands Look Better Than They Are
Choosing the expiry after seeing the outcome. If a rebound takes seven candles, assigning seven candles retrospectively proves very little. The horizon must exist before the result.
Comparing a wick with a closing-price rule. A candle can move beyond a band and finish back inside it. Those observations may support different tests, but they should not be swapped whenever one produces a nicer result.
Adding indicators without defining their job. If a second tool is intended to filter trend direction, write down the filter. If it measures momentum, specify what reading qualifies. More lines do not make an ambiguous decision measurable.
Reporting only the strongest setting. If dozens of combinations were tried, disclose that search. A winning combination selected from many attempts needs a tougher examination than a rule specified in advance.
Increasing the hypothetical stake after a loss. Keep stake sizing separate from signal evaluation. Otherwise, a recovery sequence can obscure whether the original entry rule offered any advantage.
Where Bollinger Bands Fit in an Analysis Process
Give the bands a defined role: describing relative price position, measuring compression, or helping classify a setup for further testing. Do not ask them to establish direction, entry timing, expiry and profitability all at once.
The calculation is simple, the interpretation is not. A useful process separates what the chart shows from what the trader expects, then checks that expectation against recorded outcomes. Within a broader technical analysis process, Bollinger Bands can organise those questions. They cannot answer them without evidence.
This article was last updated on: October 22, 2026