Natural gas binary options are contracts whose outcome depends on whether a stated gas price condition is met within a defined period. A high/low contract, for example, asks whether the settlement price will finish above or below a strike. It does not give the holder ownership of natural gas, a futures position or shares in an energy company.
Australian retail restriction: ASIC’s ban on issuing and distributing binary options to retail clients took effect on 3 May 2021 and extends until 1 October 2031. The ASIC announcement extending the binary options ban sets out that restriction. The examples below explain market mechanics for education and paper analysis, not how to bypass the ban.
Which natural gas price does the contract follow?
“Natural gas” is not a complete description of an underlying market. Before analysing a contract, identify its benchmark, price provider and, where relevant, futures delivery month.
Henry Hub in Louisiana is the delivery point for the standard NYMEX Henry Hub Natural Gas futures contract, identified by the product code NG. Its prices are quoted in dollars and cents per MMBtu, meaning one million British thermal units. These details appear in the NYMEX Henry Hub Natural Gas futures rules. A binary contract referencing that market remains a separate product with its own terms.
Do not substitute a European gas chart, an Australian wholesale gas quotation or an energy company’s share price for the reference named in a contract. Even a chart labelled “Henry Hub” needs closer inspection: is it showing a spot assessment, a named futures month or a continuous futures series?
Two dates also need separating. The underlying futures contract has a delivery month and an exchange trading deadline. The binary option has its own expiry, which might occur well before that deadline. A binary expiring on Thursday afternoon does not necessarily reference gas for delivery that Thursday.
How a natural gas binary option settles
Consider a hypothetical high/low contract with a strike of US$3.000 per MMBtu and an expiry at 15:00 on a stated day. Its condition is that the defined settlement price must finish strictly above the strike.
Assume a hypothetical A$100 stake, an 80% net profit on a winning outcome and loss of the entire stake on a losing outcome. These figures are teaching assumptions, not a current market quotation.
| Settlement price | Result under the stated condition | Account outcome |
|---|---|---|
| US$3.040 | Above the strike: win | A$180 returned, including A$80 profit |
| US$2.980 | Below the strike: loss | A$100 stake lost |
| US$3.000 | Exactly equal: apply the contract’s tie rule | Depends on the written terms |
A finish at US$3.200 would produce the same winning payment as US$3.001 under this assumed structure. A bigger price move is not a bigger payout. Conversely, a tiny move to the losing side can still cost the whole stake.
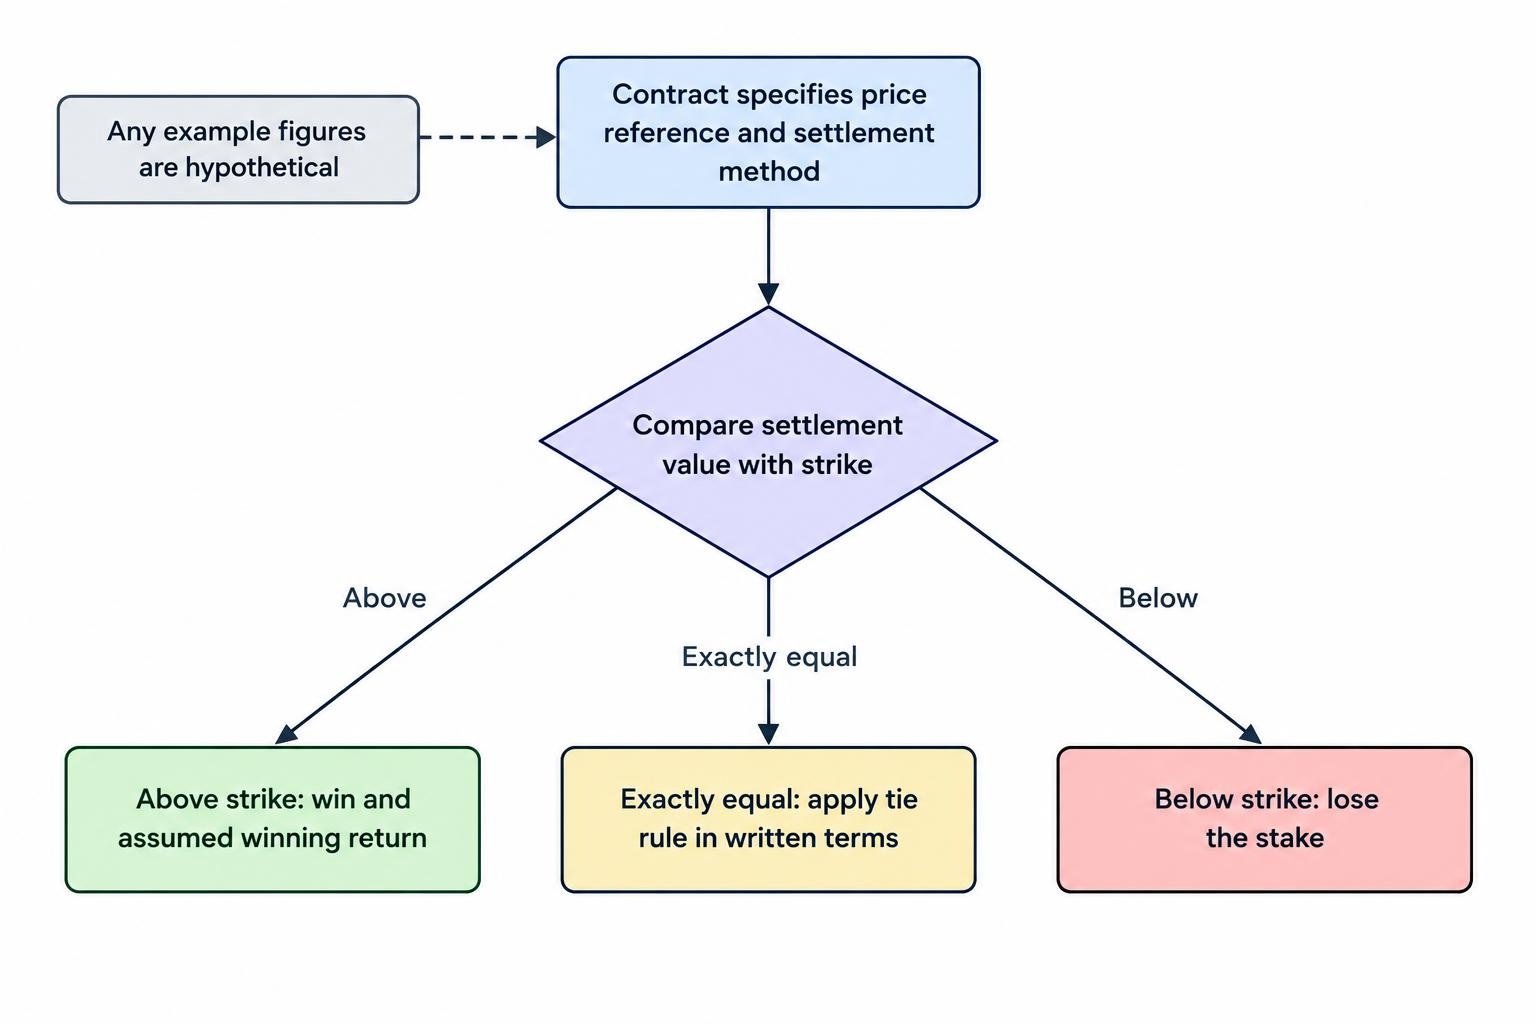
The settlement method matters just as much as the chart. Establish whether the outcome uses a last trade, bid, ask, midpoint or another defined value, and whether it uses one observation or an averaging period. Our guide to price feeds and benchmarks covers those distinctions.
An external chart is useful for analysis, but it cannot replace the settlement reference written into the contract. Record the full condition rather than reducing it to “gas goes up”.
What moves natural gas prices?
For a Henry Hub reference, start with the US gas balance. Production, storage and imports or exports affect supply, while weather, economic activity and competing fuels affect demand. Cold weather can increase heating demand; hot weather can increase demand for gas used in electricity generation. Severe cold can also disrupt production. Stored gas can cushion periods of heavy consumption. These relationships are covered in the EIA analysis of natural gas price drivers.
Those relationships do not provide a ready-made binary signal. A useful analytical question is not simply whether a forecast is cold, but whether it is colder than the forecast already being considered. The same distinction applies to production estimates and export demand.
Consider a hypothetical forecast revision. Monday’s outlook points to very cold conditions; Tuesday’s still points to cold conditions, but less severe than Monday’s projection. Calling Tuesday’s update “cold” misses the change that the analysis needs to assess.
Keep the location relevant, too. For a US benchmark, assess weather and infrastructure conditions affecting that market rather than using Australian temperatures as a shortcut. Start with the contract’s reference, then select the information that belongs to it.
Reading the EIA storage report without oversimplifying it
The US Energy Information Administration’s Weekly Natural Gas Storage Report has a standard release time of Thursday at 10:30 a.m. US Eastern Time. Holidays can change the day or time, so check the official natural gas storage report release schedule for the date being studied. Record the release in your local time zone as well.
For paper analysis, separate three questions: what happened to storage, how that compared with a recorded expectation, and where total stocks stood relative to the comparison period being used. Do not treat a weekly change as a complete market assessment.
A hypothetical storage surprise
Suppose a paper exercise records an expected storage withdrawal of 100 billion cubic feet, abbreviated Bcf. The published withdrawal is 80 Bcf. Gas has still left storage, but the withdrawal is smaller than the expectation used in the exercise.
That result would be less supportive of a scarcity argument than the expected figure, all else being equal. It does not establish that the next price movement must be downward. The expectation may have been poorly measured, other information may matter, and the chosen expiry may capture a different part of the price response.
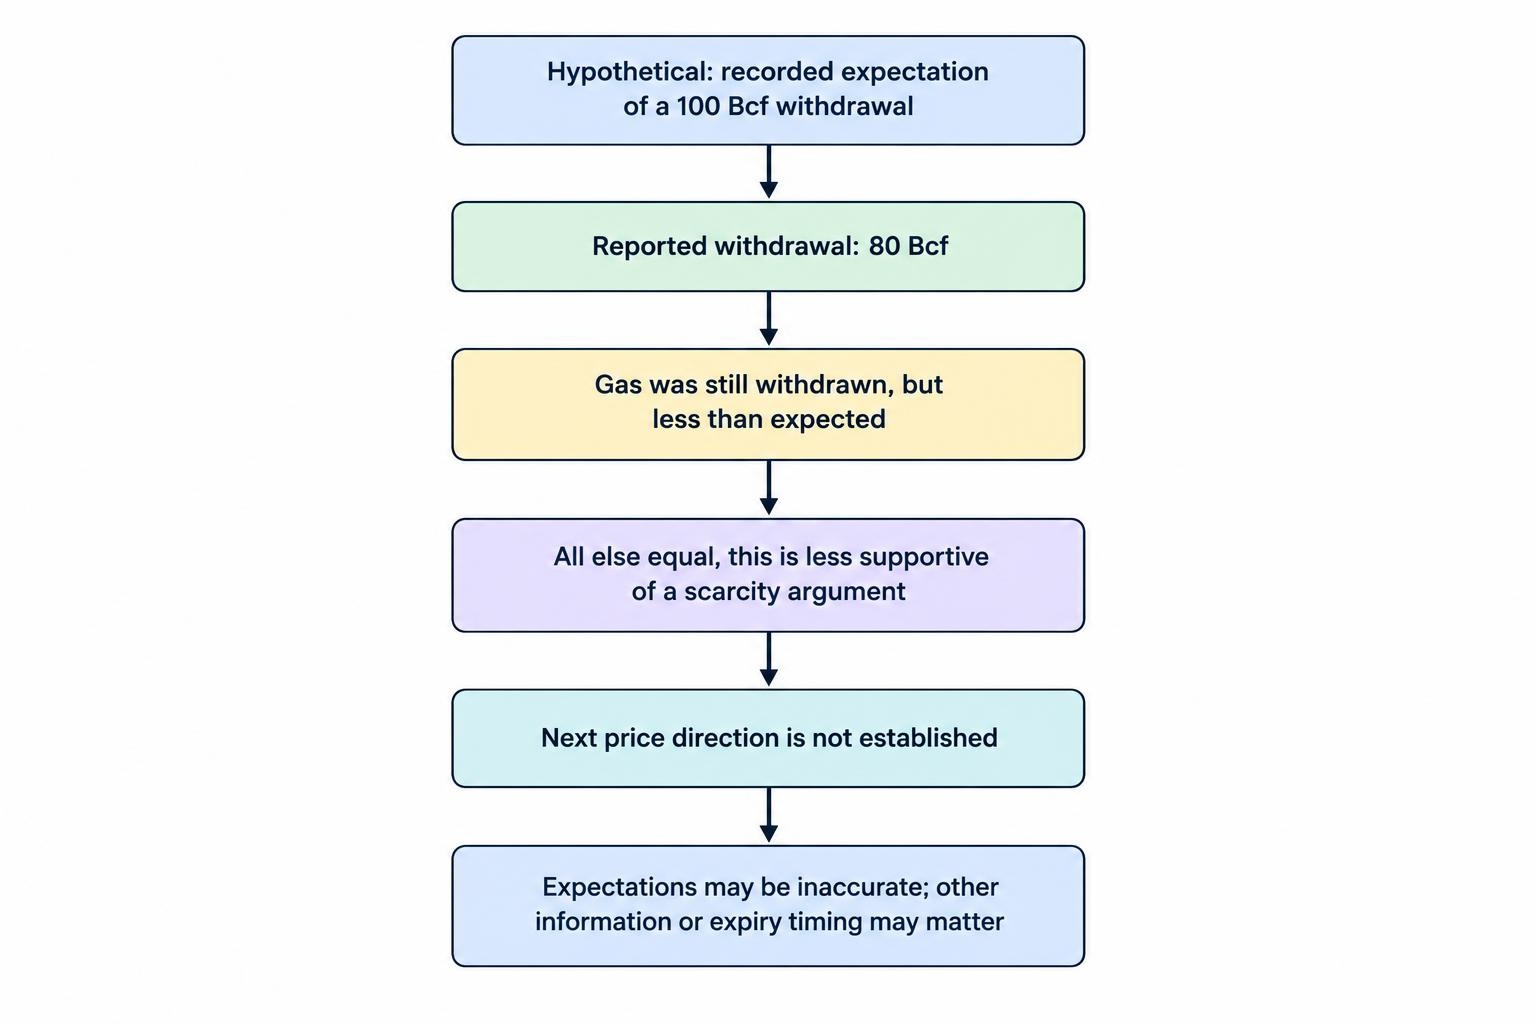
A useful observation record includes the expectation and its origin, the reported number, any revisions, and prices at predetermined intervals after publication. Do not select the most convenient forecast after seeing the outcome.
For a binary exercise, distinguish an immediate move from the eventual settlement. A price could fall after publication, rebound within several minutes, then finish above its starting point. Each expiry would answer a different question. “The report was bearish” is not enough to score all three periods.
Futures rollovers can confuse the chart
Futures contracts expire. Moving a futures position from an expiring contract into a later one involves closing the earlier position and opening the later position, as set out in CME Group’s explanation of futures expiration and rollover. This is separate from the expiry of a binary option.
When reviewing a continuous gas chart, check its contract-switching and price-adjustment rules before treating a sudden change as a market signal.
For a hypothetical example, suppose the earlier futures month is priced at US$2.900 and the next month at US$3.100 at the same moment. If a chart switches from the first quotation to the second without an adjustment, the displayed level changes by US$0.200. That comparison alone does not show that either individual contract rallied by US$0.200.
The practical consequence is straightforward: record the actual futures month behind an observation. If an apparent breakout coincides with a chart switch, inspect the individual contracts before classifying it. A pattern created by changing the reference is not evidence of buying pressure within one contract.
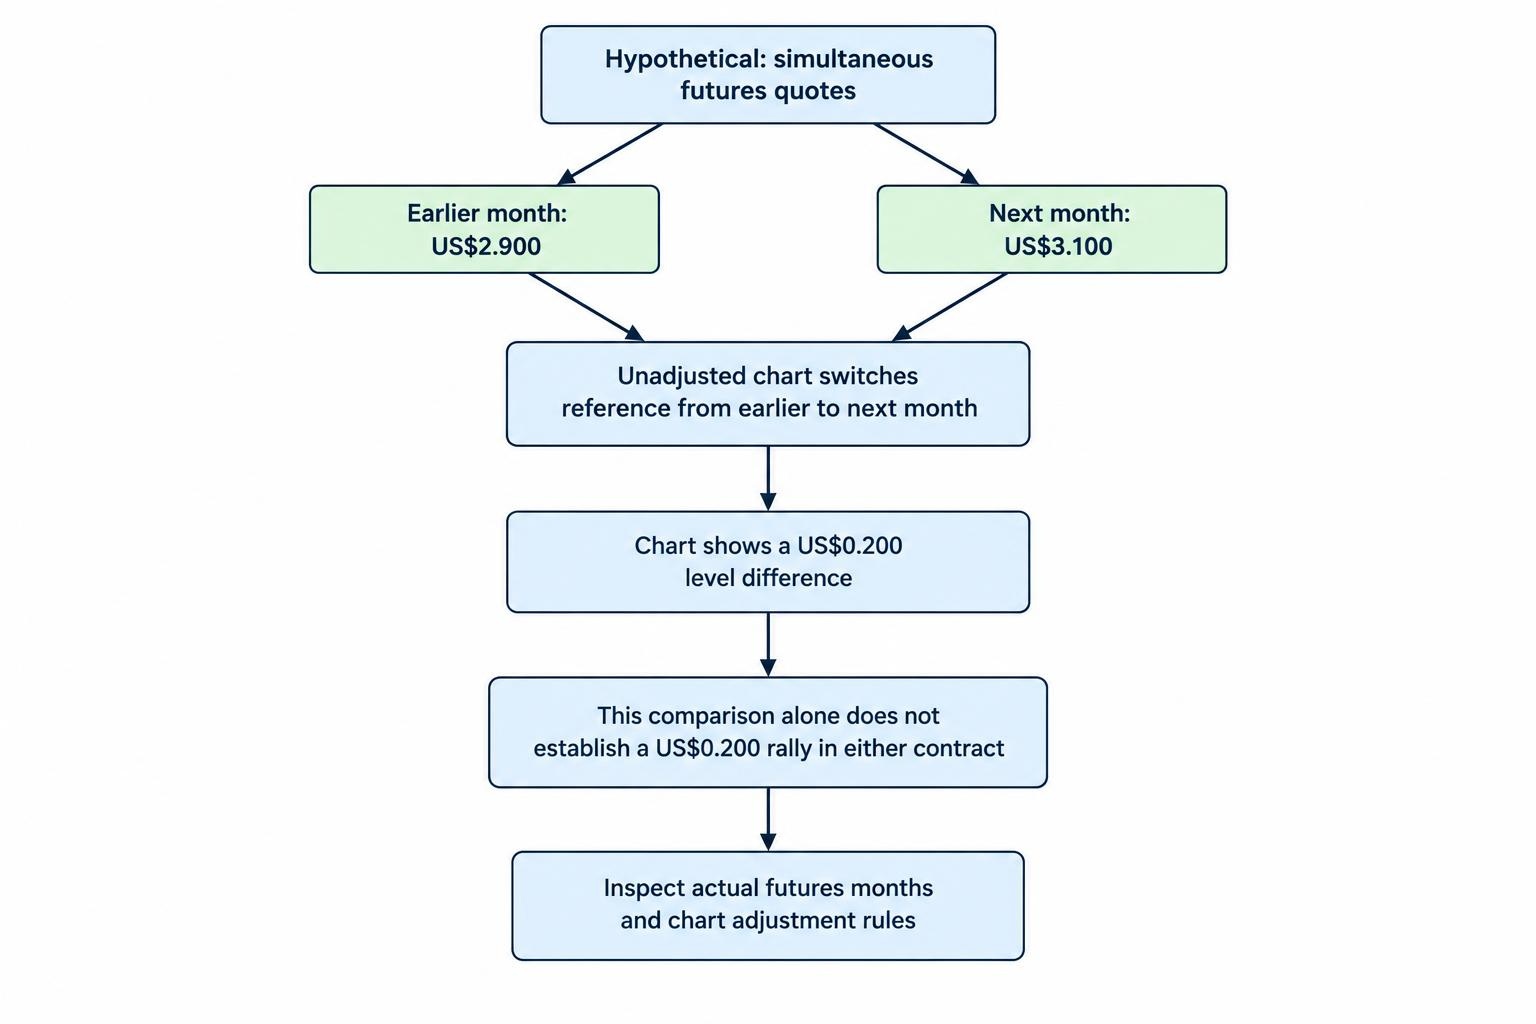
For a binary contract, also check whether its terms address an underlying contract change during its life. If the reference or adjustment method cannot be established, leave the observation out of a performance study rather than guessing.
Expiry must match the question being tested
A view about winter supply does not, by itself, justify a prediction about the next sixty seconds. Separate the reason for expecting a move from the deadline by which that move must occur.
For paper analysis, write the hypothesis before choosing the observation period. “A storage surprise will produce a sustained reaction over the following hour” is testable. “Gas should rise because winter is coming” leaves the entry, expiry and failure condition undefined.
Also separate a fixed clock expiry from a duration measured after acceptance. A contract ending at 14:00 leaves different amounts of time depending on when it begins. A contract lasting fifteen minutes after acceptance follows another timing rule. Do not mix those structures in one test.
A longer expiry is not automatically safer. It gives the hypothesis more time to develop, but also more time to encounter contrary information. A shorter expiry does not remove uncertainty; it changes which price movements determine the result.
For repeatable observations, record the exact start time, strike, expiry and time zone. “Around lunchtime” belongs in a lunch plan, not a settlement record.
Payouts determine the required success rate
Being right more often than wrong does not guarantee a profit when a losing outcome costs more than a winning outcome earns.
Using the earlier hypothetical terms, a win earns A$80 and a loss costs A$100. Fifty wins and fifty losses across 100 equal stakes would therefore produce A$4,000 in profits against A$5,000 in losses: a net loss of A$1,000 before any other costs.
The break-even win rate is the amount lost on a losing outcome divided by the sum of that loss and the profit on a winning outcome:
100 ÷ (100 + 80) = 55.56%
This assumes identical stakes, identical payouts, no ties and no fees. If those assumptions change, recalculate. The guide to probability and expected value in binary options develops the calculation beyond this example.
A claimed 60% success rate therefore needs more context. What were the payouts? Were all observations included? Did the strike and expiry match the recorded signal? A direction forecast measured against an unrelated chart is not a verified binary contract result.
A practical paper research process
Natural gas research becomes more useful when the records are consistent rather than elaborate. A small spreadsheet with well-defined fields is preferable to pages of commentary that cannot be checked.
- Define the reference: record the benchmark, data feed, futures month where applicable, and whether the chart is continuous.
- State the hypothesis: identify the event or condition being studied and the expected direction before the outcome occurs.
- Fix the timing: record the observation start, hypothetical strike, expiry and settlement method.
- Separate price and payment: log both the price result and the profit or loss under the assumed payout.
- Keep rejected observations: note missing data, unclear references and other reasons an exercise could not be scored.
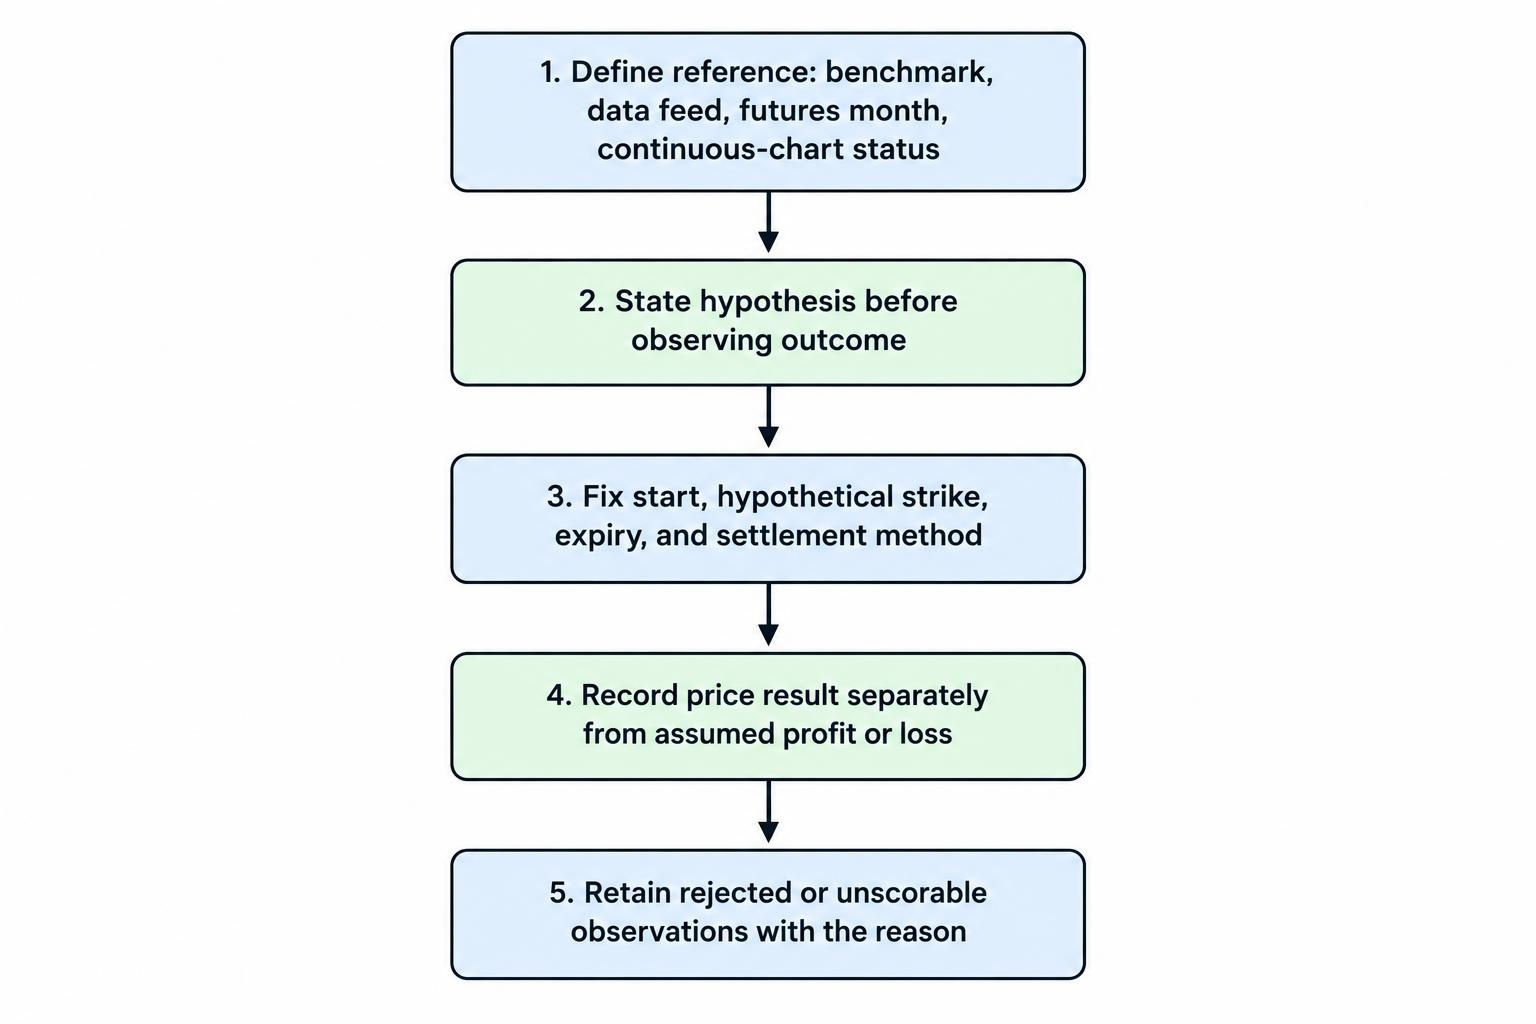
Review results by category rather than treating every gas observation as interchangeable. A storage-release exercise should be distinguishable from an ordinary session observation. A one-minute test should not be pooled with an hour-long test without retaining that distinction.
Set the rules before inspecting results. Changing the expiry after seeing a reversal or excluding inconvenient losses makes the exercise easier to win on paper and less useful for assessing the original idea.
Paper results also need honest boundaries. If the exercise uses an external chart instead of a documented settlement feed, label it as a directional study. Do not present it as evidence of achievable contract returns.
Is natural gas a suitable market to study?
Natural gas is worth studying when the research question concerns its supply, demand, storage or pricing structure. It is a poor choice when the only reason is that a chart looks busy.
For any hypothetical binary assessment, the order of work should be clear: establish the reference price, define the settlement condition, choose a defensible observation period, then evaluate the payout mathematics. None of those steps removes the Australian retail restriction.
If comparing gas with other resources, use the broader commodity binary options guide to keep the market differences separate from the contract mechanics. The central test remains the same: can the exact price condition, deadline and financial outcome be established without assumptions? If not, the exercise is not ready to be scored.
This article was last updated on: October 22, 2026