S&P 500 binary options attach a fixed financial outcome to a question about the US sharemarket benchmark: will its reference price finish above or below a stated level at expiry? The challenge is not simply predicting the index’s direction. The price feed, strike, settlement time and payout all affect the result.
Australian retail restriction: ASIC’s ban on issuing and distributing binary options to retail clients took effect on 3 May 2021 and extends until 1 October 2031. The ASIC announcement extending the binary options ban sets out that restriction. This article covers market analysis and hypothetical contract mechanics, not a route to live binary options trading for Australian retail clients.
What the S&P 500 Measures
The S&P 500 measures the large company segment of the US equity market through 500 constituent companies. Its standard version uses float adjusted market capitalisation weighting: companies with a larger market value of publicly available shares carry more weight. It is not an equal vote among 500 businesses. The S&P US Indices Methodology details its construction and identifies SPX as an index ticker.
That weighting matters when analysing a short expiry. A rise across many smaller constituents can coexist with weakness in the index if larger constituents fall enough. Counting green and red shares is not a substitute for assessing their weighted contribution.
For a simplified illustration, assume a company has a 6% index weight. A 2% move in that share would contribute roughly 0.12 percentage points to the index return, holding everything else unchanged. This is an illustration, not a current constituent weight.
The broader stock index binary options guide covers comparisons between benchmarks. Here, the focus is the S&P 500 reference price and the practical consequences of using it in a fixed outcome contract.
How an S&P 500 Binary Contract Works
A binary option pays according to a yes or no proposition rather than granting ownership of the underlying shares. A simple proposition might ask whether an S&P 500 reference price will be strictly above 6,000 at 10:15 am New York time. The joint CFTC and SEC binary options investor alert describes this payout structure and warns about fraudulent trading platforms.
To interpret that proposition, establish the reference instrument, strike, expiry timestamp, settlement method and payment terms. “S&P 500 higher” is not a complete contract description. Higher than the previous close, higher than the entry quote and higher than a separate strike are three different questions.
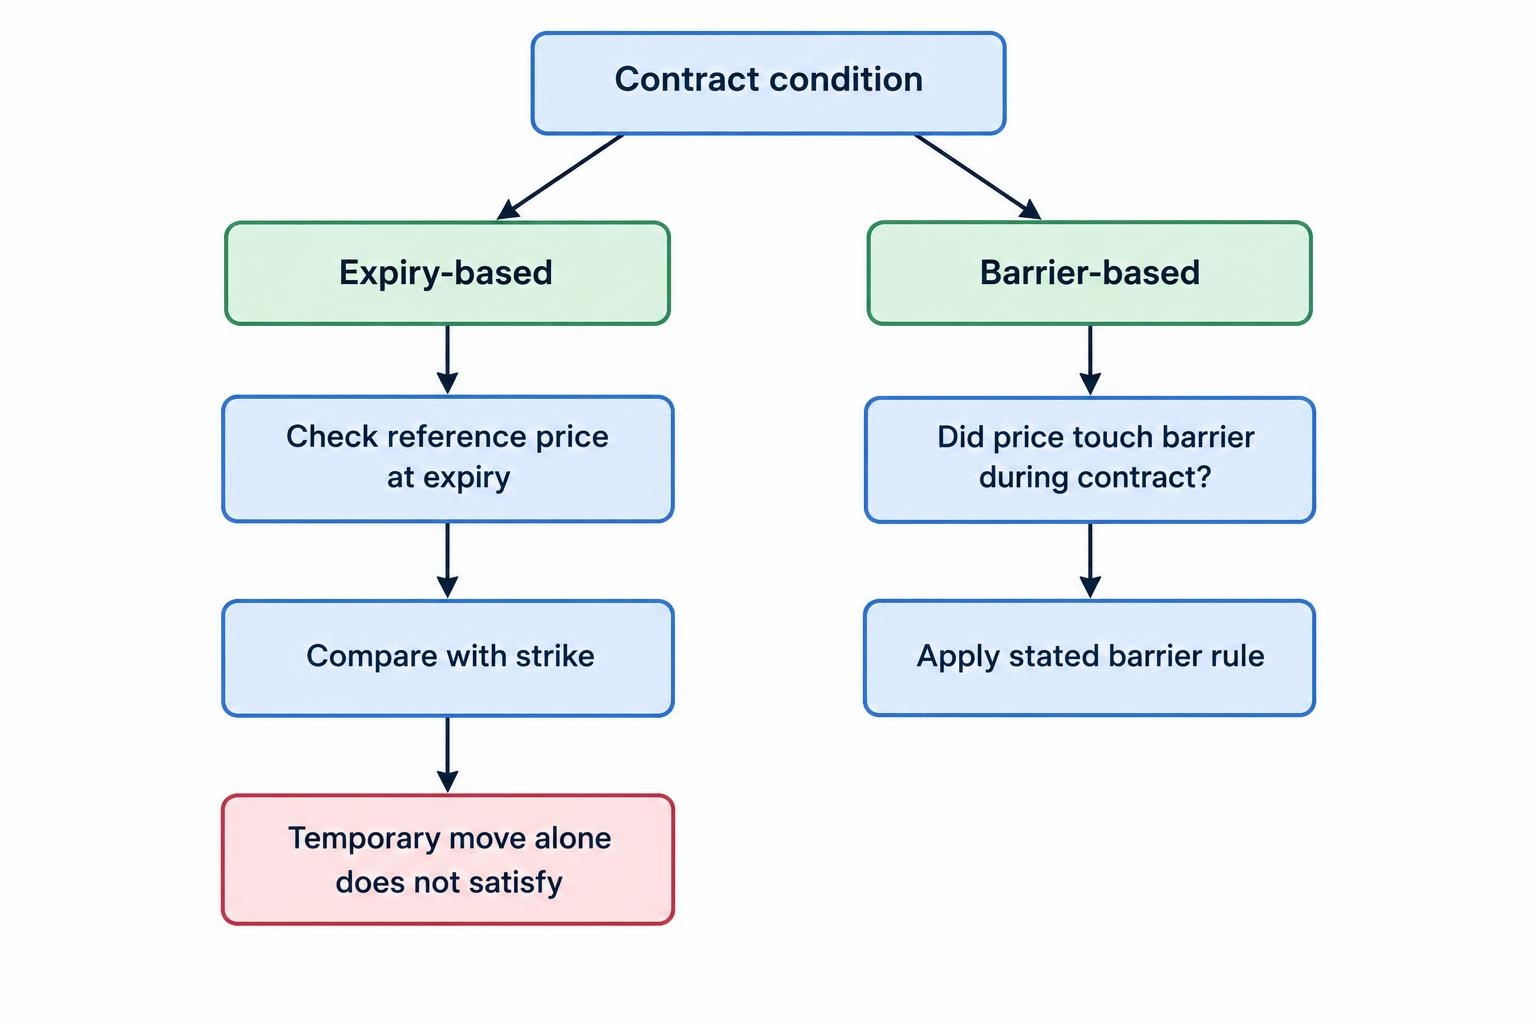
A contract that checks the price at expiry also differs from one that checks whether a barrier was touched during its life. A temporary move through the target does not necessarily satisfy an expiry based contract.
A Hypothetical Worked Example
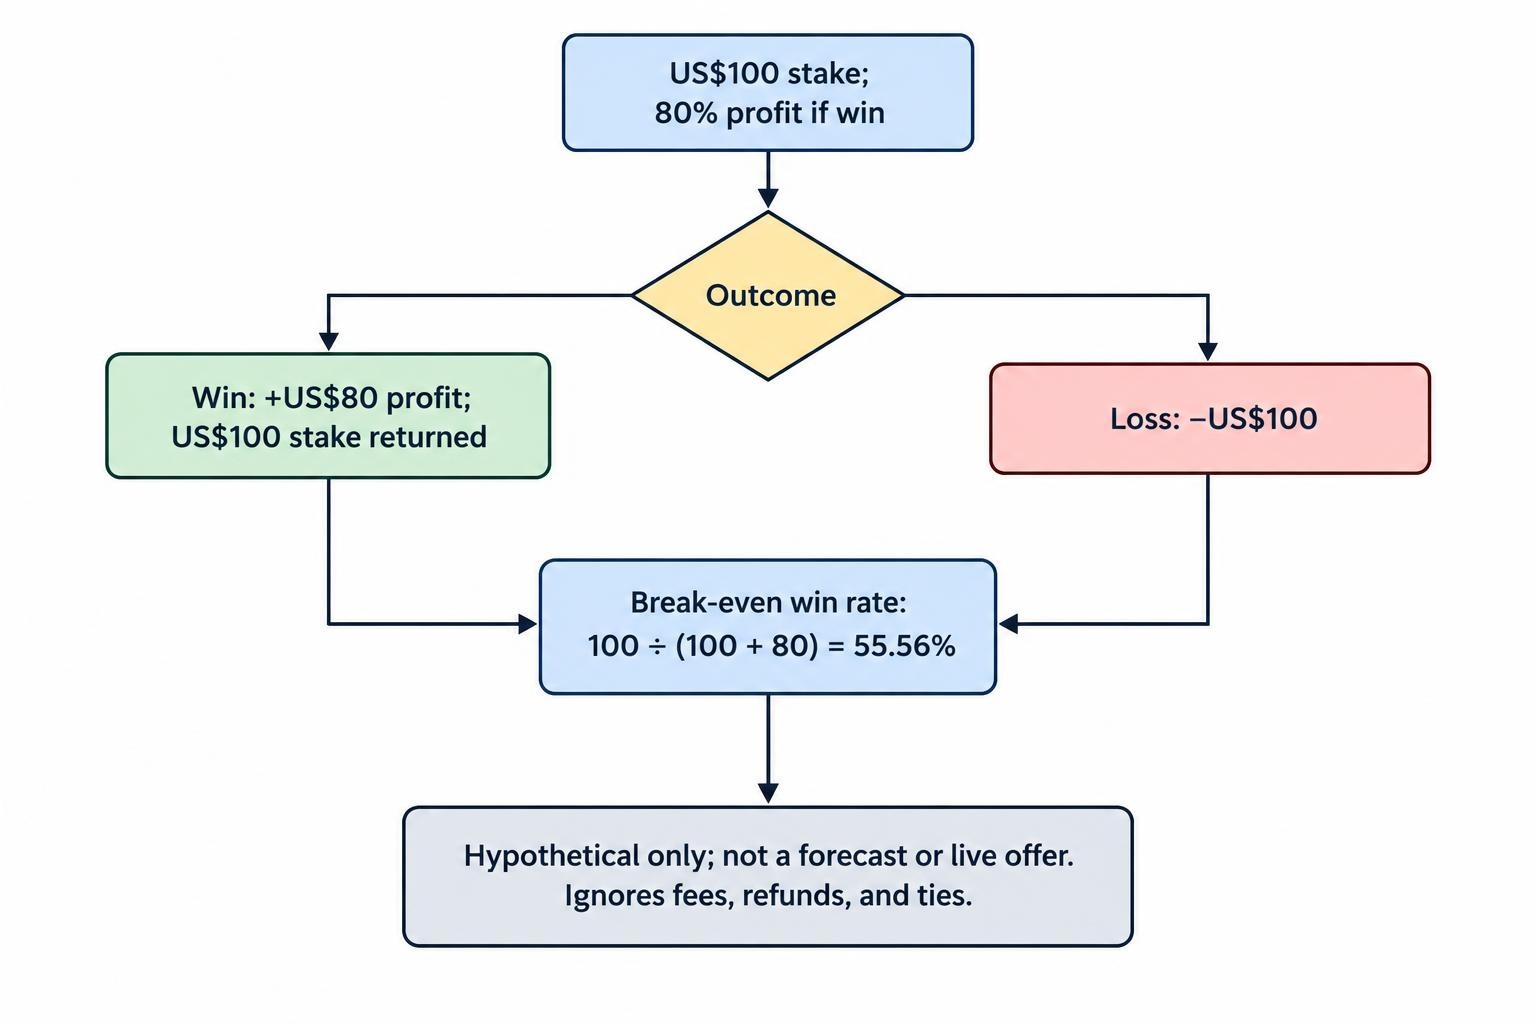
Assume a contract uses a US$100 stake, offers an 80% profit on a winning outcome and loses the full stake on a losing outcome. Its proposition is that the designated reference price will finish strictly above 6,000 at expiry. These figures are illustrative, not current market quotes or an available offer.
| Settlement reading | Contract result | Amount returned | Net result |
|---|---|---|---|
| 6,003.00 | Winning outcome | US$180 | US$80 profit |
| 5,999.75 | Losing outcome | US$0 | US$100 loss |
| Exactly 6,000.00 | Apply the stated equality rule | Depends on the terms | Depends on the terms |
The US$180 winning return includes the original US$100 stake. It is not US$180 of profit. Nor does finishing 20 points above the strike pay more than finishing 0.25 points above it under these assumed terms.
Suppose the reference price reaches 6,010 before expiry, then settles at 5,999.75. The contract still loses. The forecast caught an upward move, but the required condition failed at the required time.
Cash Index, Futures and Platform Quotes Are Different References
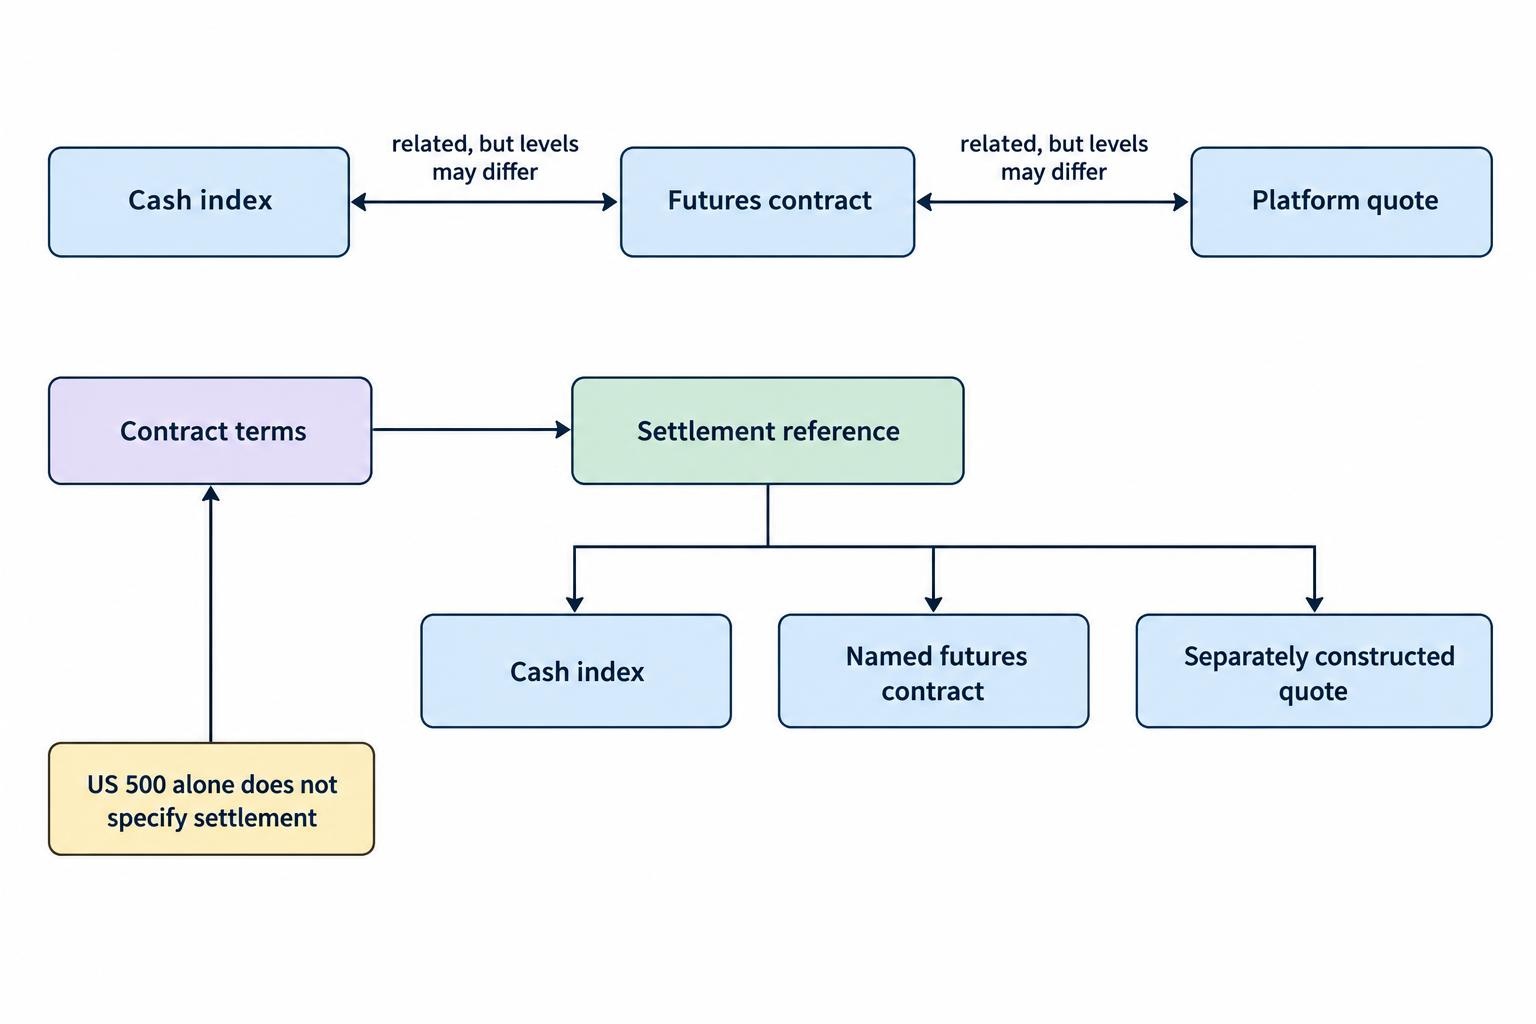
The S&P 500 cash index and an S&P 500 futures contract are related, but their levels need not match. Futures pricing reflects financing costs, expected dividends and time to maturity, alongside market supply and demand. Futures can also trade outside regular sharemarket hours. These relationships are covered in CME’s guide to stock index futures.
For a hypothetical comparison, the cash index might read 6,000 while a futures contract reads 6,008 at the same moment. That difference alone does not prove either feed is wrong. Comparing a cash index strike with a futures chart can produce a convincing analysis of the wrong price.
A label such as “US 500” does not, by itself, establish the settlement benchmark. The terms must identify whether the reference is the published cash index, a named futures contract or a separately constructed quote. The label is a signpost, not a contract specification.
This distinction also matters when reviewing charts. A continuous futures chart can join successive contract months into one series. Before treating a chart level as relevant to settlement, establish whether the displayed series matches the instrument and adjustment method named in the hypothetical contract.
The guide to cash index prices versus futures prices covers those differences in more detail. For S&P 500 analysis, the working rule is straightforward: use the settlement reference for the decision, and other instruments only as supporting context.
S&P 500 Market Hours for Australian Readers
The regular US sharemarket session provides a useful timing reference. The NYSE trading information page lists its core equity session as 9:30 am to 4:00 pm Eastern Time. That session is not a promise that every product using an S&P 500 label follows identical opening, closing or settlement rules.
For Sydney and Melbourne, the regular session converts to three common combinations:
- US daylight time and Australian standard time: 11:30 pm to 6:00 am.
- US daylight time and Australian daylight time: 12:30 am to 7:00 am.
- US standard time and Australian daylight time: 1:30 am to 8:00 am.
The Australian closing time falls on the following calendar day relative to the US session date. These conversions describe a normal full session; check holiday and early closing schedules separately.
Use named time zones in records rather than writing “market open” or relying on a platform clock. Australian and US daylight saving changes do not occur together. A saved reminder can therefore be an hour wrong even though nobody touched it.
For paper analysis, separate observations around the cash opening, middle of the session and closing period. Do not pool them automatically. A pattern recorded at one time of day still needs evidence before being applied at another.
News Events: Separate the Release from the Price Reaction
Inflation reports provide a clear scheduling example. The US Bureau of Labor Statistics CPI release calendar lists CPI publication at 8:30 am Eastern Time, one hour before the regular cash opening. A study of that release must therefore identify which live instrument it observes rather than treating the previous cash close as a fresh price.
For any event study, distinguish the published number, expectations before publication and the subsequent price path. A rule such as “lower inflation means an upward expiry” skips the part that needs testing: whether that interpretation produces the required settlement condition at the chosen strike and time.
Apply the same discipline to Federal Reserve announcements and earnings from heavily weighted constituents. Treat them as events requiring separate analysis, not automatic directional instructions. An earnings headline about one company is not a complete forecast for the index.
Consider a hypothetical announcement followed by an immediate rise, a sharp reversal and then a recovery. An upward contract could win or lose depending on its entry timestamp and expiry. “The market rose after the announcement” is too vague to establish a usable result.
When reviewing such episodes, preserve the whole sequence. Recording only the first move or the eventual session close leaves out the interval that may have determined settlement.
Expiry Selection Changes the Question
An S&P 500 outlook must match the contract horizon. A view about earnings over the coming quarter does not establish whether the next one minute reading will exceed a nearby strike. The subject is the same index, but the forecasting problem is different.
For an expiry based proposition, distinguish three questions: where the reference price is now, what might move it before settlement, and how far it must move to satisfy the condition. Direction alone leaves out distance and time.
Assume the reference price is 6,000. An above 6,000 proposition and an above 6,020 proposition do not have the same requirements, even if both are described as upward positions. A bullish forecast could satisfy the first and fail the second.
Shorter duration does not establish a better opportunity. It reduces the observation window, which makes accurate timestamps and a matching feed particularly important. A longer duration changes the window; it does not guarantee a more reliable forecast.
The binary options expiry times guide explains duration and expiry mechanics. In an S&P 500 paper study, keep the expiry rule fixed within each test rather than changing it after seeing which endpoint would have won.
The Payout Determines the Required Win Rate
Even correct forecasts can produce a loss when winning profits are smaller than losing stakes. Using the hypothetical 80% profit rate above, each US$100 winner earns US$80, while each loser costs US$100.
Ignoring fees, refunds and ties, the break even win rate is:
100 ÷ (100 + 80) = 55.56%.
Across 100 equal sized hypothetical contracts, 55 wins earn US$4,400 and 45 losses cost US$4,500, leaving a US$100 loss. At 56 wins and 44 losses, the net result is an US$80 profit. These are arithmetic illustrations, not performance forecasts.
A 50% win rate would lose US$1,000 under the same assumptions. Being right half the time is therefore not enough for this payout structure.
The calculation must use the profit rate actually assumed for each observation. Applying one attractive payout to every historical signal can distort the result. The guide to probability and expected value develops that relationship without confusing a chart signal with a profitable contract.
How to Study S&P 500 Setups Without Placing Binary Trades
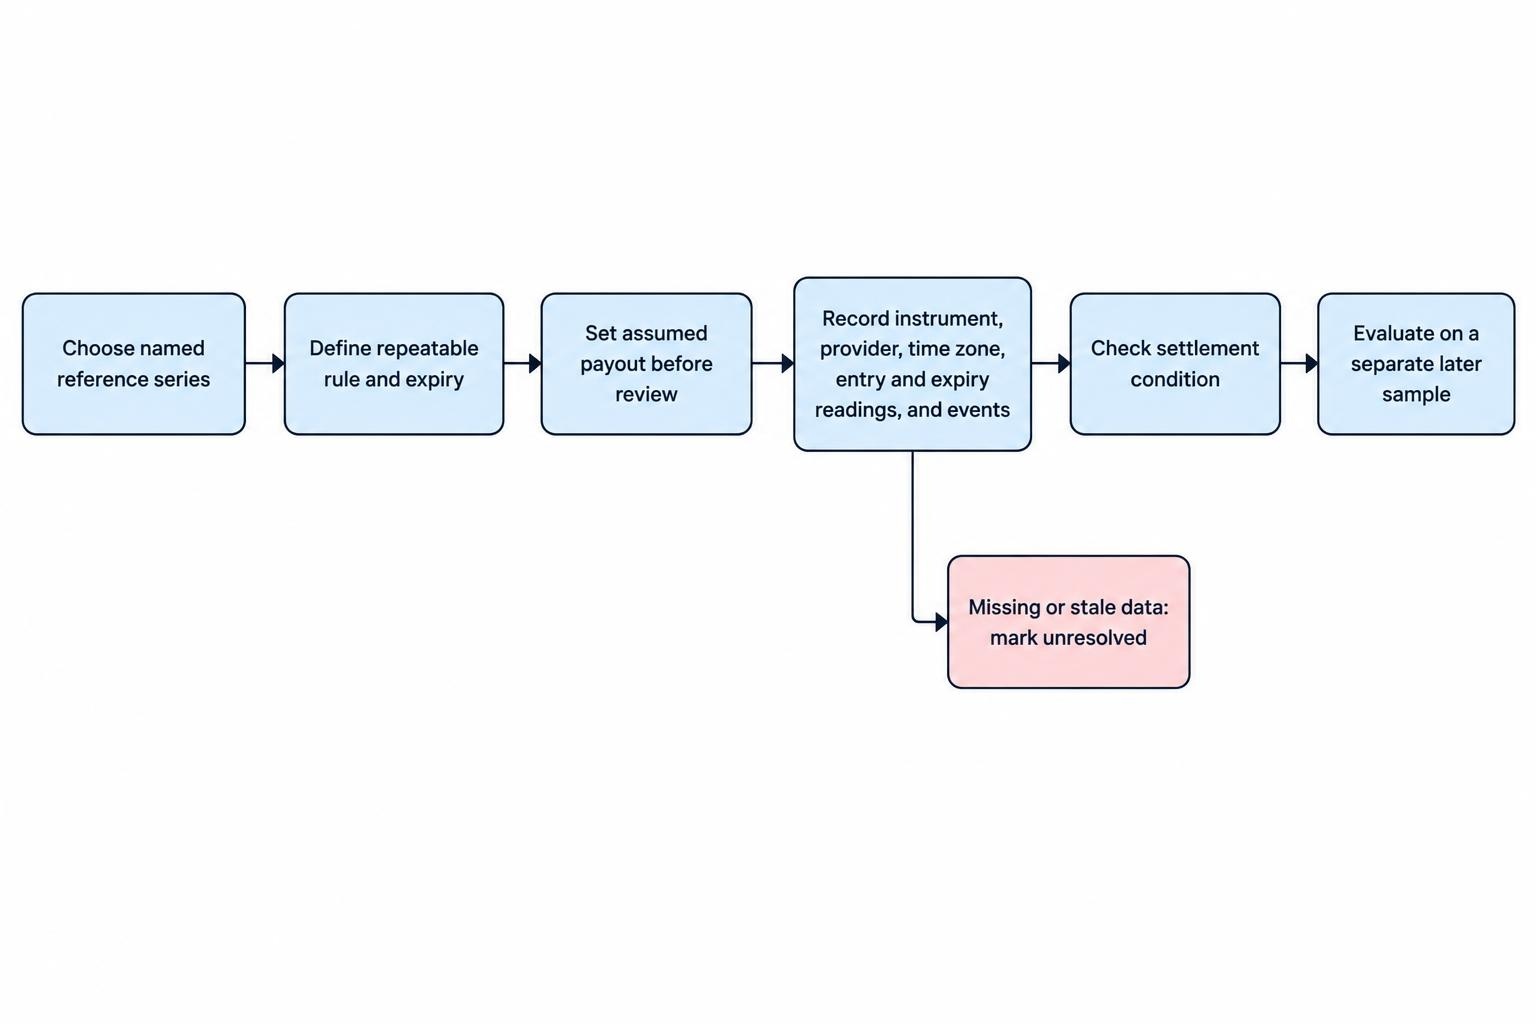
A paper study can assess a clearly stated proposition without funding a binary options account. Start with one named reference series and one repeatable rule. “Buy when the chart looks strong” cannot be audited; a timestamped condition can.
For example, define a hypothetical observation at a fixed interval after the regular cash opening. Record the reference level, apply a predetermined expiry and check the later reading against the original threshold. State the assumed payout before reviewing the outcome. Do not move the threshold to make a near miss look better.
Record the instrument, data provider, time zone, entry reading, expiry reading, assumed payout and any scheduled event. Mark missing or stale observations as unresolved rather than quietly removing them. A data gap is not a winning signal.
Keep the initial rule development sample separate from the later evaluation sample. If a rule is revised after examining losses, those revisions need a fresh evaluation. Otherwise, the exercise risks becoming an explanation of the past rather than a test of a usable proposition.
The binary options practice plan provides a structure for that process. Paper results still do not establish live execution quality, withdrawal reliability or lawful product availability.
The useful output is a documented answer to a narrow question: did this rule, on this S&P 500 reference series, satisfy this settlement condition often enough for the assumed payout? That is more informative than a collection of winning screenshots—and considerably harder to fake by accident.
This article was last updated on: October 22, 2026