Trading drawdown is the decline in an account’s value from a previous peak. It measures how far the account has fallen, not just whether the latest trade lost money. A strategy can finish a period in profit and still experience a large drawdown along the way.
For Australian readers, the regulatory position comes first: ASIC’s binary options product intervention order bans their issue and distribution to retail clients until 1 October 2031. The examples below explain risk measurement using hypothetical or paper trading records, not a route around that restriction.
Drawdown matters because losses change the arithmetic of recovery. They also expose weaknesses that a headline win rate can hide: oversized stakes, poor payouts, overlapping positions and results that depend on a short run of favourable outcomes.
What Trading Drawdown Measures
Drawdown starts with a running peak, sometimes called the account’s high water mark. Each new account value is compared with the highest value reached before it. For a performance record without deposits or withdrawals:
Drawdown amount = previous peak − current account value
Drawdown percentage = (drawdown amount ÷ previous peak) × 100
Suppose a paper account starts with A$1,000, rises to A$1,200, then falls to A$900. Its drawdown is A$300, or 25%. Its loss against the original starting balance is only A$100, or 10%. Both figures are correct, but they answer different questions. Drawdown measures the fall from the peak; net performance measures the change from the starting point.
Current drawdown, maximum drawdown and duration
Current drawdown describes the account’s position below its running peak now. Maximum drawdown is the largest peak to subsequent trough decline within the period being measured. Always state that period: a maximum calculated over one week is not directly comparable with one calculated over three years.
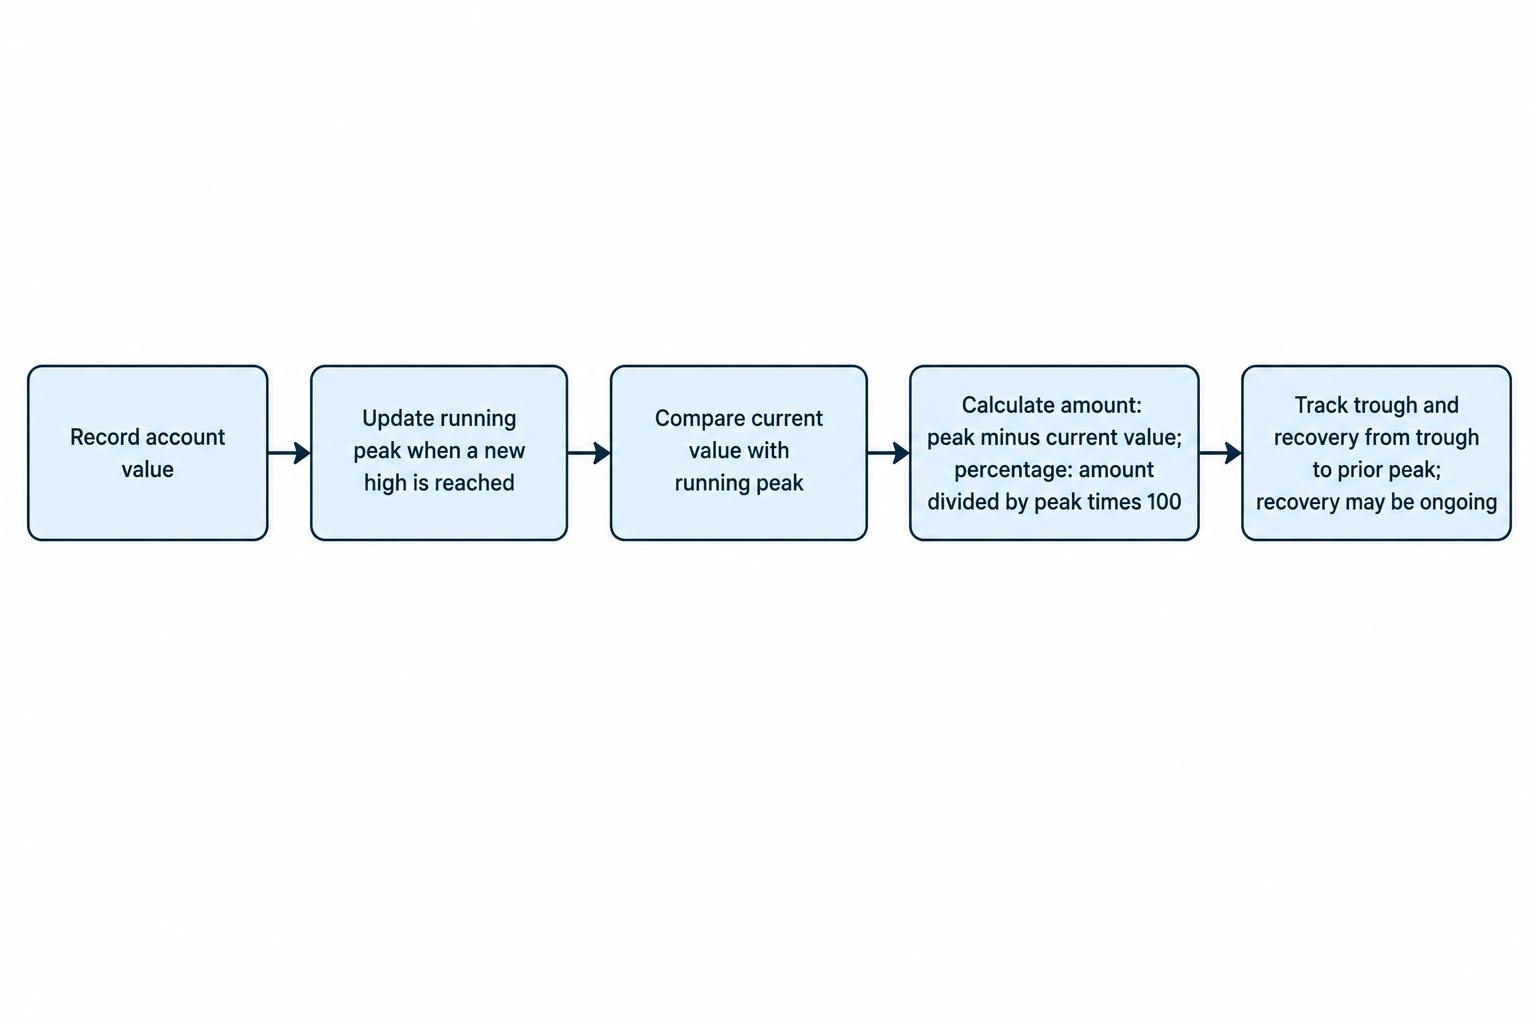
Duration adds another dimension. An account might fall only 5% but spend six months below its previous peak. Record the time from the peak to the trough, then the time taken to recover. If recovery has not happened, mark the episode as ongoing.
Drawdown does not require consecutive losses. Alternating wins and losses can still pull an account lower when the losses exceed the profits. The separate guide to losing streaks covers runs of unsuccessful trades; drawdown captures the account damage across the whole sequence.
Use the Right Account Value
A drawdown figure is only useful if the underlying account values are consistent. A settled balance record and an equity record can show different results, particularly when several contracts remain open.
Settled balance versus equity
A settled balance curve records completed results. An equity curve also reflects the value of open positions where reliable valuations are available. A record taken only after all contracts settle can miss a worse position reached during the session.
However, available cash is not automatically account equity. If a hypothetical A$1,000 account commits A$100 to an open contract, an available cash display of A$900 does not by itself prove a 10% drawdown. Part of the account has moved into the contract; its value must be considered.
Where dependable open contract valuations are unavailable, label the record as settled balance drawdown. Track the amount still at risk separately. Do not present a balance based calculation as though it captures every fluctuation in equity.
Separate deposits and withdrawals from performance
Adding money can make a raw balance chart appear to recover even though the trading losses remain. Withdrawing money can create an apparent decline despite no trading loss.
Keep external cash movements separate and use a cash flow adjusted performance series when comparing drawdowns across them. A unitised record, which tracks the value of account units rather than the raw cash balance, is one approach. A fresh deposit is not a comeback.
Why Recovery Requires a Larger Percentage Gain
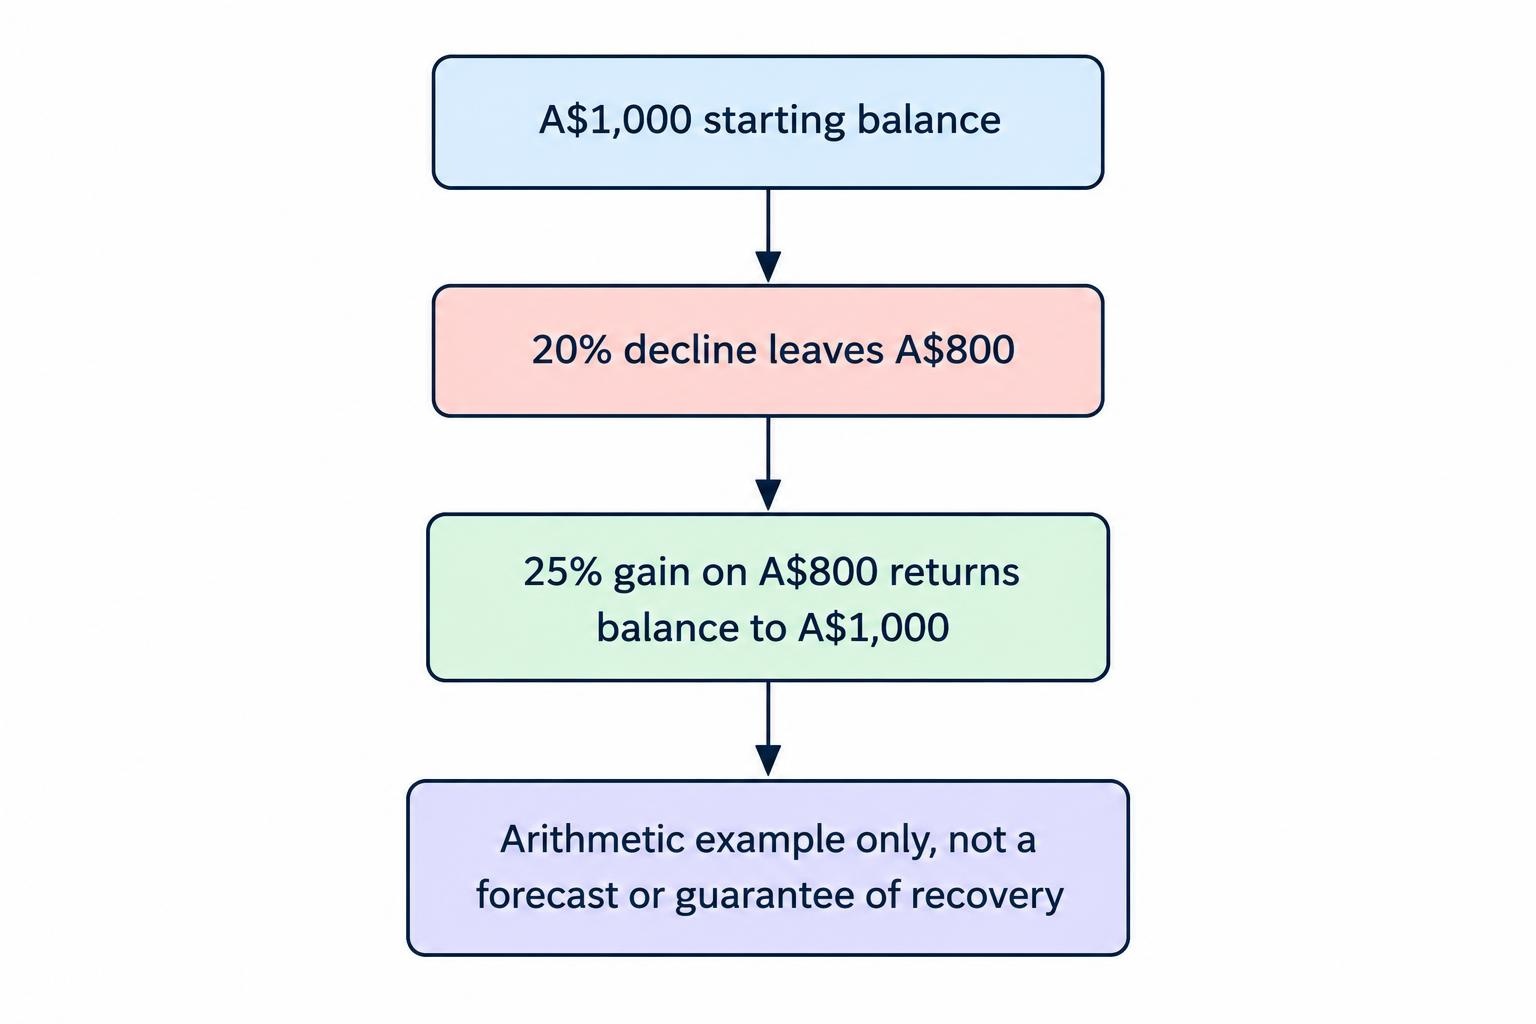
The percentage needed to recover a loss is larger than the percentage lost because the recovery starts from a smaller balance.
If A$1,000 falls to A$800, the loss is 20%. Getting back to A$1,000 requires A$200 of profit on the remaining A$800: a 25% gain.
| Drawdown | Balance remaining from A$1,000 | Gain needed to recover |
|---|---|---|
| 10% | A$900 | 11.11% |
| 20% | A$800 | 25% |
| 25% | A$750 | 33.33% |
| 40% | A$600 | 66.67% |
| 50% | A$500 | 100% |
| 75% | A$250 | 300% |
Recovery gain percentage = loss amount ÷ remaining balance × 100
These are arithmetic requirements, not forecasts. Nothing in the calculation says the account will recover, or how long recovery might take. A strategy without a positive expected return has no built in reason to return to its former peak.
This is why a recovery target should not dictate the next stake. “I need A$200 back” describes a past loss. It says nothing about the probability or value of the next contract.
How Binary Options Payouts Affect Drawdown
In a hypothetical fixed payout contract, assume a successful A$10 stake returns the original stake plus A$8 profit. A losing contract forfeits the A$10. There are no refunds, ties or additional charges in this example.
Across 100 trades with 55 wins and 45 losses, winning trades produce A$440 of profit while losing trades cost A$450. The account loses A$10 despite winning more often than it loses.
At an 80% net profit payout, the break even win rate is approximately 55.56% before other costs. The calculation is 1 ÷ 1.8. The guide to probability and expected value in binary options develops the relationship between payout, win probability and expected profit or loss.
The practical distinction is between a temporary decline within a profitable process and continued losses from an unprofitable one. A falling balance alone cannot tell you which applies. Neither can a handful of winning trades.
Record the payout offered on each paper trade rather than assuming it stays constant. A method that breaks even at one payout may lose money at another, even if its win rate does not change.
Stake Size Determines How Quickly Losses Accumulate
Drawdown depends on both trade outcomes and the amount exposed to each outcome. The same sequence of unsuccessful trades can produce very different account losses under different staking rules.
Consider ten consecutive losing paper trades, each risking a fixed percentage of the balance available before that trade. With no other account movements, the remaining balance is:
Starting balance × (1 − stake fraction)number of losses
Risking 1% of the remaining balance on each trade produces a drawdown of about 9.56% after ten losses. Risking 5% produces about 40.13%. These are illustrations, not suggested allocations or estimates of how likely the sequence is.
A fixed cash stake behaves differently. Ten A$50 losses reduce a A$1,000 account to A$500. The next A$50 stake would then risk 10% of the remaining account, compared with 5% at the start. Keeping the cash amount unchanged does not keep the risk percentage unchanged.
The dedicated stake sizing guide covers these methods in more detail. For drawdown analysis, the point is to record the sizing rule and apply it consistently when comparing results.
Smaller stakes reduce the account damage from a given sequence. They do not turn a negative expected return into a positive one. Increasing stakes to recover losses faster changes the exposure, not the quality of the next prediction.
Set Drawdown Limits Before Reviewing Results
A drawdown limit is a decision rule: it tells you when to pause a test, investigate the record or stop using a method. It is not a guarantee that losses cannot pass that level.
For paper testing, define the response before the test starts. Otherwise it becomes easy to move the threshold whenever the account approaches it. A rule that changes to accommodate every loss is not much of a rule.
As part of a wider binary options risk management plan, distinguish a warning level from a stop level. The warning prompts a review; the stop ends the test pending investigation. There is no universal percentage that makes binary options safe or suitable.
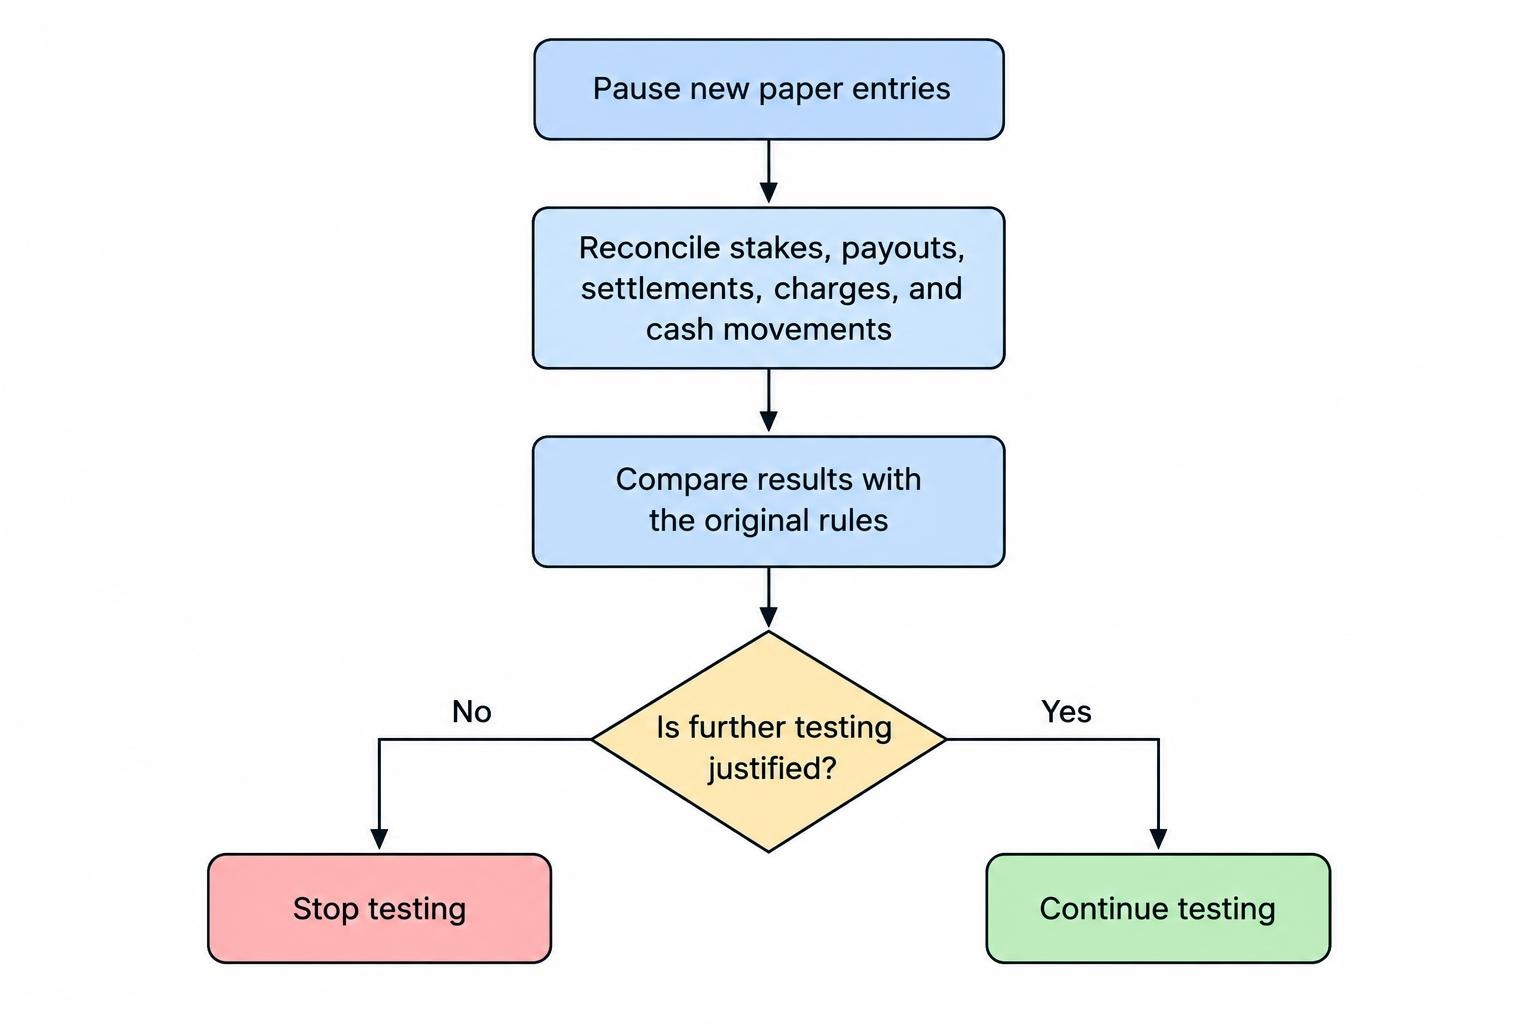
A useful review procedure has four steps:
- Pause new paper entries. Do not add exposure while trying to work out what went wrong.
- Reconcile the record. Check stakes, payouts, settlements, charges and external cash movements.
- Compare results with the original rules. Separate valid test trades from mistakes or discretionary additions.
- Decide whether further testing is justified. Do not assume resuming is the default outcome.
Include outstanding exposure in the decision. If several contracts remain open, their combined possible losses can carry the account beyond a threshold before any further entry occurs. A session stop also does not erase the cumulative drawdown when a new day begins.
Diagnose the Decline Before Changing the Method
A drawdown can reflect ordinary variation, an incorrect assumption, deteriorating payouts or departures from the test rules. Avoid assigning a cause from the shape of the balance chart alone.
Start by separating the record into comparable groups: the same entry rules, expiry conditions, market and payout range. Check whether the decline came from a broad deterioration or a small cluster of unusually large exposures.
Pay particular attention to correlation and trading risk. Several positions can depend on the same market move even when their asset names differ. Three simultaneous positions should not be treated as three independent chances simply because they occupy different rows in a journal.
Next, compare planned stakes with actual stakes. A method tested at small, consistent sizes cannot explain a drawdown caused by doubling positions after losses. Those are different processes and should have separate records.
Do not rewrite the method after every uncomfortable patch. Equally, do not dismiss every decline as bad luck. Small samples leave considerable uncertainty, and a past win rate is an estimate rather than a permanent property of a strategy.
A Historical Maximum Is Not a Future Loss Ceiling
A backtest showing an 8% maximum drawdown establishes what happened within that test, under its assumptions. It does not establish that future losses will stop at 8%.
Historical maximum drawdown depends on the sequence and length of the record. Research on drawdown based portfolio measures examines sensitivity to sample error and cautions against relying too heavily on drawdown measures. That research concerns portfolio allocation; it does not validate a binary options strategy.
When assessing a hypothetical binary options record, check whether it includes realistic payouts, consistent settlement assumptions and every qualifying trade. Removing inconvenient trades or adjusting entry rules after seeing their outcomes makes the resulting drawdown less useful.
Changing trade order in a simulation can illustrate how the same outcomes produce different drawdown paths. It does not capture every risk. Randomly rearranging individual trades can also break up clusters that existed in the original record, making the simulated losses look more manageable.
Keep results from development separate from later testing on untouched data. Report an ongoing drawdown even if the test ends before recovery. Stopping the chart does not close the loss episode.
Keep a Drawdown Record That Cannot Hide Losses
A useful record should make it possible to reconstruct both the account path and the decisions made during the decline. A single “maximum drawdown” number is not enough.
Use a trading journal to record the running peak, current settled balance, outstanding exposure and current drawdown. For each drawdown episode, keep the peak date, trough date, largest percentage decline, recovery date if reached, and any changes to the method.
Record cash drawdown and percentage drawdown together. Include all trading results and relevant charges, but keep deposits and withdrawals identifiable. If the rules or stake sizes change, mark the change rather than presenting the entire history as one unchanged method.
Finally, distinguish trading losses from problems accessing money. The SEC’s binary options fraud warning documents complaints involving refused withdrawals and alleged software manipulation. Those are not ordinary drawdowns to solve with a revised entry signal.
Drawdown is most useful as a reason to inspect risk, not a target to recover at any cost. Measure it consistently, keep the cash movements honest and allow the review to end with “stop”. The previous account peak creates no obligation to place another trade.
This article was last updated on: October 22, 2026