Technical analysis for binary options uses price history, chart structure and indicators to form a testable view about a contract’s outcome. Its purpose is not to find a chart that looks bullish or bearish. It is to assess whether a defined price condition is likely to hold at the contract’s expiry, at a payout that justifies the risk.
Australian retail context: ASIC’s prohibition on issuing and distributing binary options to retail clients remains in force until 1 October 2031. Before the ban, ASIC found that 74–77% of active retail clients lost money during the period it examined. The ASIC announcement extending the binary options ban sets out the restrictions and findings. The examples below are educational paper exercises, not instructions to bypass those restrictions.
Analyse the settlement condition, not just the direction
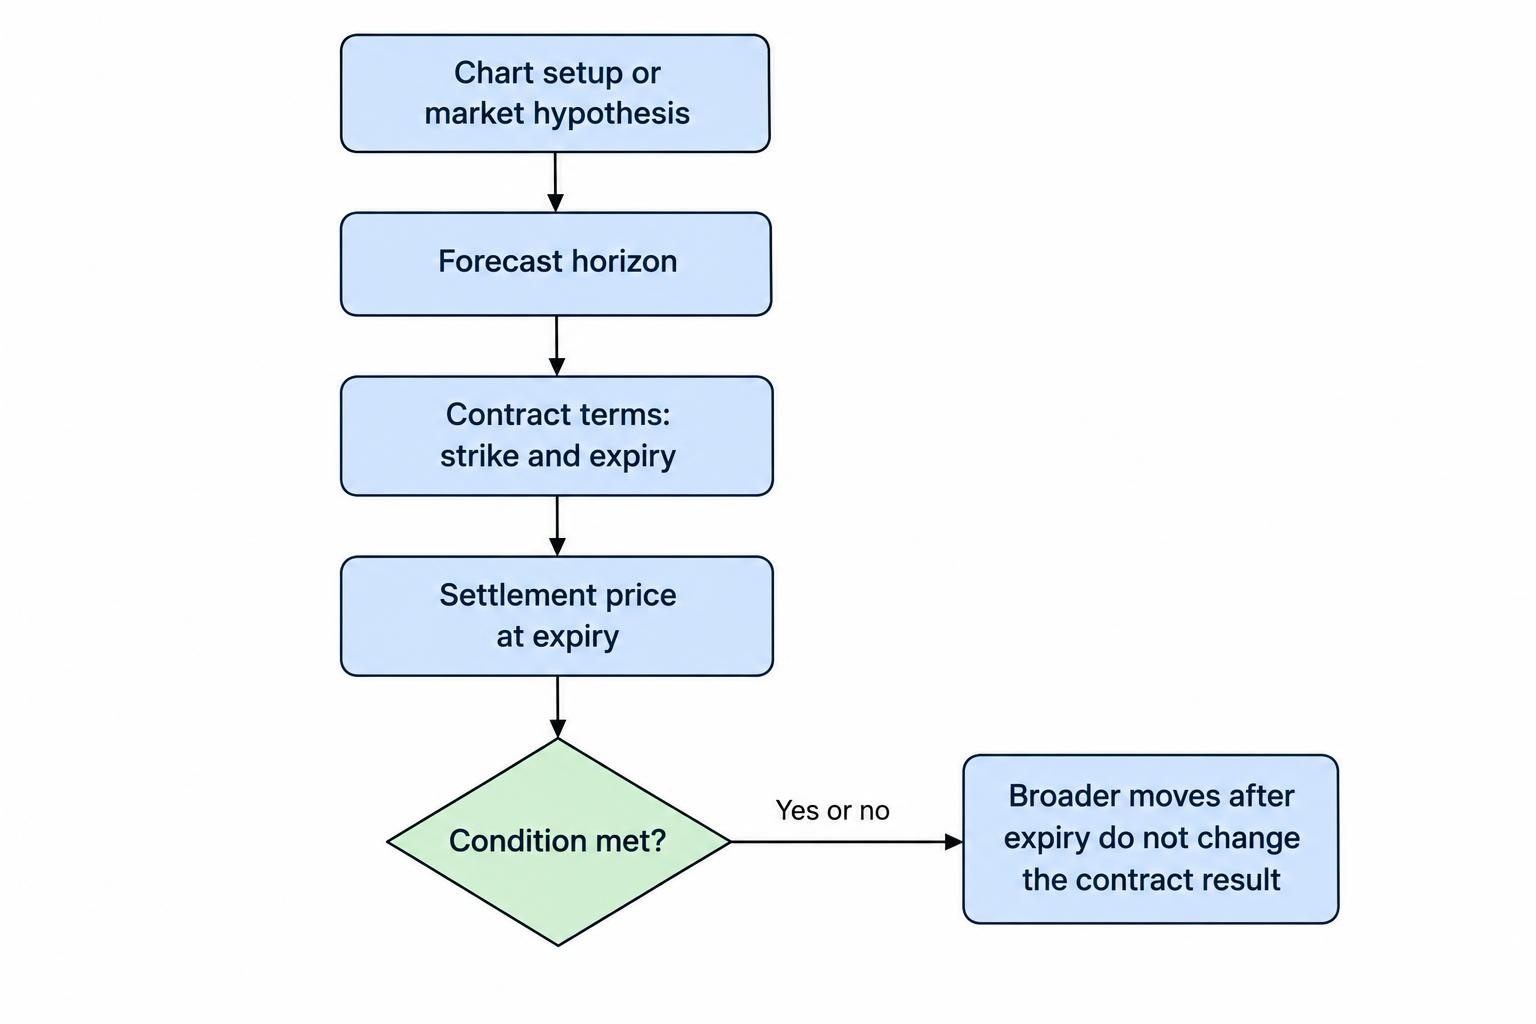
For a conventional higher or lower binary option, the relevant question is whether the settlement price finishes above or below the strike. A correct view about the broader trend does not necessarily produce a winning contract.
Suppose AUD/USD is rising on a fifteen minute chart. A hypothetical higher contract has a strike of 0.66000 and expires five minutes later. The pair could fall to 0.65998 at expiry, then reach 0.66100 shortly afterwards. The broader bullish view may have been reasonable; the contract still loses under terms requiring settlement strictly above the strike.
This distinction changes how technical analysis should be evaluated. A chart pattern needs a defined starting point, forecast horizon and outcome. “Price eventually moved higher” is not a useful success criterion for an instrument with a fixed deadline.
Keep three questions separate: what market behaviour does the setup describe, when should that behaviour occur, and what does the contract actually pay for? A trend continuation signal might be relevant to a directional contract. It does not automatically answer whether price will touch a distant barrier or remain inside a range.
Start with market structure
Before adding indicators, identify whether the chart shows a trend, a range or an unsettled transition between the two. Higher swing highs and higher swing lows describe an upward structure. Repeated rejection near similar upper and lower areas describes a range. Neither description guarantees what happens next, but each gives the analysis a coherent starting point.
Mark obvious prior turning areas before viewing the outcome you want to explain. Treat them as zones rather than perfectly precise lines. A market can trade through a previous high briefly without establishing a sustained move beyond it. The separate guide to support and resistance covers how to define and assess these areas.
The location of a signal matters. A bullish candle near the lower edge of an established range presents a different hypothesis from the same candle near the upper edge. In the middle, there may be no useful nearby reference point at all.
There is research behind some technical relationships, but its scope needs care. A New York Fed study of intraday foreign exchange support and resistance, using observations from 1996–1998, found that published levels predicted interruptions in trends better than arbitrary levels. That is evidence about historical currency behaviour, not proof of a profitable binary options strategy or a reliable expiry rule.
Give each indicator a job
Indicators turn price observations into measurements. They can make a rule easier to repeat, but they do not create independent evidence simply because they appear in separate panels. A moving average, MACD and RSI may all respond to the same recent price advance.
| Tool | Useful analytical role | Common mistake |
|---|---|---|
| Moving averages | Summarise trend direction and price position relative to recent history | Treating every crossover as a timely entry signal |
| RSI and MACD | Describe aspects of recent price momentum | Assuming an extreme reading guarantees an immediate reversal |
| ATR and Bollinger Bands | Describe recent price movement or dispersion | Reading a volatility measurement as a directional forecast |
| Candlestick patterns | Describe the relationship between a bar’s open, high, low and close | Ignoring location, timing and the surrounding price structure |
Trend measurements
A moving average can provide a repeatable trend filter. A research rule might require price to sit above an upward sloping average before considering a bullish setup. That is clearer than deciding that the chart “looks strong”.
The trade off is delay: an average uses observations that have already occurred. Shortening its period makes it more responsive, but also changes how readily it follows short fluctuations. There is no universally correct period for binary options. The moving averages guide examines those choices without treating a crossover as a complete strategy.
Momentum measurements
RSI can help distinguish strong recent buying from weaker price movement, but an overbought reading is not a countdown to a fall. A strong trend can continue while the indicator remains elevated. MACD also needs context: a change in its reading does not establish that price will cross the contract’s strike before expiry.
A useful indicator rule states exactly what observation qualifies and what question it answers. “Momentum has weakened” and “the next five minute settlement will be lower” are different claims.
Volatility measurements
ATR measures recent true ranges; it does not indicate which direction the next move will take. Bollinger Bands describe price relative to an average and a dispersion measure. Touching a band alone does not establish either a reversal or continuation.
Use these measurements to classify conditions for testing. A setup may behave differently during compressed movement and during wide, erratic bars. Adding three more indicators will not resolve an unclear hypothesis. Five versions of the same observation are still one observation, just with a committee.
Match the chart horizon to expiry
The chart interval and contract duration are separate settings. A one minute candle compresses one minute of price observations. It does not imply that a contract should expire after one minute, three candles or any other convenient multiple.
Start with the behaviour being tested. A reaction to a nearby turning area may develop over a different horizon from a continuation after a prolonged consolidation. The expiry must belong to the research question rather than be added after a favourable chart appears.
A higher chart interval can provide context, while a shorter interval defines the signal. That arrangement is useful only if the rules identify which observations are available at the decision time. Using the eventual close of an unfinished fifteen minute candle to justify an earlier entry introduces information that was not yet known.
Fixed clock expiries also differ from contracts that run for a stated duration after acceptance. A five minute clock expiry may leave far less than five minutes if the decision occurs near its deadline. The guide to binary options expiry times separates those mechanics.
Longer expiry is not automatically safer or more accurate. It changes the forecast horizon and allows more events to occur before settlement. Each horizon needs its own evidence.
Apply the payout hurdle
A technical setup can win more often than it loses and still produce a negative result. The necessary win rate depends on the amount gained when correct compared with the amount lost when wrong.
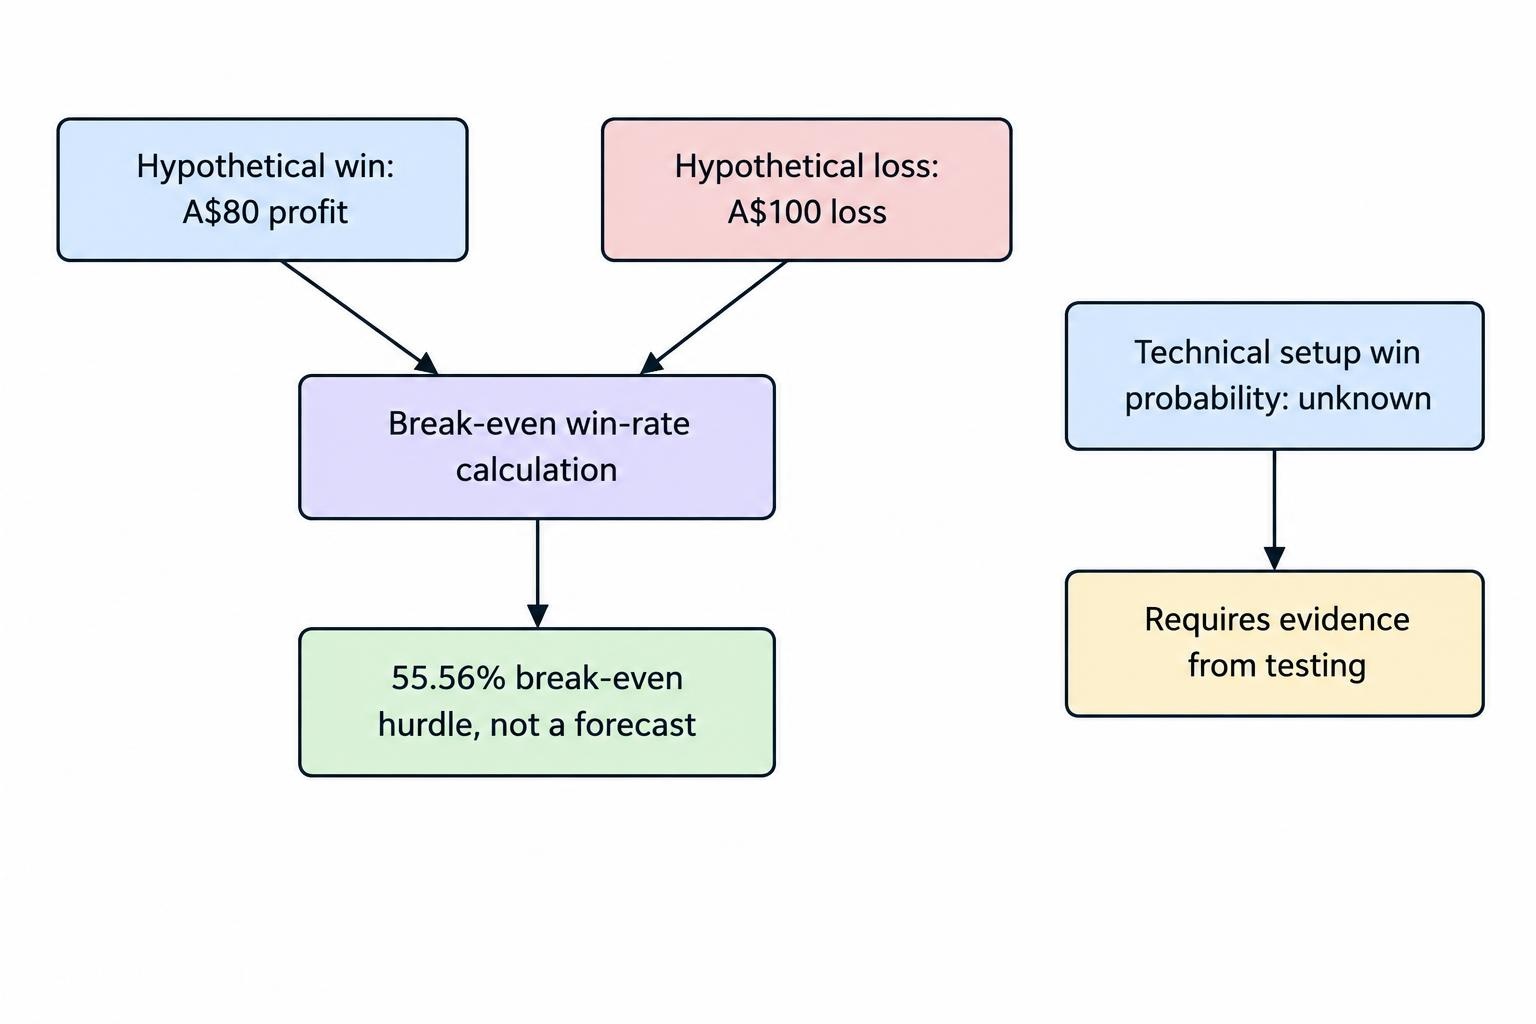
Assume a hypothetical contract risks A$100, earns A$80 net profit on a win and loses the full A$100 on a loss. The winning credit is A$180, including the returned stake. With no fees, refunds or ties, the break even win rate is:
Break even win rate = 100 ÷ (100 + 80) = 55.56%
That calculation does not estimate the setup’s probability of winning. It establishes the hurdle the setup must clear. A strong looking candle cannot supply the missing probability estimate.
Consider a hypothetical record of 57 wins and 43 losses at that payout. At A$100 per observation, the result would be A$260 profit before other costs. Reduce the profit on each win to A$70, with the same outcomes, and the result becomes a A$310 loss.
The guide to probability and expected value develops the arithmetic further. For technical research, the practical implication is simple: record the payout available at the decision time, not just whether the chart signal was correct.
A worked paper analysis
Consider a fictional AUD/USD chart with an upward structure on the fifteen minute interval. On the one minute chart, price pulls back into a previously marked support zone, then closes above the preceding candle’s high. This creates a possible continuation hypothesis. It does not establish a profitable signal.
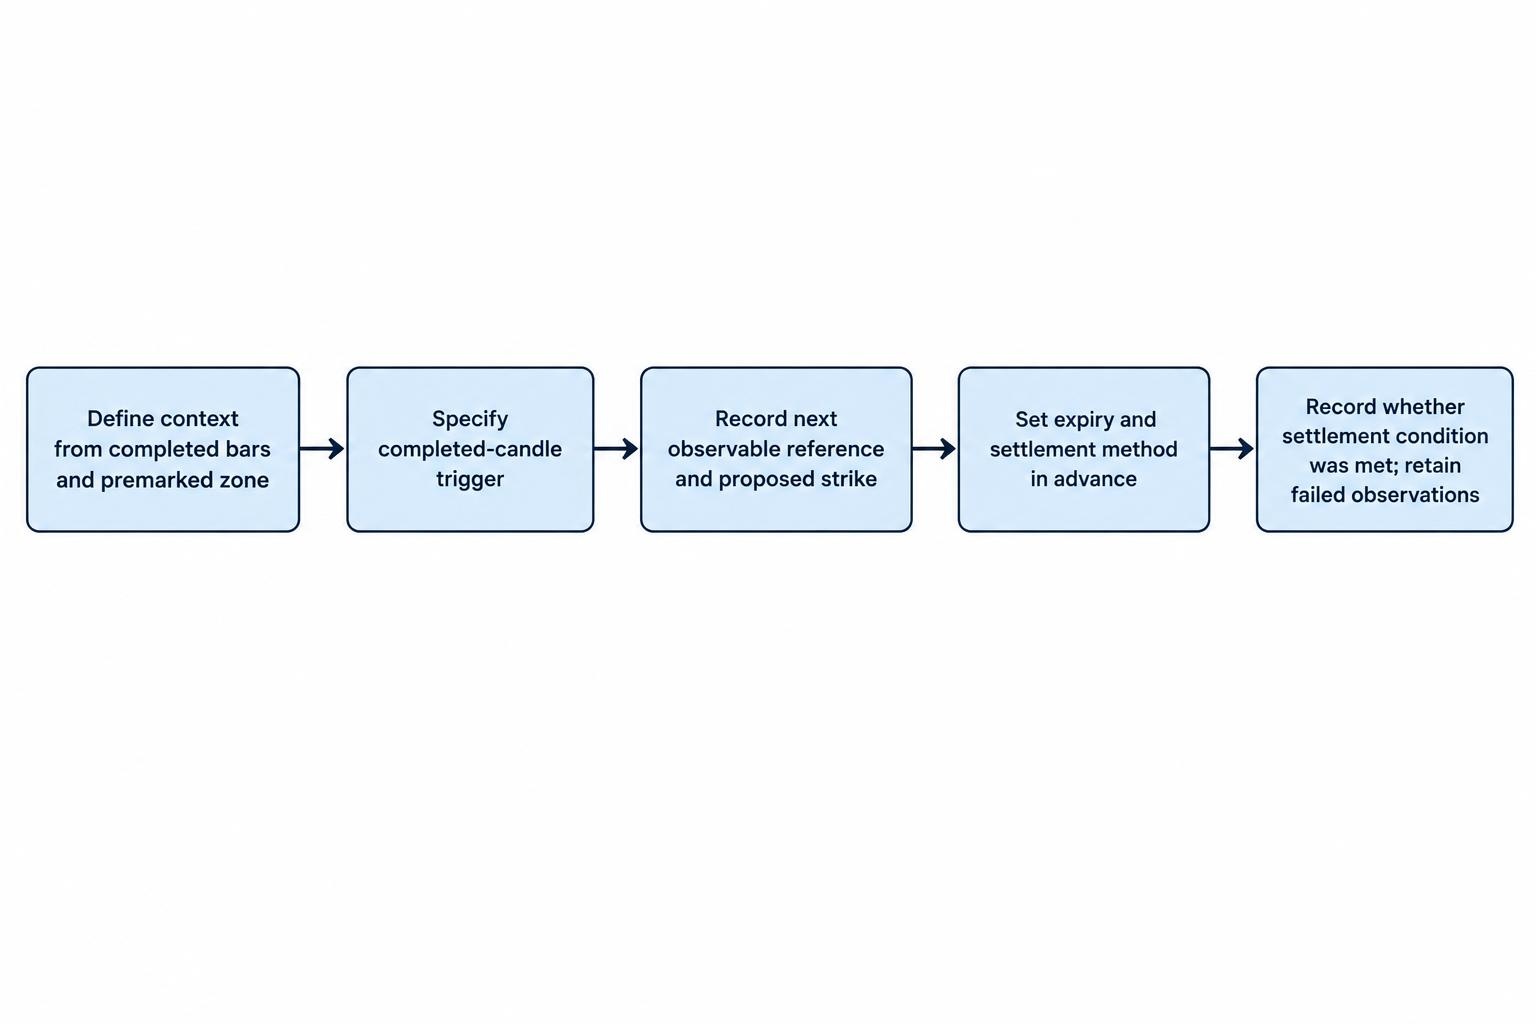
A reproducible paper exercise needs rules written before the next price observations arrive:
- Context: Define the upward structure using completed bars and mark the support zone in advance.
- Trigger: Require a completed one minute candle to meet a stated condition, rather than selecting an attractive candle afterwards.
- Reference point: Record the next observable entry reference and the proposed strike, allowing for any assumed delay.
- Outcome: Record the price at the predetermined expiry using the designated settlement method.
Suppose the trigger candle closes at 10:00 and the recorded reference immediately afterwards is 0.66000. The exercise tests whether the settlement observation at 10:05 is strictly higher. A move to 0.66040 at 10:03 does not count as success if settlement is 0.65998.
Equally, a small finish at 0.66001 could qualify as a win under those hypothetical terms, despite an unimpressive looking price path. The contract condition, not the visual drama, determines the result.
Record failed setups too. If price breaks below the support zone before settlement, that is useful diagnostic evidence, but it does not permit the researcher to erase the observation. If such a break should invalidate future signals, write that rule into a new version and test it separately.
Keep chart data and settlement data separate
A technical chart is only useful for contract research if its relationship to settlement is clear. Establish which instrument it represents, which price series it displays, how timestamps work and what observation determines the outcome.
An index cash value is not interchangeable with an index futures price. A bid, ask and midpoint are not the same observation either. Near the strike, a small difference can reverse the recorded result. The guide to price feeds and benchmarks addresses those distinctions.
Candle data can also be too coarse. A five minute bar’s high and low reveal the extremes within that interval, not the complete sequence of prices. Even a bar close may be unsuitable if its timestamp or construction differs from the settlement rule. Do not manufacture a precise expiry result from data that cannot establish it.
There is a separate platform integrity risk. Complaints described in the SEC investor warning on binary options fraud include allegations of software manipulation affecting prices, payouts and expiry countdowns. These are reported allegations, not a claim about every platform. Better chart analysis cannot compensate for an untrustworthy settlement process.
Test the rule, not the screenshot
A screenshot can illustrate a setup. It cannot establish how often the setup occurs, how frequently it fails or whether the available payout compensates for those failures.
Begin with one written hypothesis and a chronological record. Specify the market, session, chart interval, signal, expiry, price reference and treatment of ties. Define exclusions in advance, including any scheduled news window. “Avoid messy conditions” needs an observable definition or it becomes permission to remove losing examples.
The process in backtesting binary options strategies covers historical evaluation in more detail. At this stage, the aim is to check whether the technical rule can be applied consistently without seeing the future.
Prevent information from leaking backwards
Use only information available at the decision time. A candle’s eventual closing price, a later confirmed swing point or a signal that changes retrospectively can make a historical chart look cleaner than the original decision would have been.
Keep an untouched later period for evaluation, then observe the rule prospectively on paper. This helps separate rule development from assessment, but it does not remove every research problem. Repeatedly checking the evaluation period and adjusting the rule turns that period into development data too.
Track the experiments, including the failures
Trying many indicator settings increases the chance of finding an attractive historical result by accident. The research paper The Probability of Backtest Overfitting examines how strategy selection can favour strong historical performance that fails outside the development sample. Its findings concern investment backtests generally; they do not validate a binary options setup.
Keep a record of rejected versions, not just the final winner. Changing the moving average period, session filter, candle pattern and expiry creates multiple experiments, even if the chart still looks broadly similar.
Review results by market condition and trading session, while resisting the urge to create ever smaller winning categories. Separate overlapping observations where appropriate: ten signals generated by the same price surge are not ten clearly independent pieces of evidence.
A record of 57 wins from 100 observations does not establish that the true win probability exceeds the 55.56% hurdle in the earlier example. Sampling uncertainty, changing conditions and payout variation remain. A useful test can reject a weak idea without proving that its replacement will work.
Know when there is no usable signal
Technical analysis should allow a clear “no setup” result. Conflicting structure, an unfinished trigger candle, uncertain settlement data or an expiry that does not match the hypothesis are reasons to leave an observation unclassified rather than force a direction.
A news filter also needs discipline. If a scheduled release falls inside the proposed observation window, decide beforehand whether the research includes or excludes that situation. Do not call news irrelevant after a win and an unfair interruption after a loss.
Changing the stake does not improve a signal’s forecasting ability. Nor does extending an expiry after an unfavourable move validate the original timing rule. Those changes create different decisions and need separate evaluation.
Within a broader binary options strategy framework, technical analysis has a narrow but useful role: describe observable conditions, define a forecast and make that forecast testable. It cannot remove an unfavourable payout, guarantee honest settlement or turn a historical pattern into certainty. The standard is not a persuasive chart. It is a repeatable rule with evidence that survives scrutiny.
This article was last updated on: October 22, 2026