Candlestick patterns describe relationships between opening, closing, highest and lowest prices over one or more chart periods. Traders use formations such as hammers, engulfing candles and morning stars to frame possible reversals or pauses in a trend. They describe what price has done; they do not establish what it must do next.
For binary options, that distinction matters. A bullish pattern can precede a rising market yet still produce a losing higher contract if the settlement price finishes below the accepted strike. Direction, entry price and expiry must all line up.
Australian retail restriction: ASIC’s prohibition on issuing and distributing binary options to retail clients took effect on 3 May 2021 and extends until 1 October 2031. The ASIC announcement extending the binary options ban sets out the restriction. The examples below are for chart study and simulated analysis, not a recommendation to trade these products.
How to Read a Candlestick
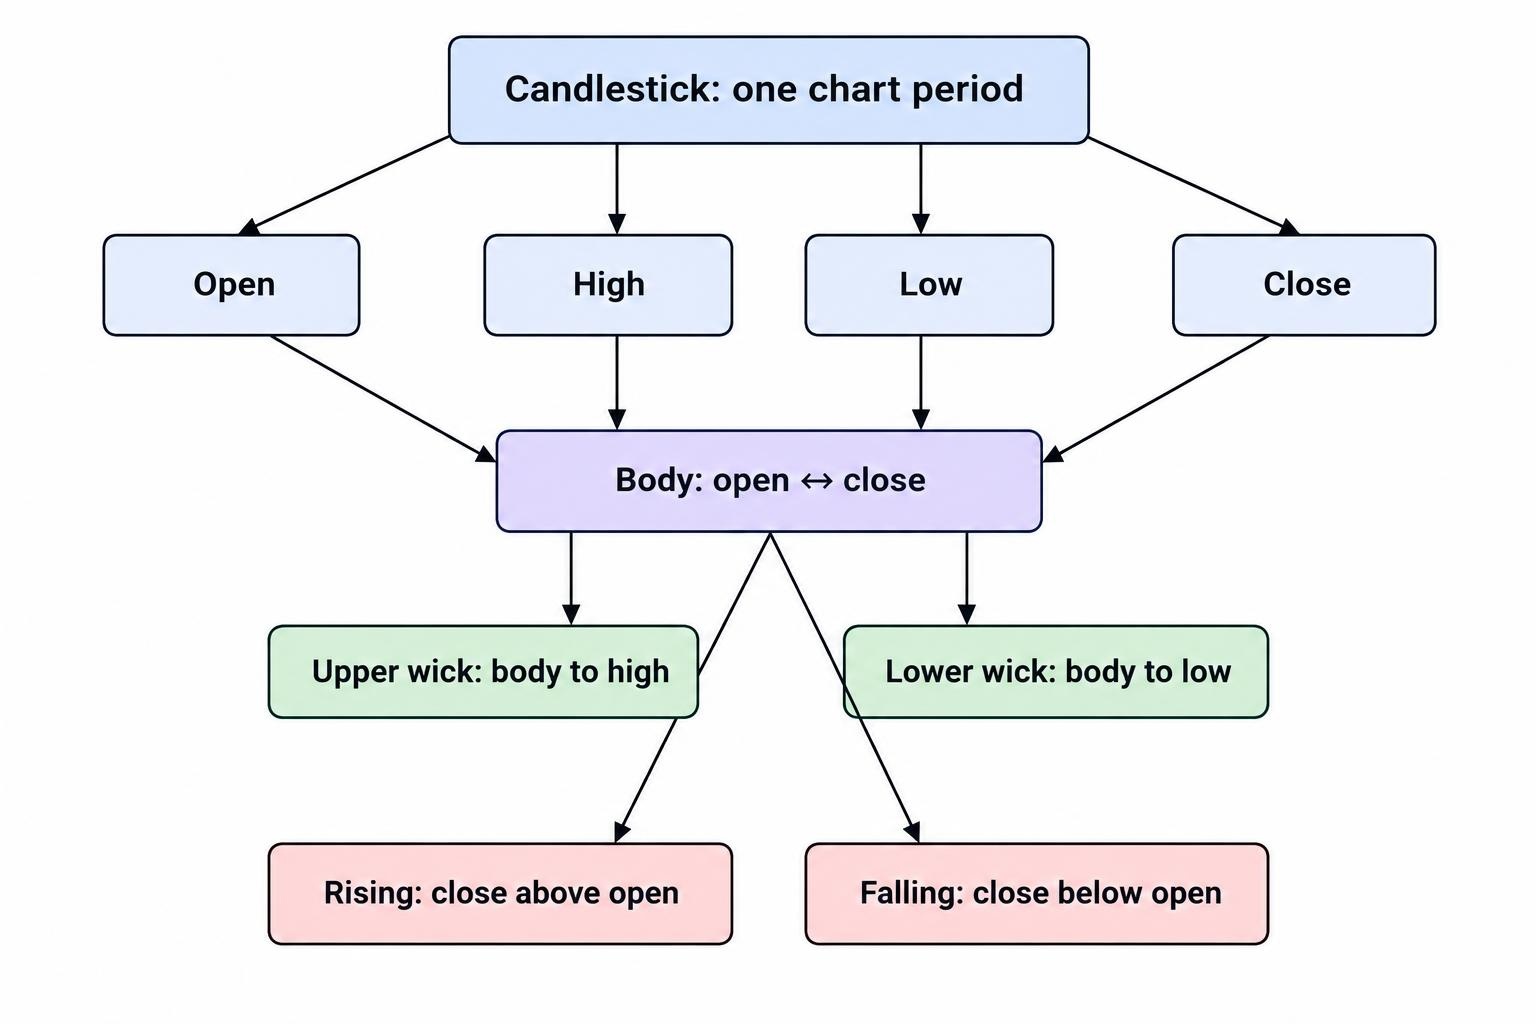
A standard candlestick records four prices for its chart period: open, high, low and close, commonly shortened to OHLC. On a five minute chart, each completed candle summarizes one five minute interval.
The body spans the opening and closing prices. The upper wick extends to the highest recorded price, and the lower wick extends to the lowest. Green commonly means the close exceeded the open; red commonly means the close fell below it. Colours depend on chart settings. The CME Group explanation of candlestick charts illustrates these components.
Body size measures the distance between open and close, not the entire movement during the interval. A small body with long wicks can represent a wide trading range that ended close to where it began. It should not be mistaken for an inactive market.
Read the closing position within the range too. A close near the high differs from a close near the low, even when both candles have the same colour. However, OHLC data does not reveal the full sequence of transactions. Two candles with identical prices can have different paths between their opening and closing points.
Common Candlestick Patterns
Pattern definitions vary slightly between charting tools. The following descriptions provide a working reference, not a ranking of predictive accuracy.
| Pattern | Structure | Conventional interpretation |
|---|---|---|
| Hammer | Small body near the high, long lower wick, little upper wick | Possible bullish reversal after a decline |
| Shooting star | Small body near the low, long upper wick, little lower wick | Possible bearish reversal after an advance |
| Bullish engulfing | A rising candle’s body covers the previous falling candle’s body | Possible bullish reversal after a decline |
| Bearish engulfing | A falling candle’s body covers the previous rising candle’s body | Possible bearish reversal after an advance |
| Doji | Opening and closing prices are equal or very close | Little net movement; direction remains unresolved |
| Morning star | Falling candle, small lower body, then a rising candle closing well into the first body | Possible bullish reversal |
| Evening star | Rising candle, small higher body, then a falling candle closing well into the first body | Possible bearish reversal |
Hammer and Shooting Star
A hammer forms after a decline. Its lower wick shows that price traded below the opening and closing area before finishing back near the upper end of the range. A common recognition rule requires the lower wick to measure at least twice the body, although exact thresholds differ.
The pattern’s location is part of its definition. A similar shape after an advance is conventionally called a hanging man, not a bullish hammer. The outline alone does not establish the interpretation.
A shooting star reverses the arrangement: a small body sits near the bottom of the range beneath a long upper wick. After an advance, it identifies an interval in which higher prices did not hold through the close.
Compare either formation with a previously marked price area. A hammer at an established floor presents a different research question from one in the middle of a choppy range. Mark support and resistance zones before looking for candles, rather than drawing a convenient level around every attractive shape.
Bullish and Bearish Engulfing Patterns
A bullish engulfing pattern consists of a falling candle followed by a rising candle whose body covers the first body. The second candle’s opening and closing prices define that coverage; its wicks do not have to contain the entire previous range.
A bearish engulfing pattern reverses the sequence. A falling body covers the preceding rising body after an advance.
This differs from an outside bar, where the second candle’s high exceeds the previous high and its low falls below the previous low. A candle can satisfy both descriptions, but the terms are not interchangeable.
For testing, decide whether matching body boundaries count as engulfing or whether the second body must extend beyond both edges. Also define the preceding trend. Without those rules, two reviewers can label the same chart differently, leaving the results difficult to reproduce.
Doji and Spinning Tops
A doji has little or no distance between open and close. A spinning top has a small visible body with wicks on both sides. Neither formation, by itself, provides a direction forecast.
After a strong advance, a doji may prompt a question about whether upward progress is slowing. Inside an established range, the same shape may add little. Its meaning depends on the surrounding price action.
Doji classification is also sensitive to small price differences. Check the instrument, timestamps and quote basis when comparing charts. The guide to price feeds and benchmarks covers why a chart used for analysis may not match a contract’s settlement reference exactly.
Morning Star and Evening Star
A morning star is a three candle reversal formation after a decline. A substantial falling candle comes first, followed by a small body at a lower level. The third candle rises and closes well into the first candle’s body, conventionally beyond its midpoint.
An evening star is the bearish counterpart after an advance: a substantial rising candle, a small higher body, then a falling candle closing well into the first body.
Classical descriptions include a gap separating the middle body from the first. Some intraday recognition systems relax gap requirements. Record which definition you use; a modified intraday pattern is not automatically equivalent to the classical formation.
Both patterns require three completed candles. On a five minute chart, that means observing 15 minutes of price history before the formation exists. Entering during the third candle tests an unfinished setup, not the completed pattern.
Read the Context Before the Shape
Start with the preceding movement. A reversal pattern needs something to reverse. Identify whether price has advanced, declined or moved sideways, using a rule that can be applied without seeing what happens next.
Next, assess location. A bullish formation immediately beneath a previously identified ceiling faces a different price structure from one forming above a reclaimed level. The candle should be assessed within that structure, not allowed to erase it.
Compare its size with recent candles as well. A body that looks large on a quiet chart may be ordinary during a more volatile session. ATR and volatility analysis can provide a consistent way to express relative size without assuming that a larger candle predicts a better outcome.
Confirmation must also be defined in advance. It might mean a later close above a hammer’s high or below an engulfing pattern’s low. Waiting changes the entry price and the time remaining before expiry. It may help a tested rule, or it may remove the price advantage the original signal appeared to offer.
Why Candlestick Timeframes Do Not Determine Binary Expiry
A five minute candle and a five minute contract measure different things. The candle summarizes a chart interval. The contract measures an outcome between its accepted entry conditions and its settlement time.
A pattern completed at 11:10 does not establish whether price will finish above a strike at 11:11, 11:15 or 11:30. Those are separate forecasting questions. Even a subsequent upward move can contain temporary declines that determine a short contract’s result.
Distinguish fixed clock expiries from durations measured after acceptance. Entering at 11:10:20 for an 11:15:00 expiry leaves four minutes and 40 seconds, not five minutes. The guide to binary options expiry times covers these timing differences.
There is no universal rule that a two candle pattern requires a two candle expiry. Treat each horizon as a separate hypothesis and record its results separately. Choosing whichever expiry looks best after viewing the outcome is hindsight, not validation.
A Hypothetical Engulfing Pattern That Still Loses
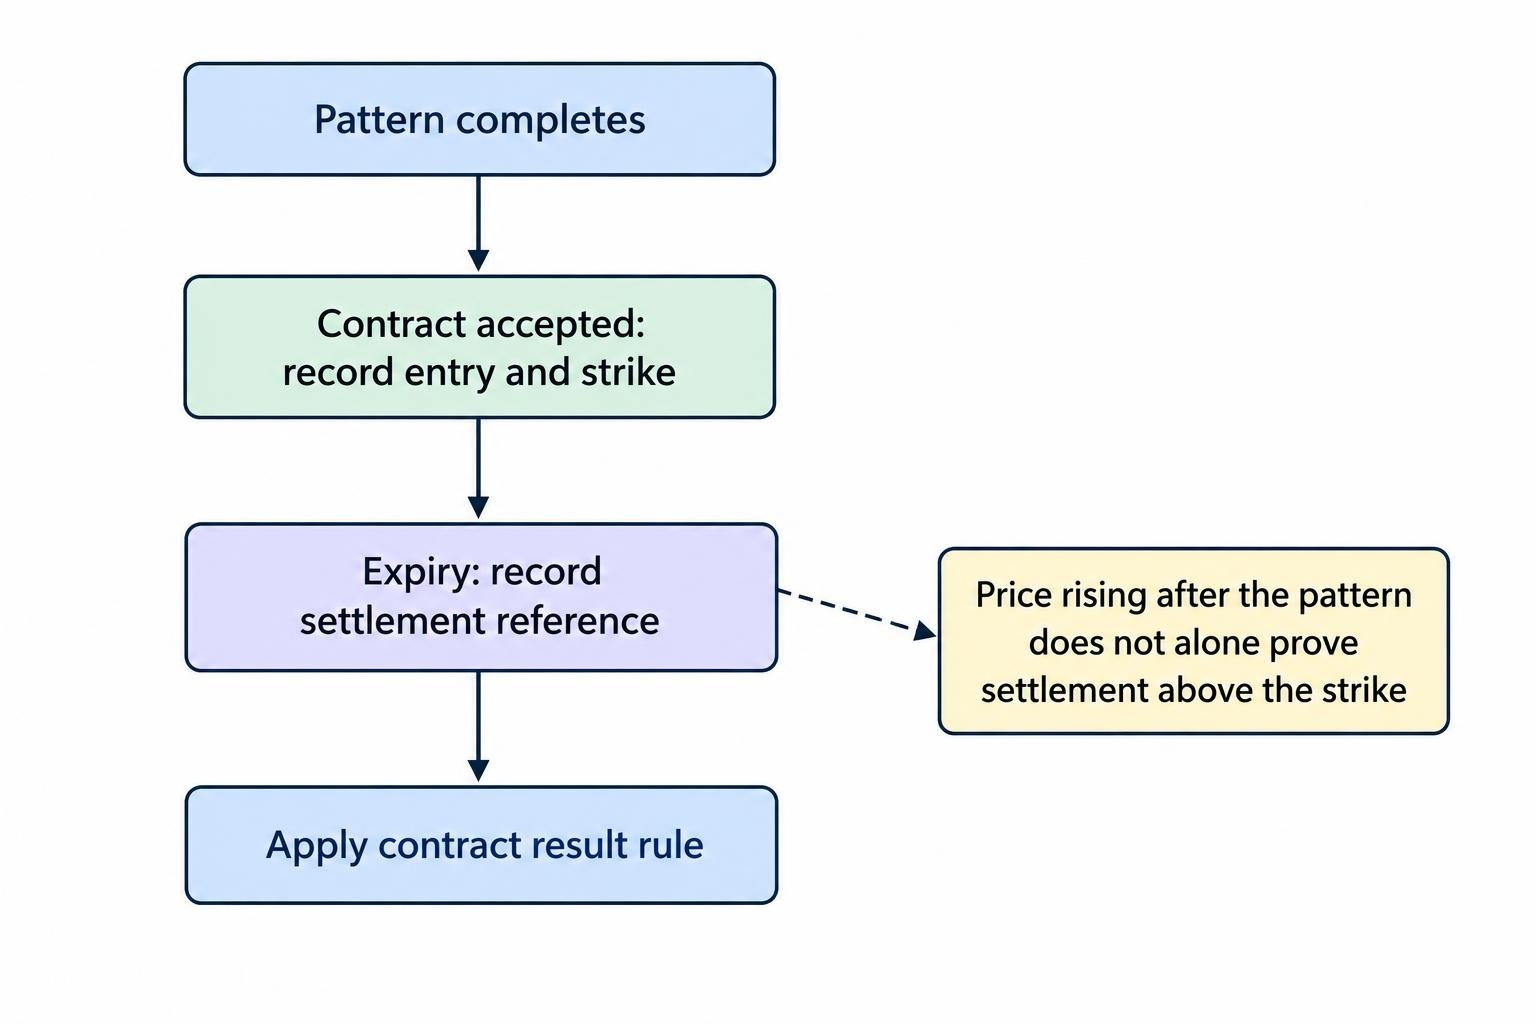
Suppose an AUD/USD chart completes a bullish engulfing pattern at 11:10, following a decline. The second candle closes at 0.66035. A simulated higher contract is accepted two seconds later with a strike of 0.66040 and an expiry of 11:15:00.
At expiry, the stipulated settlement price is 0.66038. That is above the completed pattern’s closing price, but below the contract’s strike. Under terms requiring settlement strictly above the strike, the higher contract loses.
The example contains no historical result or claimed success rate. It demonstrates a measurement problem: “price rose after the pattern” is not the same test as “the contract settled above its accepted strike.”
Logging only the signal candle’s close would misclassify this outcome. A useful simulation needs the accepted entry price, acceptance time, expiry, settlement reference and applicable result rules.
A Pattern’s Hit Rate Must Cover the Payout
Directional accuracy is not enough when winning and losing amounts differ. Consider a hypothetical contract that earns an 80% net profit on a winning stake and loses the entire stake otherwise.
Ignoring ties and other costs, its break-even win rate is:
Break-even win rate = 1 ÷ (1 + net profit rate)
At an 80% net profit rate, that is 1 ÷ 1.80, or approximately 55.56%. A pattern winning 55% of the time would still lose money under those assumptions.
Across 100 equal A$10 stakes, 55 wins would earn A$440 in profit, while 45 losses would cost A$450. The net result would be a A$10 loss before any other costs. These are arithmetic examples, not performance estimates.
The guide to probability and expected value in binary options develops this relationship. Evaluate patterns against the applicable payout and result rules, not a headline accuracy percentage detached from the contract.
What Research Says About Candlestick Reliability
Academic evidence does not support a blanket claim that recognizable candle shapes reliably generate profitable trades. A 2017 study of candlestick patterns in SET50 stocks, using daily data from July 2006 to June 2016, found that most patterns’ mean returns were not statistically different from zero. Filtering with RSI, stochastics or the Money Flow Index generally did not improve profitability or prediction accuracy in that study.
That finding should not be stretched into a claim about every instrument and timeframe. It does, however, challenge the assumption that adding a familiar indicator automatically validates a familiar pattern.
The outcome being measured matters too. An average share return over several days differs from the probability that a binary contract settles beyond a particular strike at a particular moment. Evidence for the former does not establish the latter.
A 2015 candlestick study by Lu, Chen and Hsu found profitable results for eight three day reversal patterns in DJIA component data under one holding strategy, with a 0.5% transaction cost assumption and adjustment for data snooping. The alternative holding strategy did not produce profitable results.
The practical inference is narrower than “candlesticks work” or “candlesticks never work.” Pattern definitions, entry rules, holding rules and evaluation methods can change the result. A pattern name is not a transferable performance record.
How to Study Candlestick Patterns Without Cherry Picking
Choose one formation and write its rules before reviewing outcomes. Define body coverage, wick proportions, the preceding trend, chart interval and any location filter. If “strong support” is part of the setup, explain how that support is identified using only information available at the time.
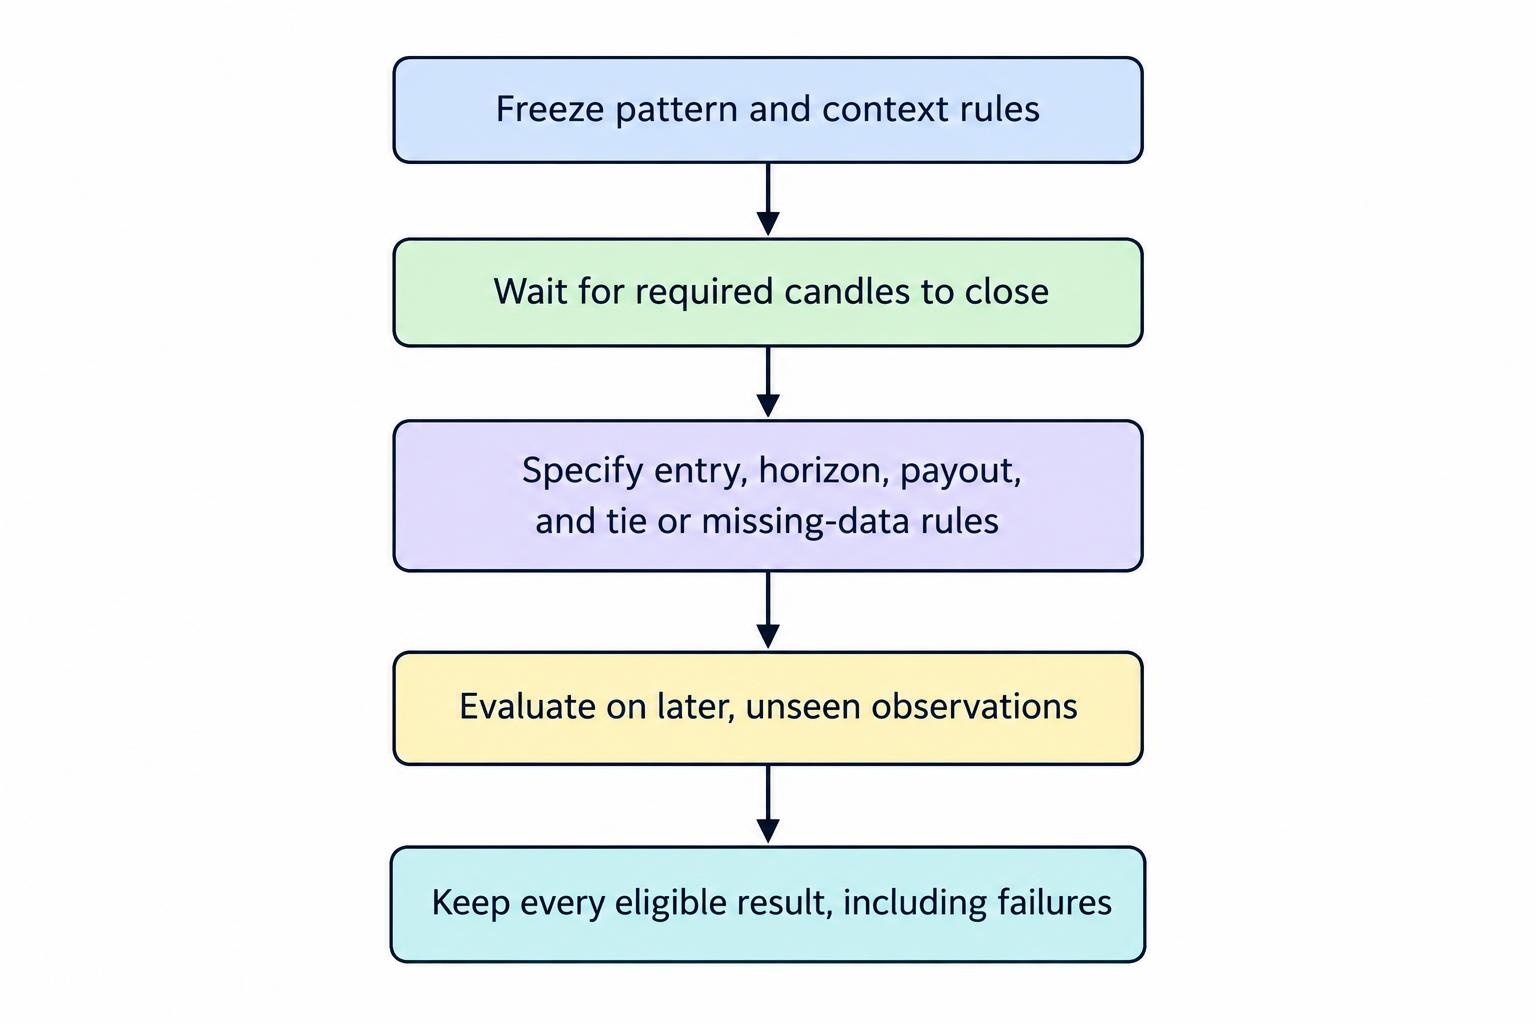
Use a short, repeatable process:
- Freeze the definition. Keep the pattern and context rules unchanged during each evaluation.
- Wait for completion. Record a signal only after every required candle has closed.
- Specify the outcome. Fix the entry assumption, horizon, payout and treatment of ties or missing data.
- Separate development from evaluation. Use later, unseen observations to assess rules developed on earlier data.
- Keep every eligible result. Include failed setups rather than collecting attractive screenshots.
Account for the delay between a completed signal and an achievable entry. A test that identifies a closing pattern and assumes an entry at that exact historical close can grant itself a price that was not available after recognition.
Also distinguish the number of trades from the amount of independent evidence. Several signals around the same market move may share the same underlying exposure. The guide to backtesting binary options strategies addresses these research problems in more detail.
Change one rule at a time and retain earlier versions. If every disappointing result leads to a new wick threshold, indicator or expiry, the rules can gradually fit the historical sample rather than identify a repeatable relationship.
Use Patterns as Testable Descriptions
The useful starting point is not memorizing dozens of formations. It is recognizing a small set consistently, separating completed signals from unfinished candles, and measuring the outcome the proposed contract actually requires.
For Australian retail readers, keep that work within chart study and paper trading exercises. Candlestick patterns can make observations more precise. They cannot remove payout disadvantages, settle timing uncertainty or turn a plausible chart interpretation into a guaranteed result.
This article was last updated on: October 22, 2026