A cash index price and a futures price can describe the same stock market without showing the same number. The cash index is a calculated benchmark based on its constituent shares. An index futures price belongs to a traded contract with a stated expiry. Financing costs, expected dividends, trading hours and contract maturity can all affect the comparison.
For binary options, the distinction matters because the contract’s named reference price determines the result. A rising cash index does not guarantee that a futures-based contract finishes above its strike, or vice versa. Before comparing charts, establish what each number represents.
Australian retail restriction: ASIC’s prohibition on issuing and distributing binary options to retail clients remains in force until 1 October 2031. The examples here explain pricing and contract interpretation, not a route around the ASIC binary options product intervention order.
What a cash index price represents
A cash stock index measures the value or price performance of a defined group of shares under the index provider’s calculation rules. It is not a separate security changing hands at the displayed level. Investors can trade products linked to an index, but the benchmark itself is a calculation.
For a market capitalisation weighted index, the calculation combines constituent share prices with the relevant share counts and weighting adjustments, then divides the result by an index divisor. Other indices use different weighting methods. Also distinguish a price return index from a total return index: the latter includes dividend reinvestment in its calculation. These distinctions are covered in the S&P Dow Jones Indices mathematics methodology.
That makes the full benchmark name worth checking. “ASX 200” is useful shorthand in conversation, but a pricing comparison needs the actual series, its return treatment and its timestamp. Two numbers carrying the same broad market label may not represent identical measurements.
What an index futures price represents
An index futures price is the market price of a contract tied to an underlying index and a stated maturity. Buyers and sellers trade that contract, rather than buying the constituent shares through the futures transaction.
The maturity matters. A nearer contract and a later contract are separate instruments, even when both reference the same index. Their prices need not match because they cover different periods before settlement.
There are also two expiry clocks to keep separate. A hypothetical binary option might expire in five minutes while referencing an index futures contract that matures months later. The binary option’s expiry determines when its condition is checked. It does not bring forward the maturity of the underlying futures contract.
The broader guide to stock index binary options covers the market category. Here, the narrower question is whether the price being analysed matches the price named in the contract.
Why cash and futures prices differ
The difference between the futures price and the cash index level is called the basis. In this article:
Basis = futures price − cash index level
A futures price of 8,030 against a cash index level of 8,000 therefore gives a positive basis of 30 points. This describes the gap; it does not, by itself, identify an error or a trading opportunity.
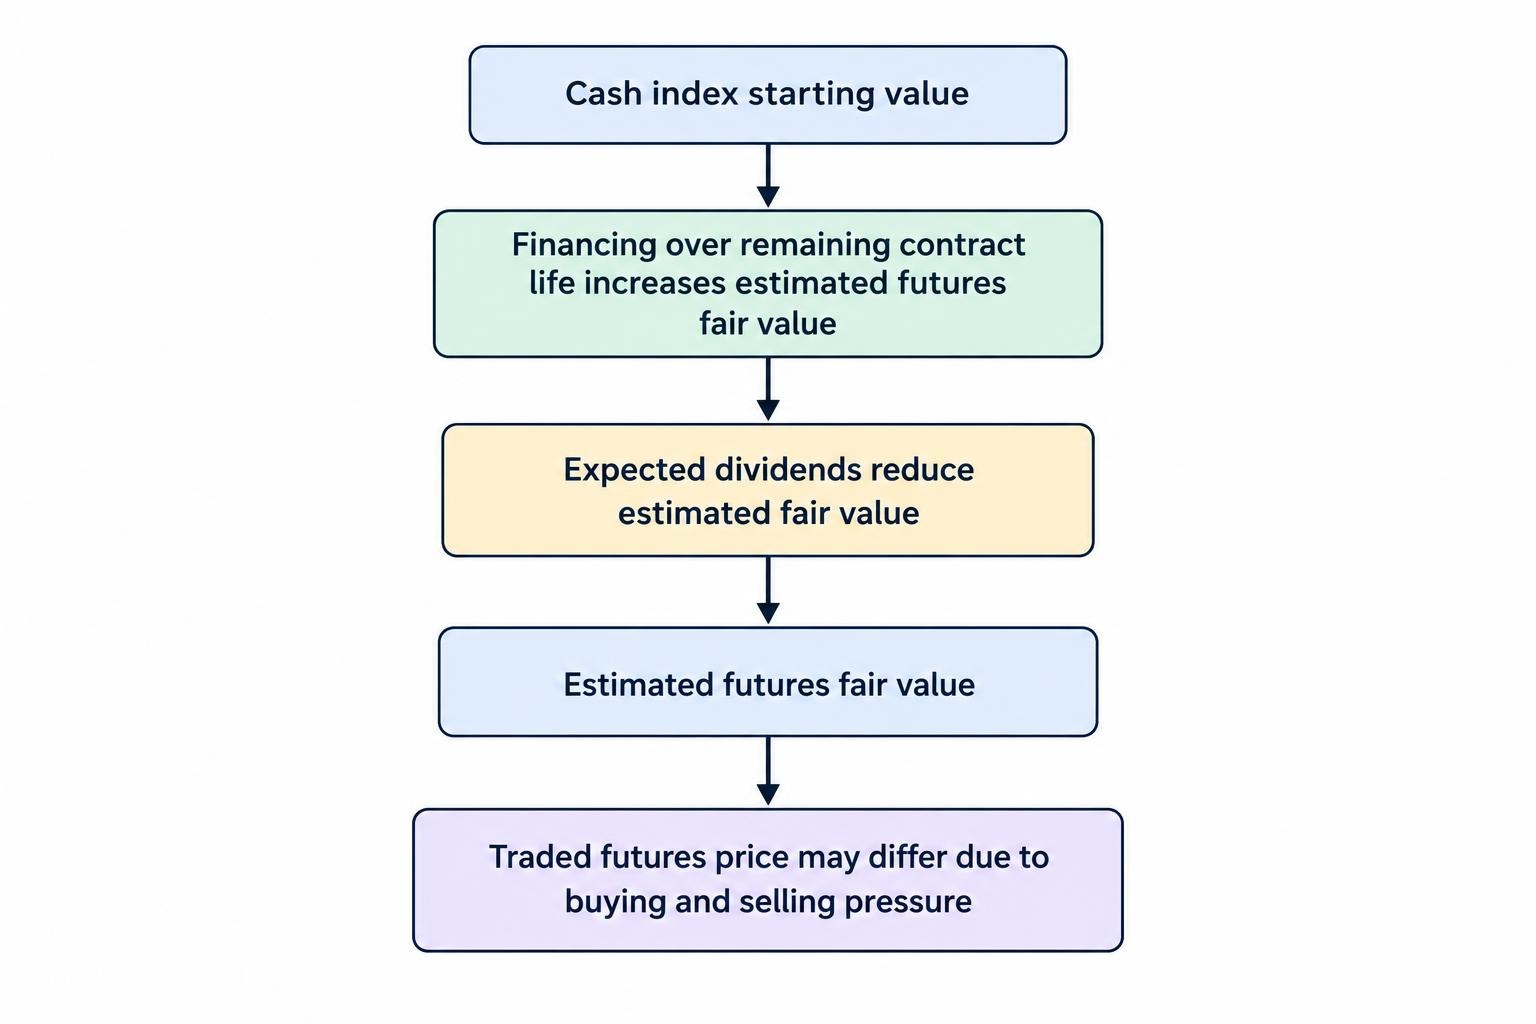
A simple fair value calculation starts with the cash index, adds financing over the remaining contract life and subtracts expected dividends, expressed in index points. Actual futures prices can trade away from that theoretical value as buying and selling pressure changes. The CME stock index futures fair value calculation sets out this relationship.
A hypothetical fair value calculation
Suppose the cash index stands at 8,000, the assumed annual financing rate is 4.5%, and the futures contract has 90 days remaining. Assume expected dividends before maturity equal 60 index points. These are illustrative inputs, not current market prices or rates.
Using simple interest and a 360-day year:
Estimated futures fair value = 8,000 × [1 + 0.045 × (90 ÷ 360)] − 60 = 8,030
The financing component adds 90 points and expected dividends subtract 60, leaving a 30-point premium. Under these assumptions, futures trading above cash does not mean the market expects the cash index to rise exactly 30 points.
Change the inputs and the result changes. Higher expected dividends reduce theoretical futures fair value, all else equal. Higher financing costs increase it. The remaining time also matters. Do not treat a price gap observed on one date as a permanent adjustment that can be applied to every later chart.
Trading hours can make the comparison misleading
Before interpreting the basis, check whether both prices are current. A futures contract may be trading while the underlying share market is closed. ASX SPI 200 futures, for example, have day and overnight sessions in the ASX 24 contract specifications. The overnight session’s finishing time changes across the stated seasonal periods.
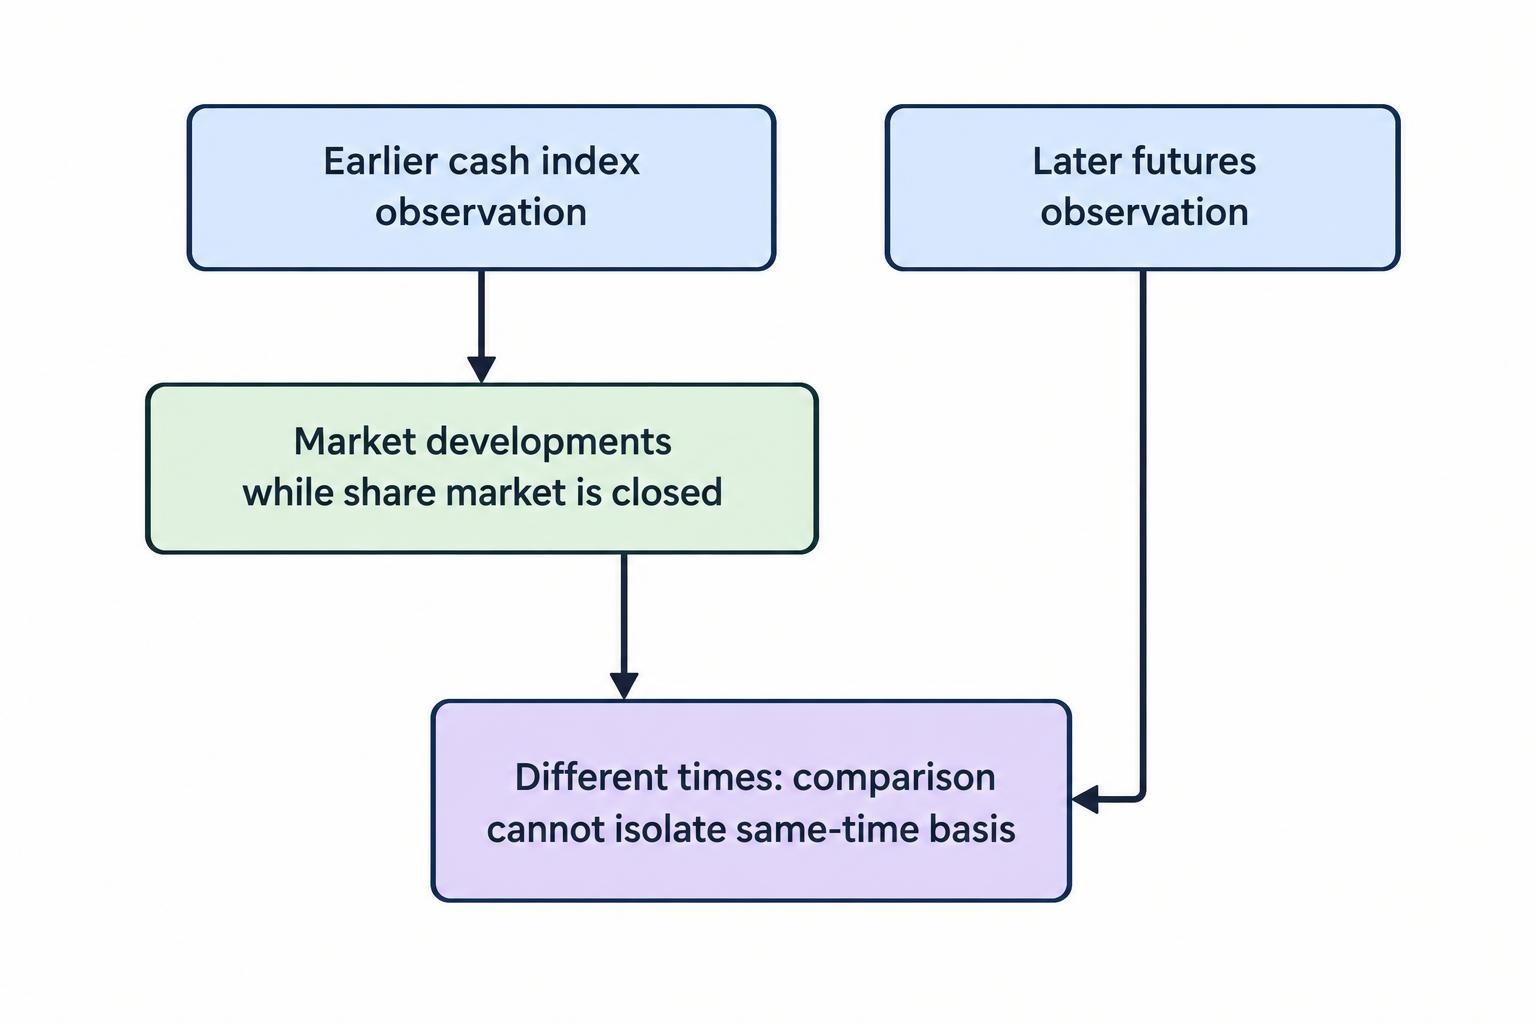
Consider a hypothetical screen showing a cash index closing level of 8,000 and a later futures price of 7,940. Calling this a 60-point discount leaves out an important detail: the observations were taken at different times.
The comparison mixes an earlier cash observation with a later traded futures price. It cannot isolate the same-time basis. Part of the apparent gap may reflect market developments after the cash observation, rather than financing and dividend expectations alone.
The same caution applies to delayed data. If one display shows an earlier observation, matching the clock on your device does not synchronise the underlying prices. Record the data timestamp, not just the time you took a screenshot.
Session breaks matter too. A number that remains visible during a break is not necessarily a newly traded price. “Still on screen” and “currently trading” are different things.
How the reference price changes a binary option’s result
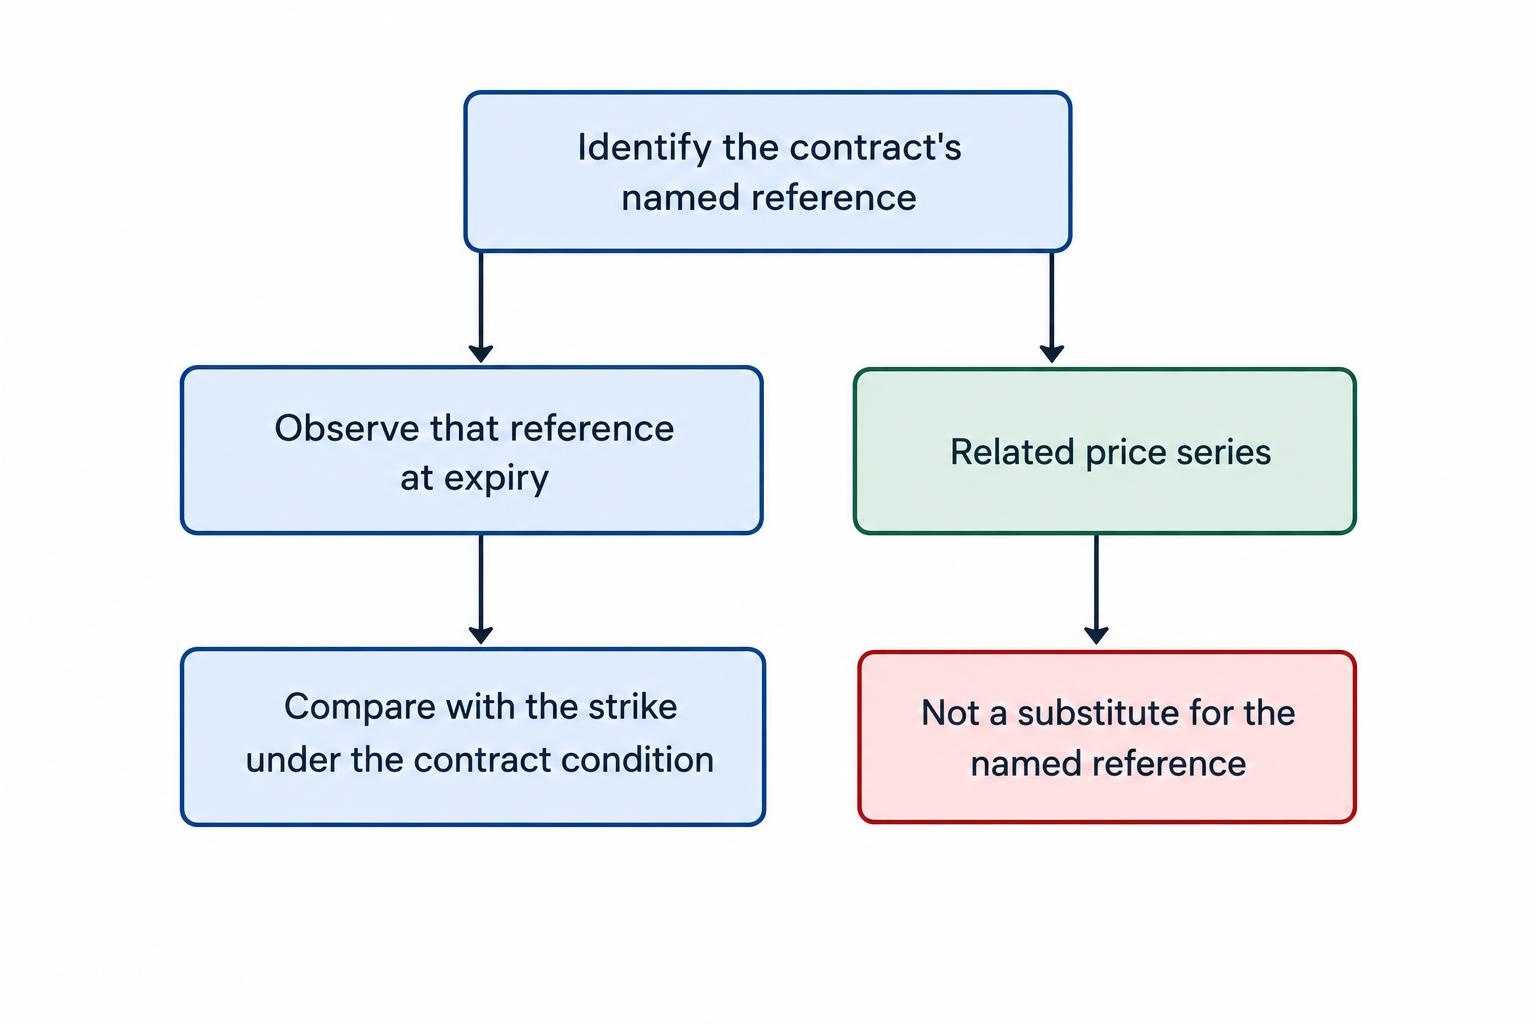
A binary option checks a defined condition against its named reference. It does not settle against whichever related chart appears most persuasive.
The following example uses two hypothetical “higher” contracts over the same interval. Each strike equals its own reference price at entry. Assume both contracts require the expiry reference to be strictly above the strike, with no rounding complication.
| Contract reference | Strike at entry | Reference at expiry | Hypothetical result |
|---|---|---|---|
| Cash index | 8,000 | 8,002 | Above strike |
| Named index futures contract | 8,030 | 8,029 | Below strike |
The cash index rises two points, but futures fall one point. The basis narrows from 30 points to 27 points. There is no mathematical contradiction: the two reference series have moved differently during the observation window.
Now suppose only the cash-based contract exists. Reading the futures level of 8,029 against the cash strike of 8,000 would produce a misleading comparison. The futures number is higher, but it is not the contract’s reference. Its absolute level cannot substitute for the required cash observation.
This also explains why a fixed adjustment can fail. Subtracting the entry basis of 30 from the futures expiry price would produce an estimated cash level of 7,999. The actual hypothetical cash level is 8,002 because the basis changed.
For contracts finishing at or very near the strike, rounding and equality rules need separate attention. The guide to binary options settlement and ties covers those questions without assuming every contract uses the same treatment.
Check the instrument behind the chart label
A short label such as “Australia 200”, “US 500” or “cash” is not enough to establish a price’s identity. Treat it as a starting point for checking the instrument description, not as the complete specification.
Establish whether the display represents an official index series, a dated exchange futures contract, a continuous futures chart or a provider-derived quotation. If a product description says its quotation is derived from futures, check the adjustment method rather than assuming it equals either the unadjusted futures price or the official cash index.
The next question is which field the chart displays. A last traded price, bid, ask and midpoint are different observations. A candle is also a summary of observations over an interval, not a complete record of every price within it.
These checks become especially useful when two screenshots appear to disagree. The guide to price feeds and benchmarks addresses feed identification and reference matching in more detail.
Continuous futures charts need another check
A continuous futures series joins successive contracts into one history. That makes a longer chart possible, but it does not turn the series into one dated contract. The switching rule matters: the CME continuous price series documentation distinguishes front-contract and active-contract series and identifies its daily observations as settlement based.
Suppose an expiring contract trades at 8,030 and the next contract trades at 8,055. A chart that switches between them can introduce a 25-point difference through the contract change. That does not establish a simultaneous 25-point rise in the cash index.
Check whether the chart provider adjusts its historical series around those switches. Do not transfer an exact historical level into a contract assessment until you know which contract supplied it and whether the displayed history has been adjusted.
Final futures settlement is not any visible index tick
A futures contract’s last traded price, its daily settlement price and its final settlement value should not be treated as interchangeable. For an expiry comparison, use the exchange’s definition of final settlement rather than selecting a convenient chart observation.
ASX provides a useful example. Its index derivatives settlement procedure uses the Opening Price Index Calculation for SPI 200 settlement. That calculation uses each constituent stock’s first traded price on expiry day, with a previous-day price fallback when a constituent does not trade that day. The ASX index derivatives settlement procedure and history provides the published settlement reference.
A calculation assembled from constituent opening trades is not necessarily the same as a single index tick captured at one instant. A screenshot of the ordinary index display therefore may not reproduce the settlement calculation.
Keep this separate from binary option settlement. A binary contract referencing a futures price does not automatically adopt that futures contract’s final settlement procedure. Its own terms must identify the reference, observation time and calculation method. The word “settlement” alone does not establish which process applies.
A practical method for comparing cash and futures prices
Start with instrument identification, then compare observations. Trying to explain a gap before identifying the two series puts the arithmetic ahead of the evidence.
- Record the full reference. Note the index series or exchange futures contract, including the contract month and year where applicable.
- Match the timestamps. Check the time zone, data delay and trading session. Avoid treating a previous cash close as a simultaneous live observation.
- Match the price fields. Establish whether each number is a last trade, bid, ask, midpoint, closing value or settlement value.
- Calculate the basis consistently. Use futures minus cash throughout the comparison, and record whether both observations are contemporaneous.
- Apply the contract’s own rules. Use the named reference and expiry condition, not a related chart or an estimated conversion.
For a historical review, retain the instrument description, contract terms and timestamped observations alongside the screenshots. A chart image without those details may show a price movement clearly while leaving the contract comparison unresolved.
Neither cash nor futures is automatically the “correct” price for every purpose. The cash index measures its defined share benchmark; futures price a dated derivative. For a binary option, the relevant number is the one specified in the contract. Identify that number first, then ask whether it finished above or below the strike.
This article was last updated on: October 22, 2026