Binary options backtesting software needs to do more than place buy and sell markers on a historical chart. It must reconstruct the entry price, apply the correct expiry, compare the settlement price with the strike, and calculate the contract’s actual payout. A profitable forex backtest does not automatically become a profitable binary options backtest.
For Australian readers, the regulatory position comes first. ASIC’s prohibition on issuing and distributing binary options to retail clients remains in force until 1 October 2031, following its commencement on 3 May 2021. The ASIC announcement extending the binary options ban sets out that restriction. The software discussed here is for historical research and simulation, not a route around it.
What a binary options backtester must model
For a conventional high-low contract, the research question is whether the settlement price finishes above or below the strike. The distance travelled does not determine the fixed payout. A small favourable move and a large favourable move can produce the same return, provided both satisfy the contract’s terms.
That changes what the software needs to measure. A conventional trading system might earn enough from a few large winners to offset many small losses. A fixed payout binary model cannot assume the same relationship. It needs a separate record of each contract’s stake, potential profit, expiry and outcome.
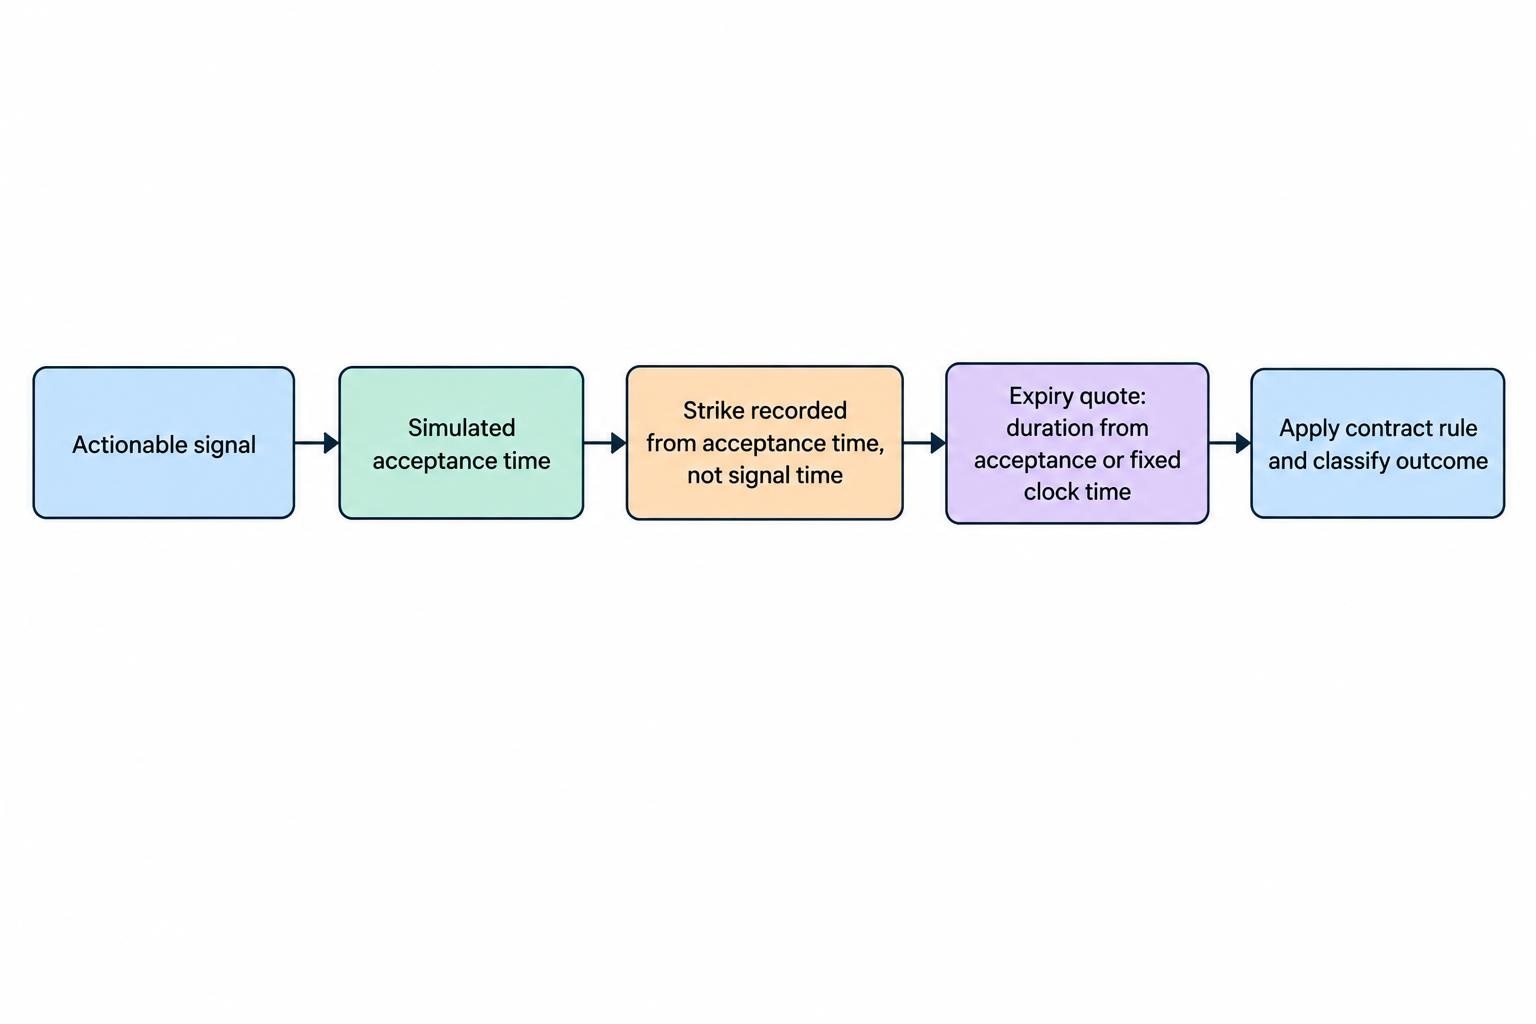
The software should also distinguish the signal time from the simulated acceptance time. If an indicator confirms at 10:00:00 but the model assumes acceptance at 10:00:02, the strike must reflect the latter assumption. Expiry must then follow the chosen contract rule: a duration measured from acceptance, or a fixed clock time.
This article focuses on software selection and validation. The broader process of forming rules, separating datasets and evaluating results belongs in the guide to backtesting binary options strategies.
Comparing the main software approaches
Choose a tool by the part of the research process it can handle reliably. A charting platform can help inspect signals, while a separate calculation engine handles contract outcomes. There is no requirement to force both jobs into one application.
| Approach | Useful role | Main validation task |
|---|---|---|
| TradingView with Pine Script | Chart based signal research and visual inspection | Separate conventional strategy returns from fixed payout calculations |
| MetaTrader 5 Strategy Tester | Testing programmed rules under different tick and execution settings | Implement and audit the binary contract accounting |
| Custom research application | Controlling expiry, settlement, payouts and data handling | Check the calculation engine as carefully as the strategy |
| Spreadsheet and manual replay | Small samples and independent calculation checks | Prevent hindsight, inconsistent entries and formula errors |
TradingView: useful for signal research
TradingView’s Pine Script strategies simulate hypothetical orders and generate performance reports. Under default calculation behaviour, a strategy calculates after a bar closes and an order can fill on the next available tick, normally the following bar’s opening tick in historical testing. These mechanics are documented in the TradingView strategy documentation.
For binary options research, treat that order timing as something to inspect, not an incidental setting. A signal marker on one candle does not necessarily mean the simulated entry occurred at that candle’s closing price.
Use a separate, auditable calculation for the binary outcome. It should identify the strike and expiry quote, apply the tie rule, then credit the fixed profit or deduct the stake. Do not use the platform’s conventional strategy profit as a substitute for that calculation. Before accepting a script’s results, trace several contracts from signal to settlement.
MetaTrader 5: a programmable testing environment
MetaTrader 5’s Strategy Tester supports Expert Advisor testing, visual inspection, execution delay settings and several tick generation modes. Those include simulated ticks and a mode based on available real tick history. The MetaTrader 5 testing documentation describes these controls.
These capabilities can support a custom binary research model, but they do not remove the need to define the contract. Require the program to produce a separate contract ledger rather than treating ordinary position profit as the result.
Inspect what the chosen history and modelling mode actually provide. A test using generated price updates should not be presented as a reconstruction of every historical quote. Delay settings also need checking against the model’s strike and expiry calculations.
Custom software: more control, more responsibility
A custom application, potentially written in Python, is an option when the contract rules do not fit a conventional strategy tester. The design can separate signal generation, simulated acceptance, settlement and accounting.
That separation makes errors easier to isolate. One component determines whether a signal exists; another selects the eligible entry quote; another calculates the outcome. Changing the payout should alter the financial result without changing which price observations generated the signal.
The cost is development and validation work. A custom backtester can reproduce the same mistake thousands of times without complaint. Build small, hand calculated test cases before running a large dataset.
Spreadsheets and manual replay: useful audit tools
A spreadsheet is a sensible starting point for checking payout arithmetic and a modest sample of contracts. Record the signal, simulated acceptance time, strike, expiry, settlement quote, stake and result in separate columns.
Manual replay can help inspect whether a rule was actionable, provided future prices remain hidden and decisions are recorded before revealing the outcome. Selecting attractive historical setups is not a backtest.
For larger projects, keep the spreadsheet as an independent check. A sample of matching results between two calculation methods is more useful than another decorative dashboard.
Data quality matters more than the dashboard
Match the settlement reference
A dataset labelled EUR/USD is not enough to establish that it represents the intended contract. Document the provider, quote type, timestamps and settlement convention. The model needs to know whether it is comparing bid prices, ask prices, midpoints or another reference.
If the historical settlement reference cannot be obtained, describe the exercise as a signal study using substitute data. Do not present it as a reconstruction of an issuer’s contract results. More decimal places will not fix a mismatched reference.
The same caution applies to proprietary weekend or synthetic quotes. Do not assume an unrelated public price series can reproduce them. The guide to price feeds and settlement benchmarks covers the distinction between the market being analysed and the price that determines the outcome.
Check timestamp precision and missing observations
A one minute candle does not reveal the price at every second within that minute. If the simulated expiry falls between recorded observations, the software needs an explicit handling rule. Interpolating a price creates an estimate, not an observed settlement quote.
Require a consistent timezone, documented timestamp meanings and rules for duplicate or missing records. Distinguish a candle’s opening timestamp from its closing time. For Australian session filters, document whether daylight saving adjustments are included.
Unresolved contracts should remain visible in the report. Rejecting them under a rule written before testing is defensible; silently removing them after seeing their effect is not.
Check when signals become knowable
Historical indicators can differ from their behaviour on an unfinished live candle. Values may fluctuate before the close, while some scripts plot information back onto earlier bars. These are different forms of repainting, and not all are inherently misleading. The distinction is covered in TradingView’s documentation on historical and realtime repainting.
For software evaluation, ask a precise question: when did the information needed for this entry become available? A pivot confirmed several candles later cannot justify an entry at the earlier pivot time.
Require the simulator to record the actionable signal timestamp. A historical arrow without that timestamp leaves too much room for hindsight.
Model payouts, ties and account balances correctly
For a fixed stake high-low model, define the payout as net profit on a winning contract, separate from the returned stake. With a hypothetical A$10 stake and an 80% net profit payout, a win earns A$8 and returns the A$10 stake. A full loss deducts A$10.
Suppose a simulated sample contains 100 contracts, with 56 wins and 44 losses, no ties and no other costs. Winning profit is A$448 and losses total A$440, leaving A$8. If the same outcomes receive a 75% payout, winning profit falls to A$420 and the sample loses A$20.
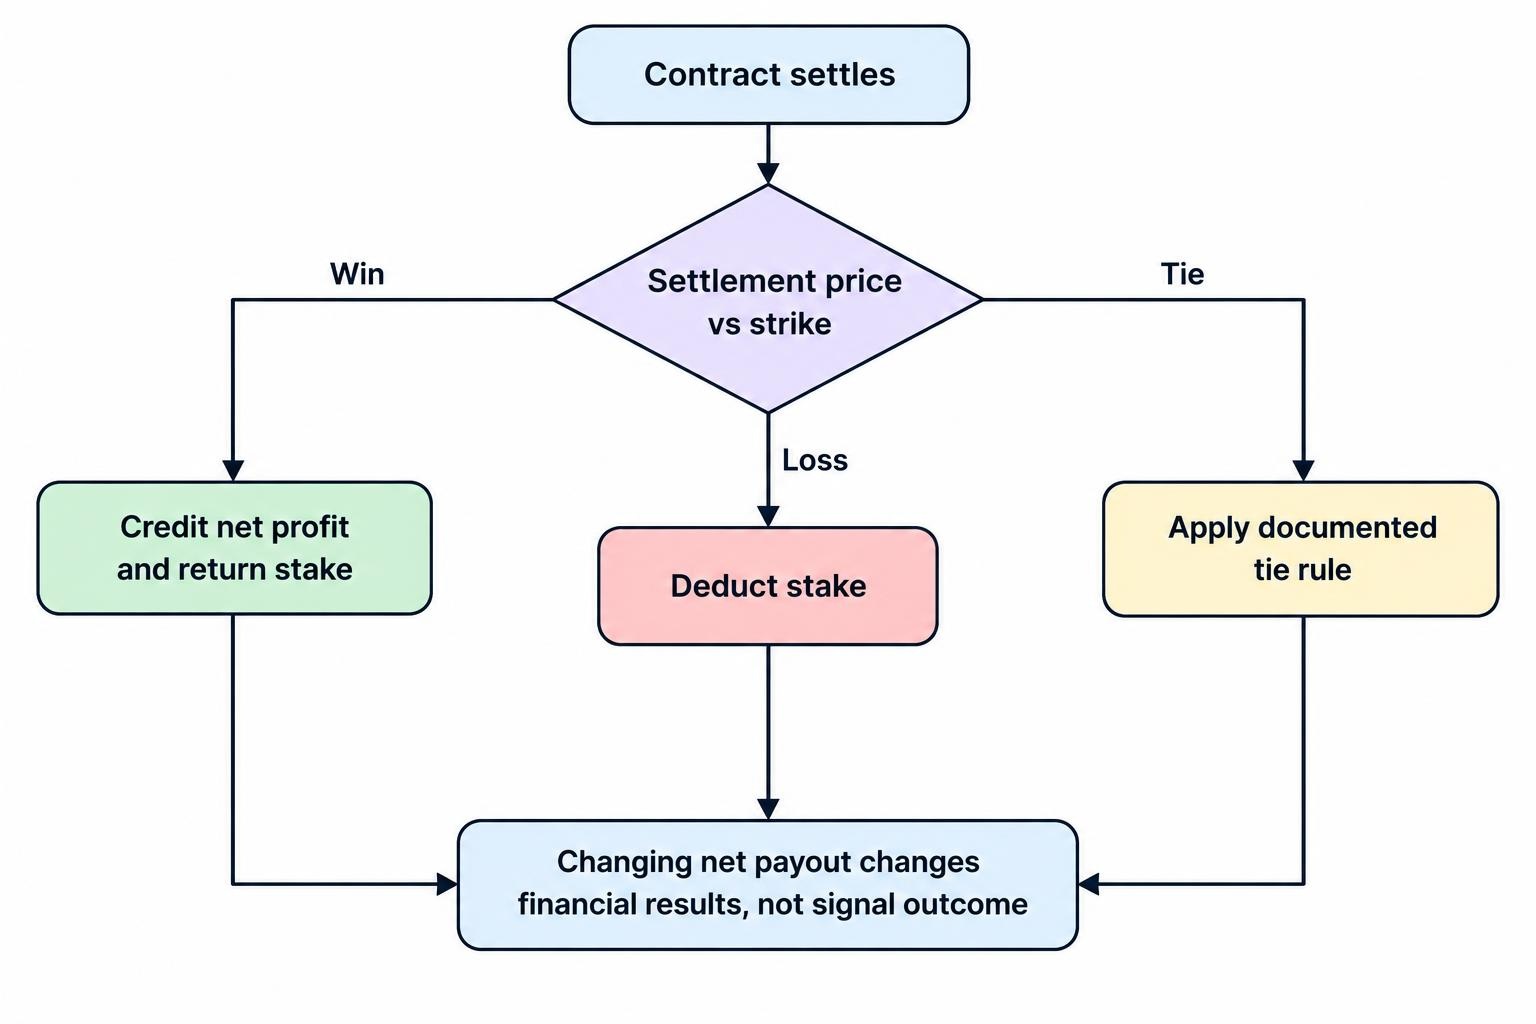
Nothing about the signals changed. The contract economics did. Under these assumptions, the break-even win rate is 1 divided by 1 plus the net payout expressed as a decimal: about 55.56% at an 80% payout, or 57.14% at 75%. The relationship is developed further in the guide to probability and expected value in binary options.
If historical payouts are unavailable, run labelled scenarios rather than assuming one rate applied throughout the period. Show how the result changes under less favourable payout assumptions.
Ties need their own setting: refund, loss or another documented treatment. Price precision and rounding must also match the model. Avoid an arbitrary tolerance that turns inconvenient losses into refunds.
Account accounting deserves a separate check. When contracts overlap, reserve their stakes until settlement so the model cannot spend the same available cash repeatedly. Report both committed stakes and available balance, not just a final profit figure.
Demand reports that expose weak results
A useful report should let the reader reconstruct the outcome, not just admire an upward line. Require a contract level export containing timestamps, prices, stakes, payout assumptions and settlement classifications. Include unresolved observations and rejected signals with reasons.
The summary should show the number of contracts, wins, losses, ties, net result, drawdown and concurrent exposure. Break results into chronological periods so one strong interval does not hide weaker ones. Keep fixed stake results separate from experiments that change stakes after wins or losses.
Optimisation history also matters. Searching many rule combinations on the same data creates opportunities to select a chance winner. This multiple testing problem is examined in the research paper The Probability of Backtest Overfitting. Software should preserve the search record, not export only the most flattering run.
Ask for performance on later data that did not influence rule selection. If the rules are repeatedly changed after viewing that period, it is no longer an untouched check. A report should make those revisions visible.
What to check before paying for software
Start with the smallest package that can answer the research question. Before buying a subscription, commissioning a script or paying for historical data, verify these points:
- Contract controls: Can it represent the required expiry, tie treatment, payout assumptions and overlapping contracts?
- Data access: Does the available history cover the required dates, quote type and time resolution?
- Auditability: Can results be exported and individual outcomes reproduced outside the application?
- Repeatability: Can the dataset version, settings and strategy version be saved together?
- Total cost: What extra charges apply to data, development, computing, maintenance and exports?
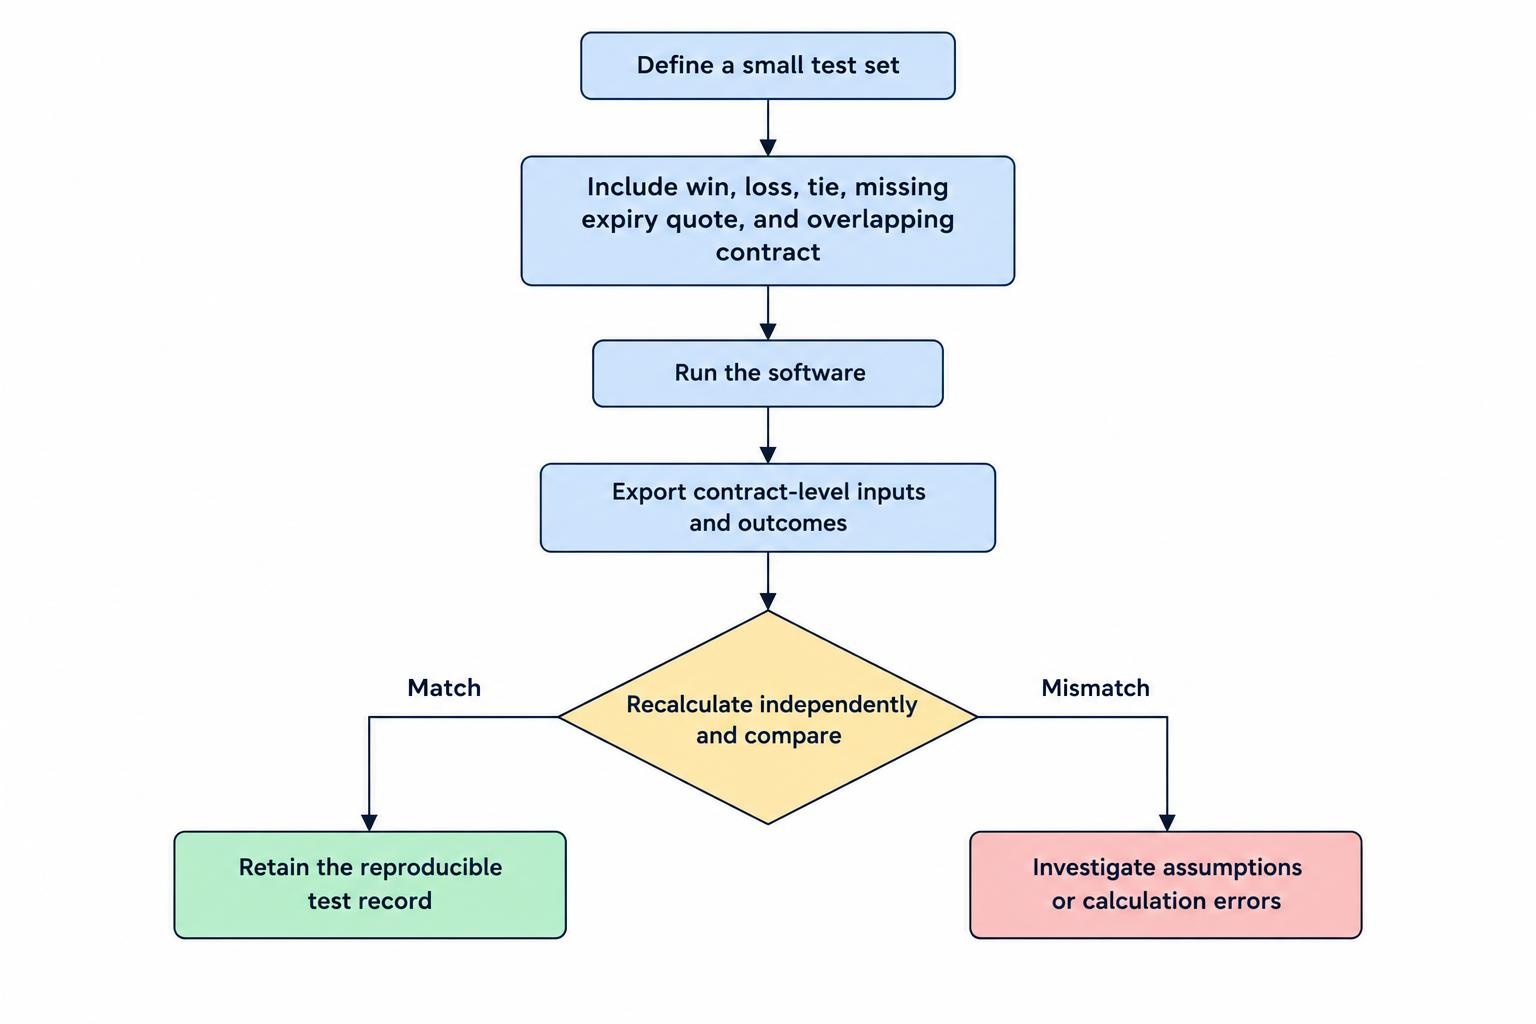
Request a small reproducible demonstration rather than a screenshot of someone else’s results. Include an ordinary win, an ordinary loss, a tie and a missing expiry quote. Then add an overlapping contract to test the balance calculation.
For cloud tools, establish what files and credentials must be uploaded. Historical analysis should not become an excuse to hand over account access that the research does not require.
Use backtesting software as a research filter
Choose software that makes assumptions visible and mistakes traceable. TradingView can serve the chart research stage; MetaTrader 5 offers a programmable testing environment; custom applications offer contract control; spreadsheets provide a useful independent audit. The right combination depends on the rules and data, not the most polished sales page.
Once a model passes basic calculation checks, freeze its rules and compare later observations against its recorded assumptions through forward testing. A favourable historical result remains a simulation. It does not establish future profitability, reliable withdrawals or permission to offer the product to Australian retail clients.
This article was last updated on: October 22, 2026