A losing streak in binary options is a sequence of consecutive losing trades. It can occur in a profitable mathematical model, but it can also expose a failing method, poor execution or a habit of chasing losses. The streak alone does not tell you which explanation is right.
The useful response is to separate three questions: how unusual is the sequence, how much damage has it caused, and did the trades follow the original rules? Increasing the next stake answers none of them.
For Australian readers, the regulatory position comes first. ASIC’s prohibition on issuing and distributing binary options to retail clients took effect on 3 May 2021 and extends until 1 October 2031. The ASIC announcement extending the binary options ban confirms those dates. The examples below are for education, historical analysis and simulated practice, not a recommendation to open a funded account.
What Counts as a Losing Streak?
Consider this sequence, where W means a win and L means a loss:
W, L, L, L, W, L, L
The longest losing streak is three trades. The current streak is two. Neither figure tells you the total monetary loss, because that also depends on stake sizes and payouts.
Keep streak length separate from trading drawdown. A streak counts consecutive losses; drawdown measures the decline from an account’s previous peak. Several small losing streaks, separated by inadequate wins, can produce a prolonged drawdown.
Define how you handle ties, refunds and early exits before reviewing results. A fully refunded tie is not a monetary loss, but your records should state whether it interrupts the streak or sits outside the win/loss sequence. Apply the same rule throughout. Otherwise, two reports can describe the same trades differently.
The calculations below assume each trade either wins or loses its full stake. They exclude ties, refunds, fees and early exits.
How Likely Are Consecutive Losses?
Start with a simplified model: every trade has a 55% chance of winning and a 45% chance of losing, and outcomes are mutually independent. These are assumptions, not measured performance claims.
For independent events, multiply the individual probabilities to find the probability that all occur. This is the multiplication rule for independent events. If the loss probability is q, the probability that the next k trades all lose is qk.
Using a 45% loss probability gives the following results:
| Consecutive losses from the next trade | Probability |
|---|---|
| 3 | 9.11% |
| 5 | 1.85% |
| 8 | 0.1682% |
| 10 | 0.0341% |
These figures describe a sequence beginning at a chosen point. They do not describe the chance of encountering that streak somewhere in a long trading record. They also allow further losses after the stated sequence: “the next five lose” does not require the sixth trade to win.
A Long Record Provides More Opportunities for Streaks
Divide 100 hypothetical independent trades into 20 separate blocks of five. Each block has a 1.8453% chance of containing five losses.
The probability that at least one of those 20 blocks consists entirely of losses is:
1 − (1 − 0.455)20 = approximately 31.1%
That is a lower bound for encountering five consecutive losses somewhere within the 100 trades. It ignores streaks crossing the chosen block boundaries, such as a sequence beginning on trade four and ending on trade eight.
The practical point: a run that looks unlikely before the next trade can become much less surprising across a longer record. A backtest’s longest losing streak is therefore an observation, not a promise that future streaks will stop at the same length.
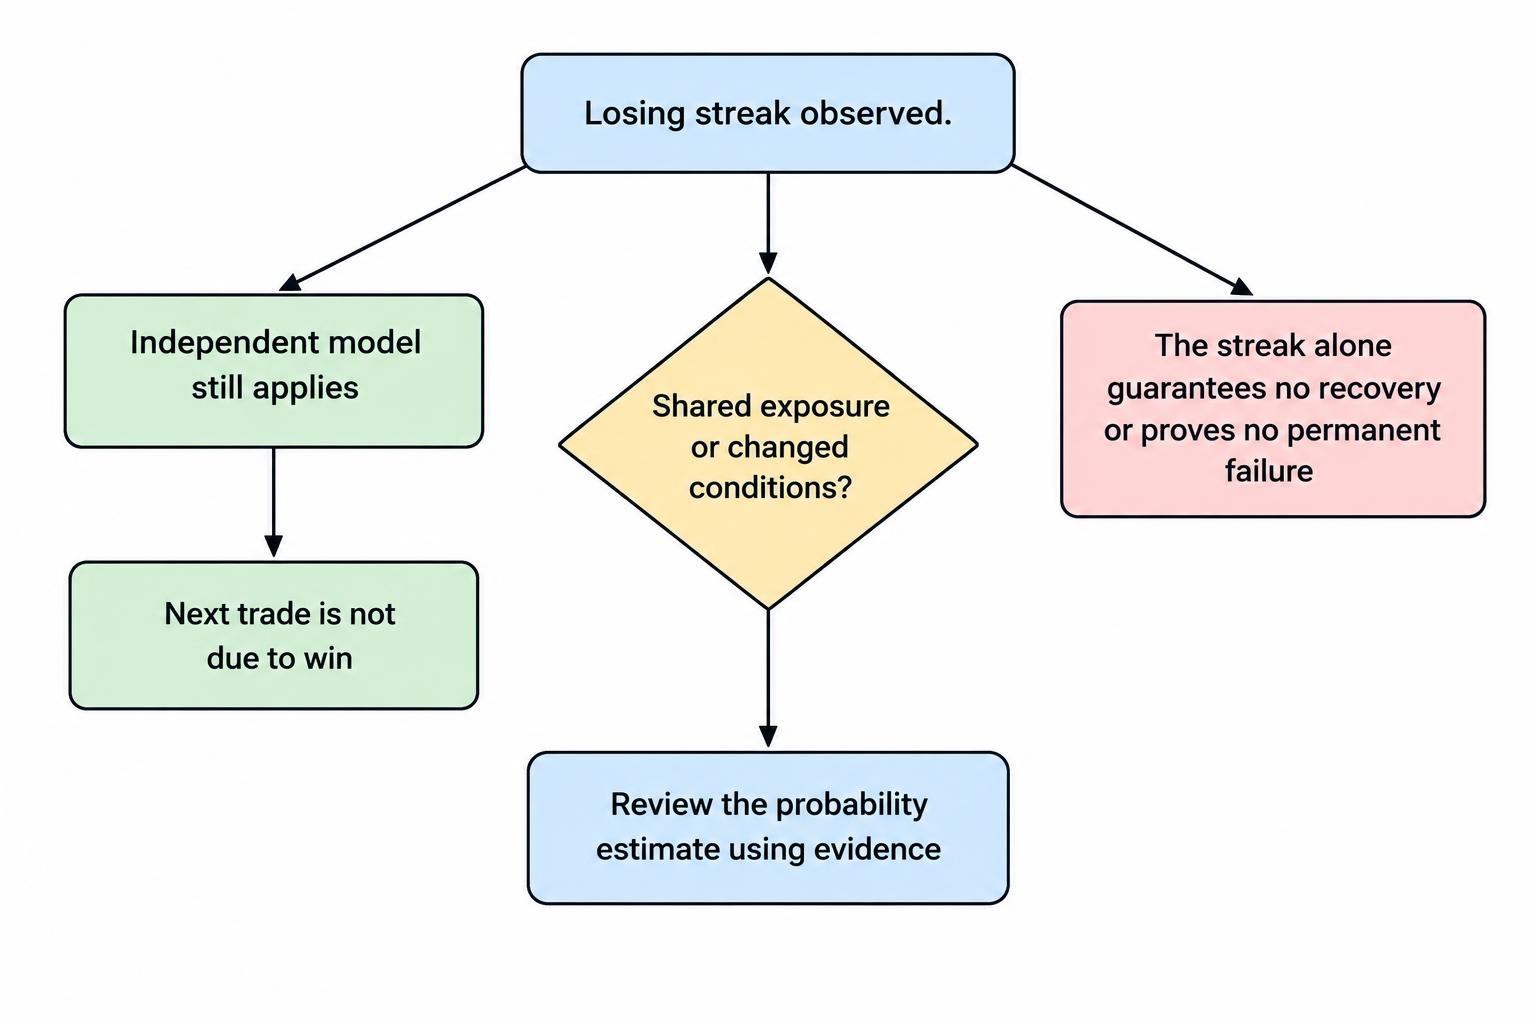
Why the Next Trade Is Not “Due” to Win
Under the independent model, five losses do not raise the next trade’s winning probability above 55%. Expecting a short sequence to compensate for earlier losses is the gambler’s fallacy described in Penn State’s statistics material. Long term averages do not work by arranging a convenient recovery immediately after a bad run.
Real trading outcomes, however, should not automatically be treated as independent. Several positions might share the same market move, overlapping expiry periods or the same entry signal. A change in conditions could also affect successive trades.
This creates an important distinction. A streak does not make a win overdue, but the circumstances behind that streak may justify revising an earlier probability estimate. Review the evidence rather than assuming either guaranteed recovery or permanent failure.
A Streak Cannot Be Judged Without the Payout
A win rate above 50% does not necessarily produce a profit. Suppose a winning contract returns the stake plus an 80% profit, while a losing contract forfeits the entire stake.
At a $10 stake, a win earns $8 and a loss costs $10. In a hypothetical record of 100 equal stakes containing 55 wins and 45 losses, the result is:
(55 × $8) − (45 × $10) = −$10
At that payout, the break-even win rate before other costs is approximately 55.56%. The relationship between probability and expected value matters more than whether the latest streak feels unusually harsh.
A method with negative expected value does not need a dramatic losing streak to drain an account. Repeated small shortfalls can do the job. Conversely, a model with positive expected value can still produce consecutive losses and has no guaranteed recovery date.
When reviewing a streak, record the payout offered on every trade. A method assessed at an 85% profit payout cannot be assumed to retain the same expected result at 70%, even if its win probability remains unchanged.
Stake Size Determines the Financial Damage
The same ten losses can have very different consequences depending on how stakes are set.
In a hypothetical $1,000 account, ten consecutive losses at a fixed $20 stake cost $200, leaving $800. The stake begins at 2% of the balance, but it becomes a larger percentage as the balance falls.
If each stake instead equals 2% of the balance immediately before that trade, ten full losses leave approximately $817.07, a decline of 18.29%. At 5% of the remaining balance per trade, the same sequence leaves approximately $598.74, a decline of 40.13%.
For a constant fraction f and k consecutive full losses:
Remaining balance = starting balance × (1 − f)k
These percentages are illustrations, not recommended stake levels. They assume no rounding, minimum stake restrictions or other cash flows. The separate stake sizing guide covers the distinction between fixed amounts and fractions of the remaining balance.
Recovery also requires a larger percentage gain than the preceding percentage loss. A 20% decline needs a 25% gain on the remaining balance to return to the starting point. A 40% decline needs about 66.7%.
That arithmetic makes prevention more useful than a recovery target. “I need to get back to $1,000” describes an account balance, not a reason for the next position to succeed.
Increasing Stakes Does Not Repair the Method
Raising stakes after losses increases the cash exposed without improving the assumed probability of winning.
Even a simple doubling sequence does not guarantee recovery when the winning profit is smaller than the stake. At an 80% profit payout, losing $10, $20 and $40 creates a $70 deficit. A subsequent $80 winning stake earns $64 profit, leaving the sequence $6 down.
The wider problems with Martingale in binary options trading include escalating exposure and the possibility of exhausting the available balance before a win arrives. The sequence does not become safer because the trader feels recovery is overdue.
For streak analysis, keep the proposed entry method and the stake progression separate. Otherwise, one large recovery win can disguise several poor decisions, while one failed progression can dominate the entire record.
Is It Ordinary Variation or a Method That Has Stopped Working?
There is no universal number of losses that proves a method has failed. Three losses may breach an operational rule without being statistically unusual. Ten losses may warrant a thorough review without identifying the cause on their own.
Check several competing explanations rather than choosing the most comforting one.
The Trades Followed the Rules, but the Outcomes Varied
Compare the streak with results from comparable conditions. Use the same entry rules, expiry selection and payout assumptions. A record assembled from different methods is a weak benchmark for any one of them.
Do not dismiss the losses as normal variation simply because a calculator assigns them a nonzero probability. Almost any finite sequence is possible under a suitable model. The question is whether the model remains a reasonable description of the process.
The Process Changed During the Streak
Check whether entries became earlier, expiry times changed or marginal setups entered the record. If the written method required confirmation and the fourth trade skipped it, that trade should not be treated as clean evidence about the original rules.
Keep rule violations visible rather than deleting them. One record should show what happened; a separate classification can distinguish compliant trades from deviations.
The Outcomes Share a Common Cause
Suppose five simulated positions all depend on the same currency pair moving higher over overlapping periods. A single downward move could defeat all five. Counting them as five independent tests would overstate the amount of independent evidence available.
Record shared markets, directions, event exposure and expiry windows. As an optional diagnostic, a runs test for detecting non-random ordering can assess a suitable binary sequence. It does not establish profitability, explain the cause of a pattern or prove independence when it fails to reject randomness.
Also check contract records before blaming the entry method. A disputed settlement, unexpected payout or incorrect expiry timestamp calls for a different investigation from a correctly recorded losing forecast.
Set a Response Rule Before the Streak Begins
A response rule should reduce discretion at the moment losses are hardest to assess. Define a review trigger before a practice session rather than moving it each time another trade loses.
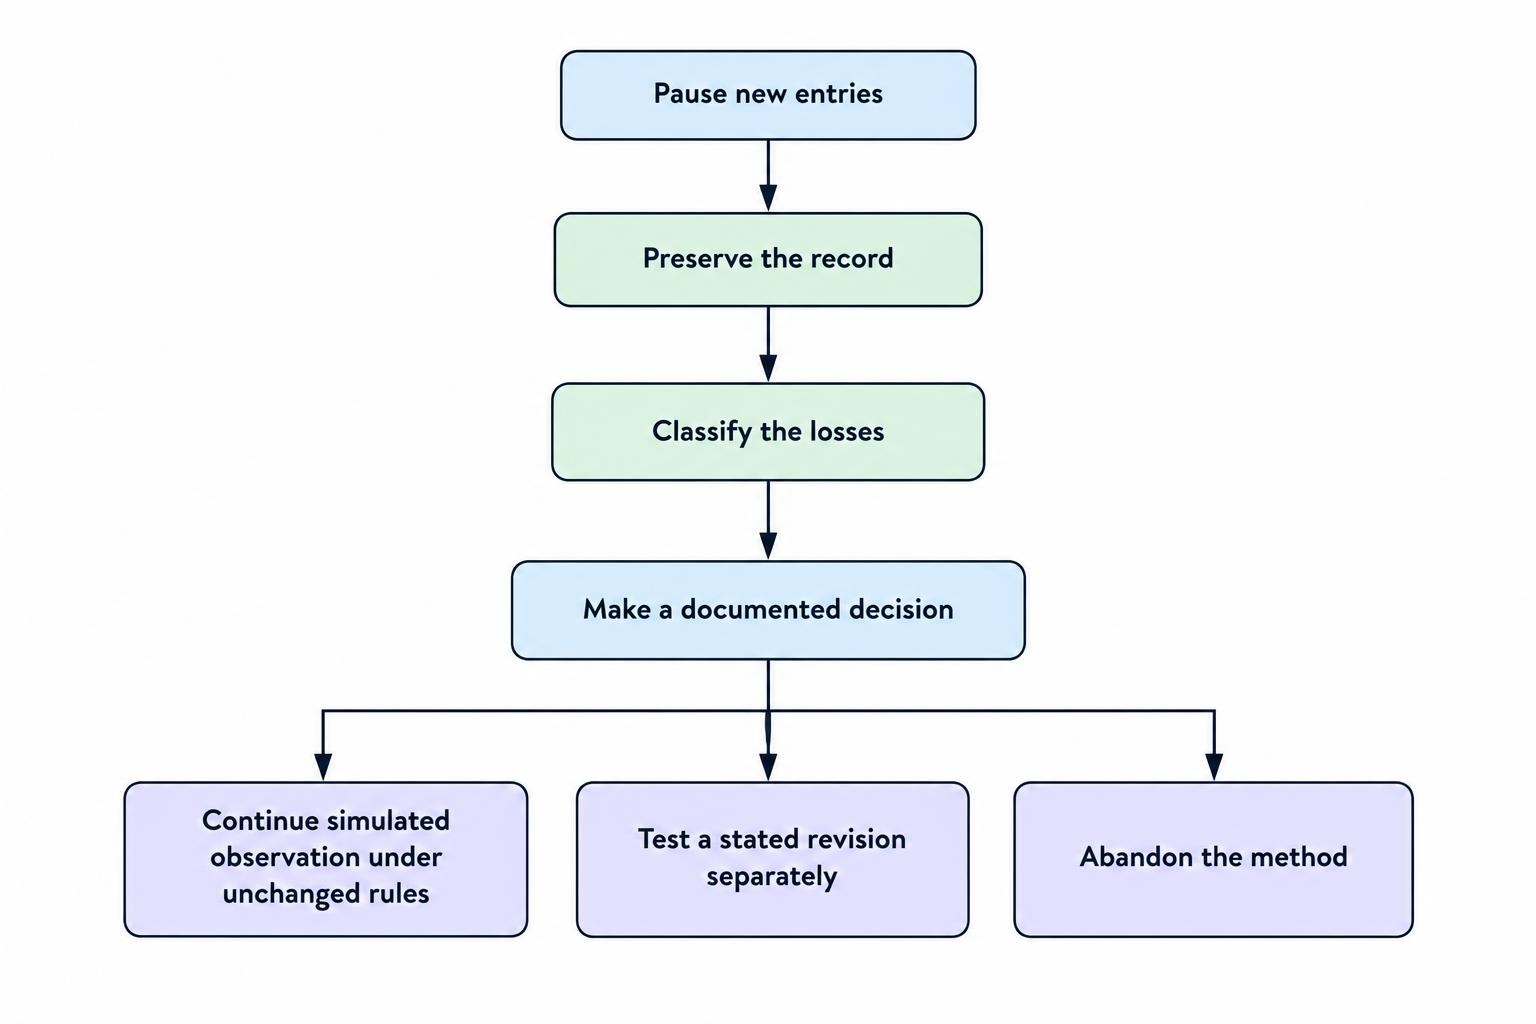
A workable procedure has four parts:
- Pause new entries. Treat the trigger as a checkpoint, not a signal to reverse direction or raise the stake.
- Preserve the record. Save timestamps, entry and settlement prices, expiry details, payouts and the rules used.
- Classify the losses. Separate compliant entries, rule violations, shared exposures and unresolved contract discrepancies.
- Make a documented decision. Continue simulated observation under unchanged rules, test a stated revision separately, or abandon the method.
A trading journal makes this review repeatable. Include both streak length and cumulative monetary loss: a count alone misses changing stakes, while a cash total alone can hide repeated execution errors.
For example, a practice plan might pause after four consecutive losses or a preset simulated loss budget, whichever comes first. Four is an administrative choice here, not a statistically correct threshold for every method.
Do not reset the loss budget by depositing more money or declaring a new session five minutes later. That changes the label, not the exposure.
What Should Happen After the Pause?
Resume simulated observation only when the review produces a reasoned decision. “Enough time has passed” and “the next one should win” are not evidence.
If the trades followed the rules and no defect was found, preserve those rules for the next planned observation period. If you change them, label the revised method separately. Rewriting earlier entries to fit the revision makes the record less useful.
Keep the response within a broader binary options risk management framework. A streak rule should work alongside exposure limits, reliable records and a clear decision to stop when assumptions cannot be checked. It cannot turn an unprofitable method into a profitable one or remove Australia’s retail prohibition.
A losing streak is evidence to examine, not a debt the market must repay. The practical objective is to prevent a difficult sequence from becoming a much larger, self-inflicted loss.
This article was last updated on: October 22, 2026