Crude oil binary options are contracts whose payoff depends on an oil price meeting a stated condition, such as finishing above a strike price at expiry. They do not give the holder ownership of oil. In a fixed payout contract, a large favourable price move does not produce a larger profit than a small qualifying move.
Oil adds several complications to the usual binary option calculation: WTI and Brent are different benchmarks, futures contracts have delivery months, and inventory announcements can change the price before an expiry arrives. These distinctions separate oil from other commodity binary options and make the reference price just as important as the directional forecast.
Australian retail restriction: ASIC’s ban on issuing and distributing binary options to retail clients took effect on 3 May 2021 and has been extended until 1 October 2031. This includes binary options referencing crude oil. The examples below explain contract mechanics, not a route around the restriction. See ASIC’s binary options ban extension for the regulatory position.
WTI and Brent Are Not Interchangeable
A contract labelled “oil” leaves too much unanswered. Start by identifying the benchmark.
West Texas Intermediate, or WTI, is associated with the US crude oil market. The benchmark NYMEX WTI futures contract has physical delivery at Cushing, Oklahoma, making storage and transport conditions there relevant to its pricing.
Brent is an international benchmark linked to the seaborne crude market. ICE Brent futures use an Exchange for Physical delivery mechanism, with an option to cash settle against the ICE Brent Index. These are different arrangements, not two names for one universal oil price. The ICE comparison of Brent and WTI futures sets out their market and settlement differences.
For a binary contract, the practical implication is straightforward: analyse the benchmark named in its terms. A Brent chart cannot verify a WTI settlement. Even when both move in the same direction, their prices need not cross equivalent levels at the same moment.
Identify the Price Behind the Contract
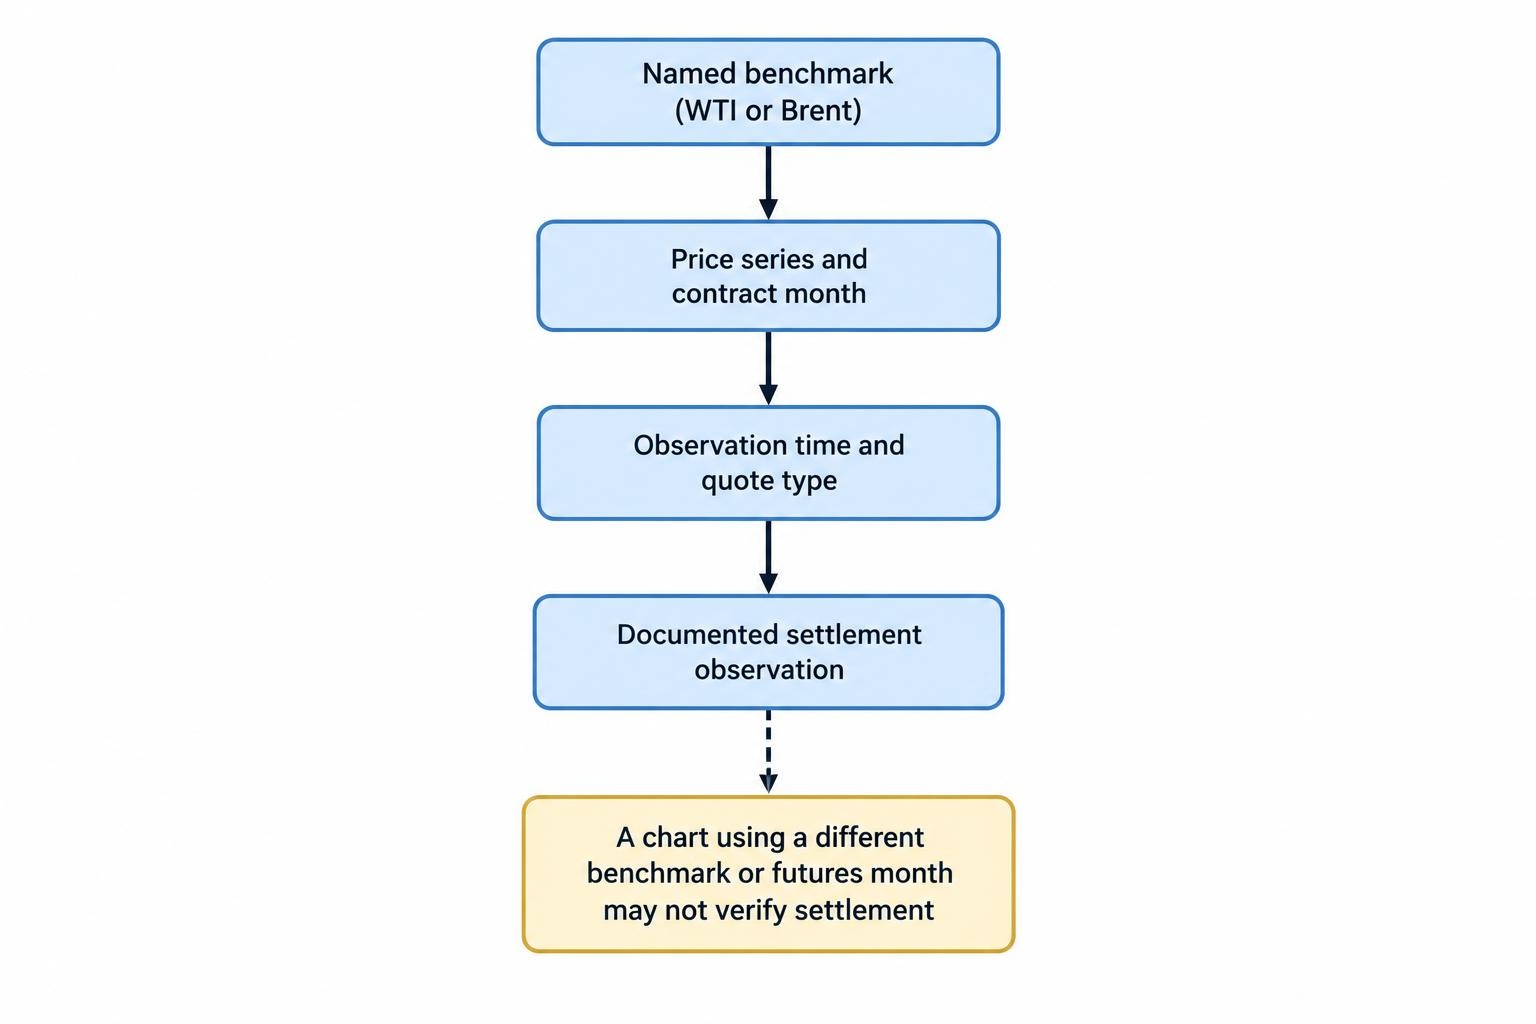
The benchmark name is only the first check. You also need the price series, contract month where relevant, observation time and settlement method.
A useful contract description should let you answer:
- Does the reference follow WTI, Brent or another oil benchmark?
- Is it a dated futures contract, a spot assessment or a calculated series?
- Which price determines settlement: a last trade, bid, ask, midpoint or another observation?
- What happens if the price feed stops, the market is closed or a quote is corrected?
Contract Months and Rollovers
Consider a hypothetical chart showing one oil futures month at US$75.00 per barrel while the following month trades at US$75.60. If the chart switches from the first contract to the second, the displayed level could rise without either contract gaining 60 cents at that instant.
That distinction matters when reviewing a breakout or checking a historical result. A change of reference contract is not the same event as a price increase within one contract. The guide to commodity spot prices, futures and rollovers covers those relationships separately.
For an oil binary, establish whether its reference changes during the contract’s life and how the terms handle that change. Do not assume that a charting service and a contract provider roll their oil series on the same date.
Chart Prices Versus Settlement Prices
Suppose an independent chart finishes at US$75.02 while the contractual reference records US$74.99 against a US$75.00 strike. Before drawing a conclusion, compare the benchmark, delivery month, timestamp, quote type and displayed precision. A rounded chart label may conceal a difference that matters at settlement.
The relevant evidence is the documented settlement observation, not whichever chart gives the preferred answer. Keep this distinction in view when checking price feeds and benchmarks.
A Worked Crude Oil Binary Option Example
The following example uses an illustrative fixed stake contract. It is not a live quote or an available Australian retail offer.
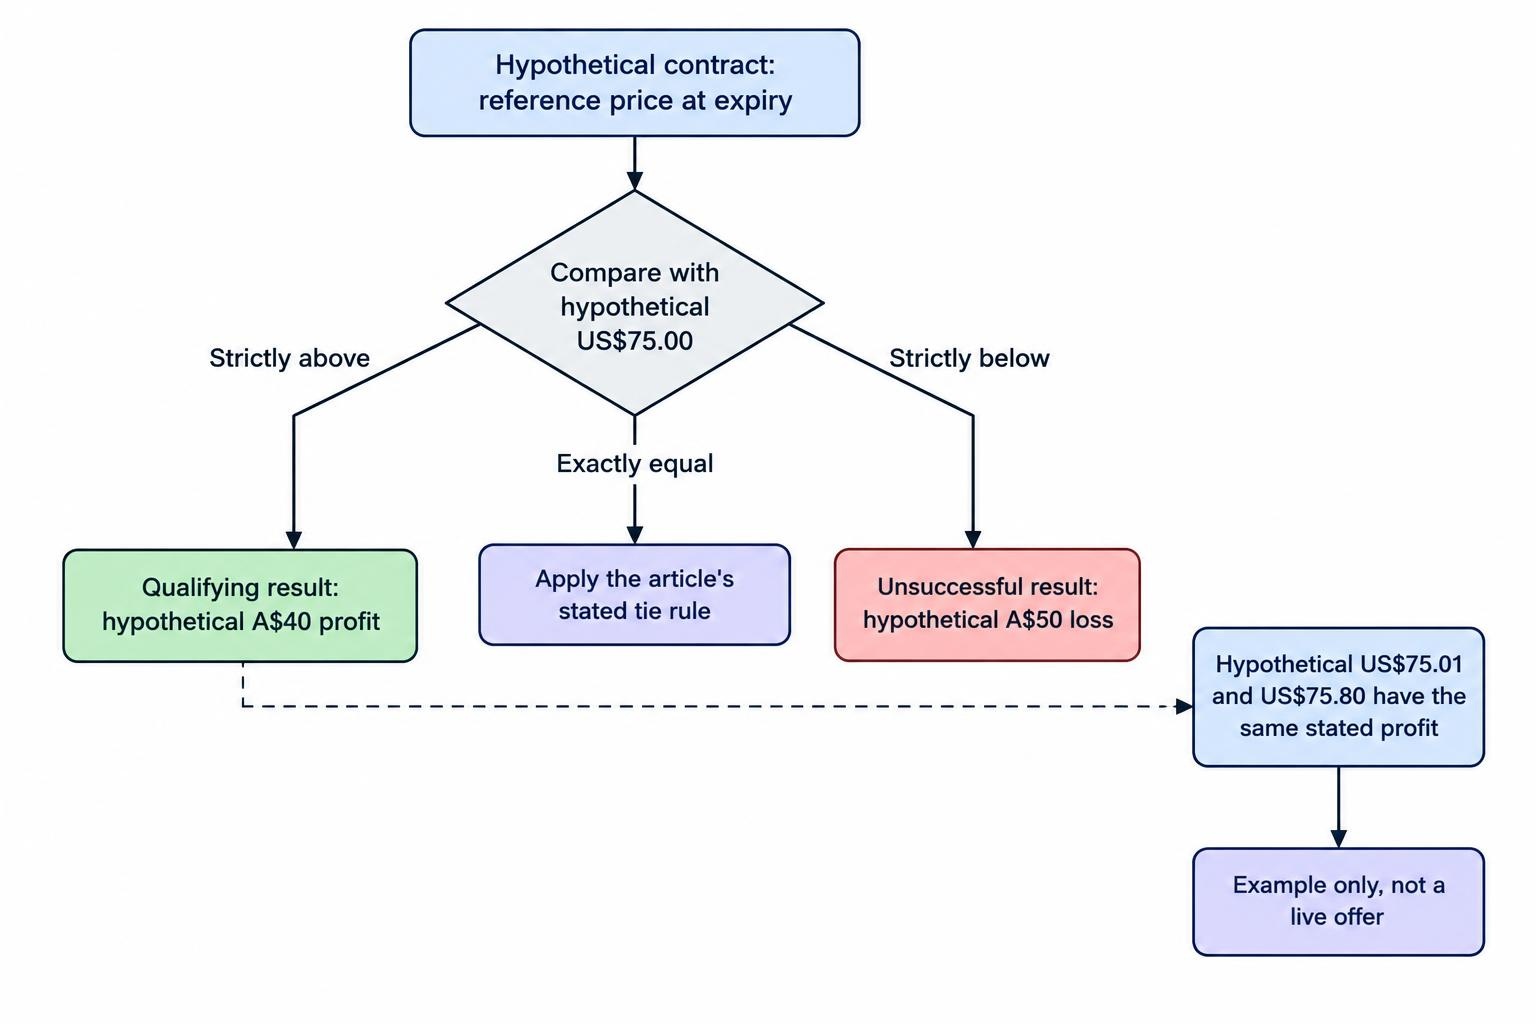
Assume a contract asks whether a stated WTI reference will finish strictly above US$75.00 per barrel at expiry. The stake is A$50, and the quoted profit on a successful result is 80% of the stake. An unsuccessful result loses the full stake.
| Reference price at expiry | Result | Net profit or loss |
|---|---|---|
| US$75.01 | Winning condition met | A$40 profit |
| US$75.80 | Winning condition met | A$40 profit |
| US$74.99 | Winning condition not met | A$50 loss |
A winning result returns A$90 in total: the original A$50 stake plus A$40 profit. Describing all A$90 as profit would overstate the result.
The size of the favourable move does not change the payoff. Finishing one cent above the strike earns the same amount as finishing 80 cents above it. Likewise, finishing one cent below can lose the entire stake.
An expiry price exactly equal to US$75.00 requires the stated tie rule. Do not assume that equality produces a refund. Also distinguish finishing above the strike from touching it earlier: this example tests the price at expiry, not the highest price reached during the contract.
The Payout Determines the Required Win Rate
An 80% profit payout is not an 80% probability of success. With that payout, a win earns 0.8 times the stake while a loss costs one full stake.
Ignoring fees and assuming every result is either a win or a full loss:
Break-even win rate = 1 ÷ (1 + profit payout rate)
At an 80% payout, the break-even win rate is approximately 55.56%. A 55% win rate would still have a negative expected result under those assumptions.
Using the A$50 example, a hypothetical 55% success probability gives an expected result of 0.55 × A$40 minus 0.45 × A$50, or a loss of A$0.50 per contract. That is a mathematical expectation, not a prediction of the next outcome.
This is why an oil forecast needs more than a plausible story. It needs a probability advantage large enough to cover the payout imbalance and any costs. The broader guide to probability and expected value in binary options develops that calculation without assuming a trading edge exists.
What Moves Crude Oil Prices?
Oil prices respond to supply, demand, inventories and expectations about their future balance. Economic growth affects fuel consumption, while production decisions affect available supply. OPEC output policy, supply disruptions, severe weather, refinery outages and transport problems can alter that balance. The EIA explanation of oil price drivers details these connections.
For a binary option, however, identifying a driver does not settle the timing question.
“Supply may tighten over the next quarter” and “WTI will finish above this strike in 15 minutes” are different propositions. The first can be reasonable while the second loses. A longer economic argument does not automatically provide evidence for a shorter expiry.
Separate three questions when reviewing an oil thesis: what changed, what the market was already expecting, and whether the contract’s observation period matches the proposed effect.
Take a hypothetical production announcement. If a reduction is smaller than the reduction assumed in the forecast, the headline alone cannot justify calling the news favourable for price. Write down the expected outcome before the announcement. Otherwise, hindsight can make almost any result appear obvious.
Reading Oil Inventory Announcements
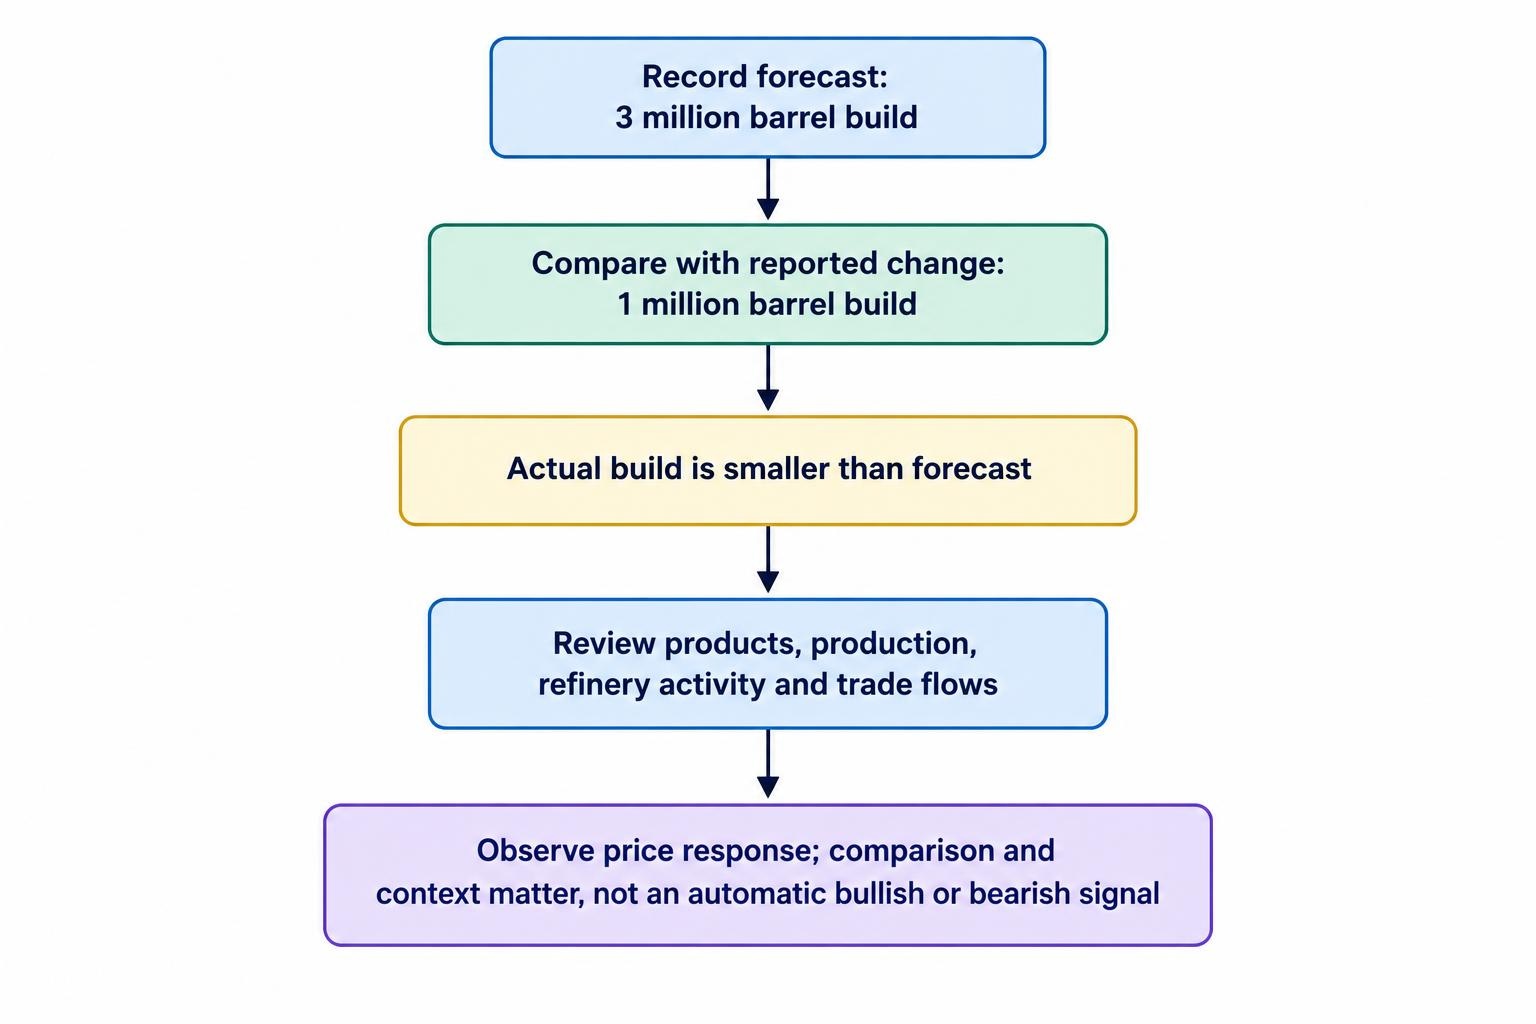
Inventory data deserve more attention than a single “stocks rose” or “stocks fell” headline. Petroleum reports include information on crude stocks, refined products, production, refinery activity and trade flows. Those figures help explain why inventories changed. CME Group’s energy fundamentals lesson connects these reports with supply, demand and market expectations.
Consider an illustrative forecast for a three million barrel increase in crude inventories. An actual increase of one million barrels is still a build, but it is smaller than expected. Calling it automatically bearish because stocks increased ignores the comparison that motivated the forecast.
The reverse problem also applies. A draw may look supportive in isolation, yet the surrounding figures could weaken that interpretation. For a paper exercise, record the expected change, actual change, other relevant report details and price response separately. Do not merge them into a story after seeing the chart.
The US Energy Information Administration normally releases its Weekly Petroleum Status Report on Wednesdays at 10:30 a.m. US Eastern time. Holidays can change both the day and time, so check the official EIA petroleum report release schedule rather than copying a recurring calendar reminder indefinitely.
Record the release time and contract expiry in the same time zone. If converting to Australian local time, use the date of the event rather than a permanent hour offset. A correct forecast written against the wrong clock is not a usable test.
Expiry Selection Changes the Question
A short expiry does not make an oil thesis simpler. It changes what must happen for the contract to succeed.
In the worked example, the reference could rise above US$75.00, fall below it at expiry, then recover immediately afterwards. The upward move and later recovery would not rescue the result. The specified observation decides settlement.
For analysis, match the evidence to the period being tested. A daily supply and demand view should not be presented as proof of where the next minute will finish. Equally, one sharp intraday move says little by itself about the following week.
Longer expiries are not automatically safer either. They create more time for the proposed move, but also more time for new information to change the premise. The guide to binary options expiry times separates duration from the probability of a successful outcome.
Assess Oil Scenarios Without Funding a Binary Account
For Australian retail readers, paper analysis offers a way to study these mechanics without treating an offshore deposit as the next step. A spreadsheet and a documented price series are enough to test whether a rule is clear and reproducible.
Before recording an outcome, write down the benchmark, reference series, hypothetical strike, observation time, payout and tie rule. State the reason for the forecast before the expiry. If an inventory announcement is involved, preserve the forecast available beforehand rather than substituting a later estimate.
Use a fixed hypothetical stake when comparing results. Increasing it after losses makes it harder to distinguish forecasting performance from a staking decision. Record net returns as well as win rate, since the same success rate can produce different results at different payouts.
Keep an untouched testing period after developing the rule. Repeatedly changing a method to fit past oil moves does not show how it will handle unseen observations. The paper trading guide provides a broader framework for maintaining those records.
The standard for reviewing a crude oil binary is exactness: the right benchmark, the right price series, the right clock and the correct payoff calculation. If any of those remain unclear, a confident opinion about oil’s direction cannot fill the gap.
This article was last updated on: October 22, 2026