AUD/JPY binary options use the Australian dollar’s exchange rate against the Japanese yen as their reference price. In a standard higher/lower contract, the result depends on whether that price finishes above or below an agreed strike at expiry. You are not buying Australian dollars or holding yen: you are taking a contract with a predefined settlement condition.
For Australian retail readers, the legal position comes first. ASIC’s prohibition on issuing and distributing binary options to retail clients began on 3 May 2021 and extends until 1 October 2031. The ASIC notice extending the binary options ban sets out that restriction. The examples below are educational paper exercises, not instructions to open a funded account.
How to Read the AUD/JPY Price
AUD is the base currency and JPY is the quote currency. An AUD/JPY price of 99.00 means one Australian dollar is worth 99 Japanese yen. A move to 99.20 represents Australian dollar appreciation against the yen; a move to 98.80 represents depreciation.
For this pair, one pip conventionally equals 0.01 yen. A rise from 99.00 to 99.20 is therefore 20 pips. Some displays show another decimal place, but extra screen precision does not change the contract’s settlement rules.
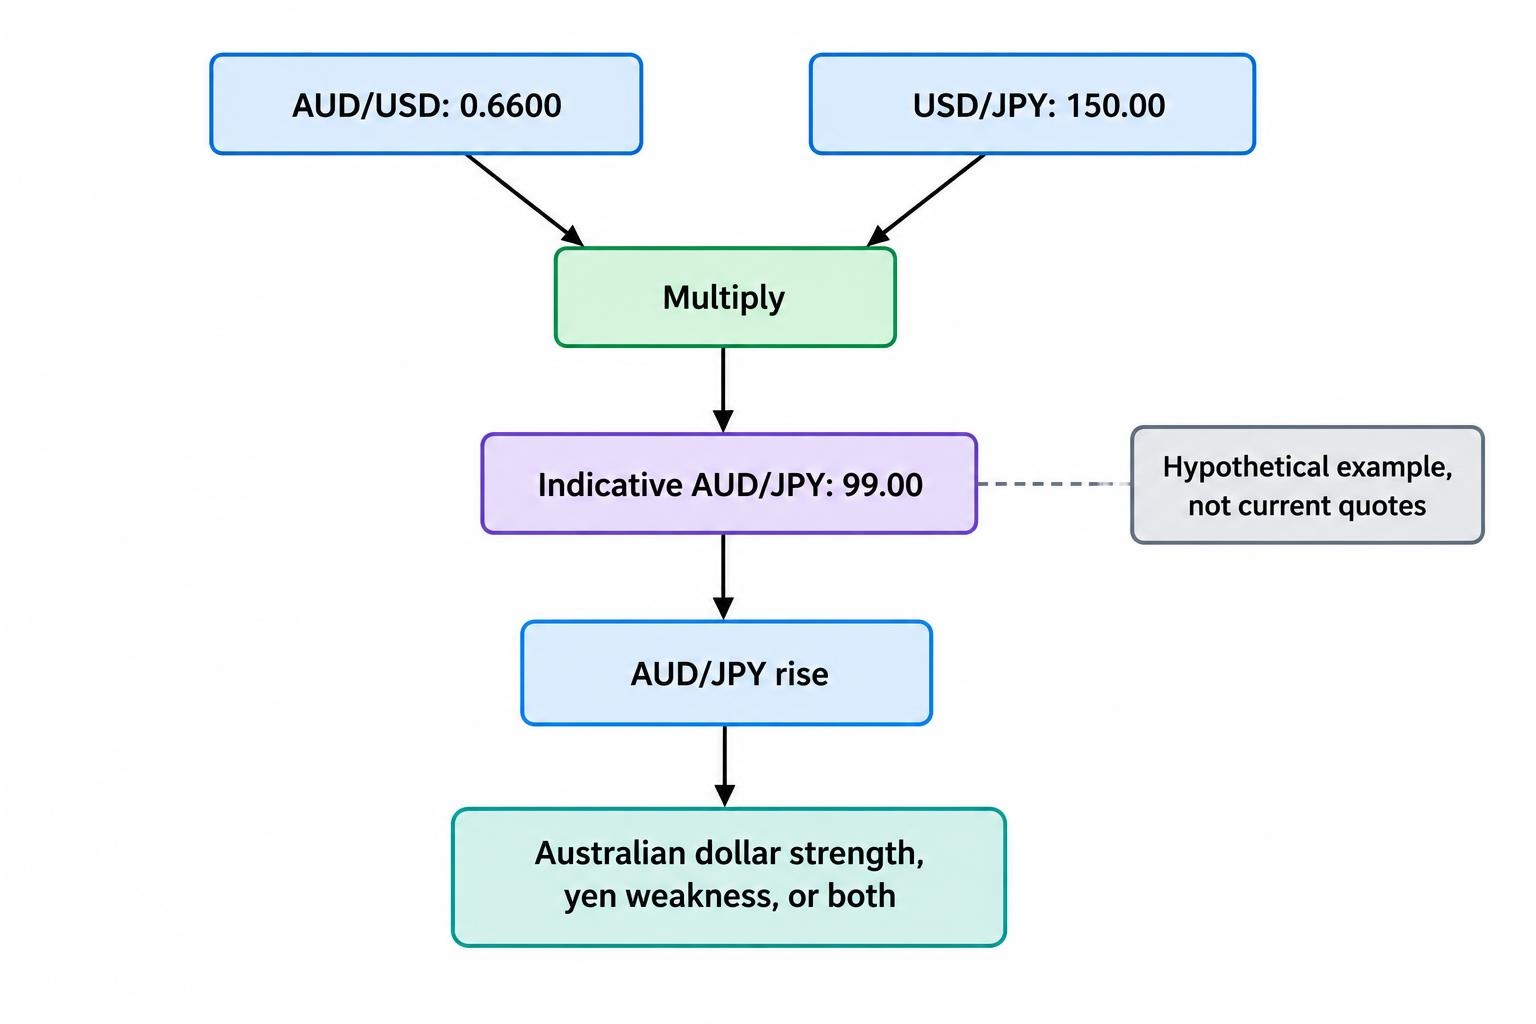
AUD/JPY is a currency cross because neither side is the US dollar. However, dollar movements can still help explain its price. Using consistent quotes taken at the same time:
AUD/JPY = AUD/USD × USD/JPY
For example, an AUD/USD rate of 0.6600 multiplied by a USD/JPY rate of 150.00 gives an indicative AUD/JPY rate of 99.00. These are hypothetical prices, not current market quotes.
This relationship provides a useful diagnostic. An AUD/JPY rise could reflect Australian dollar strength, yen weakness, or both. Looking at only one currency leaves half the explanation missing. The broader guide to forex markets for binary options covers the currency-pair structure shared with other markets.
A Worked AUD/JPY Binary Options Example
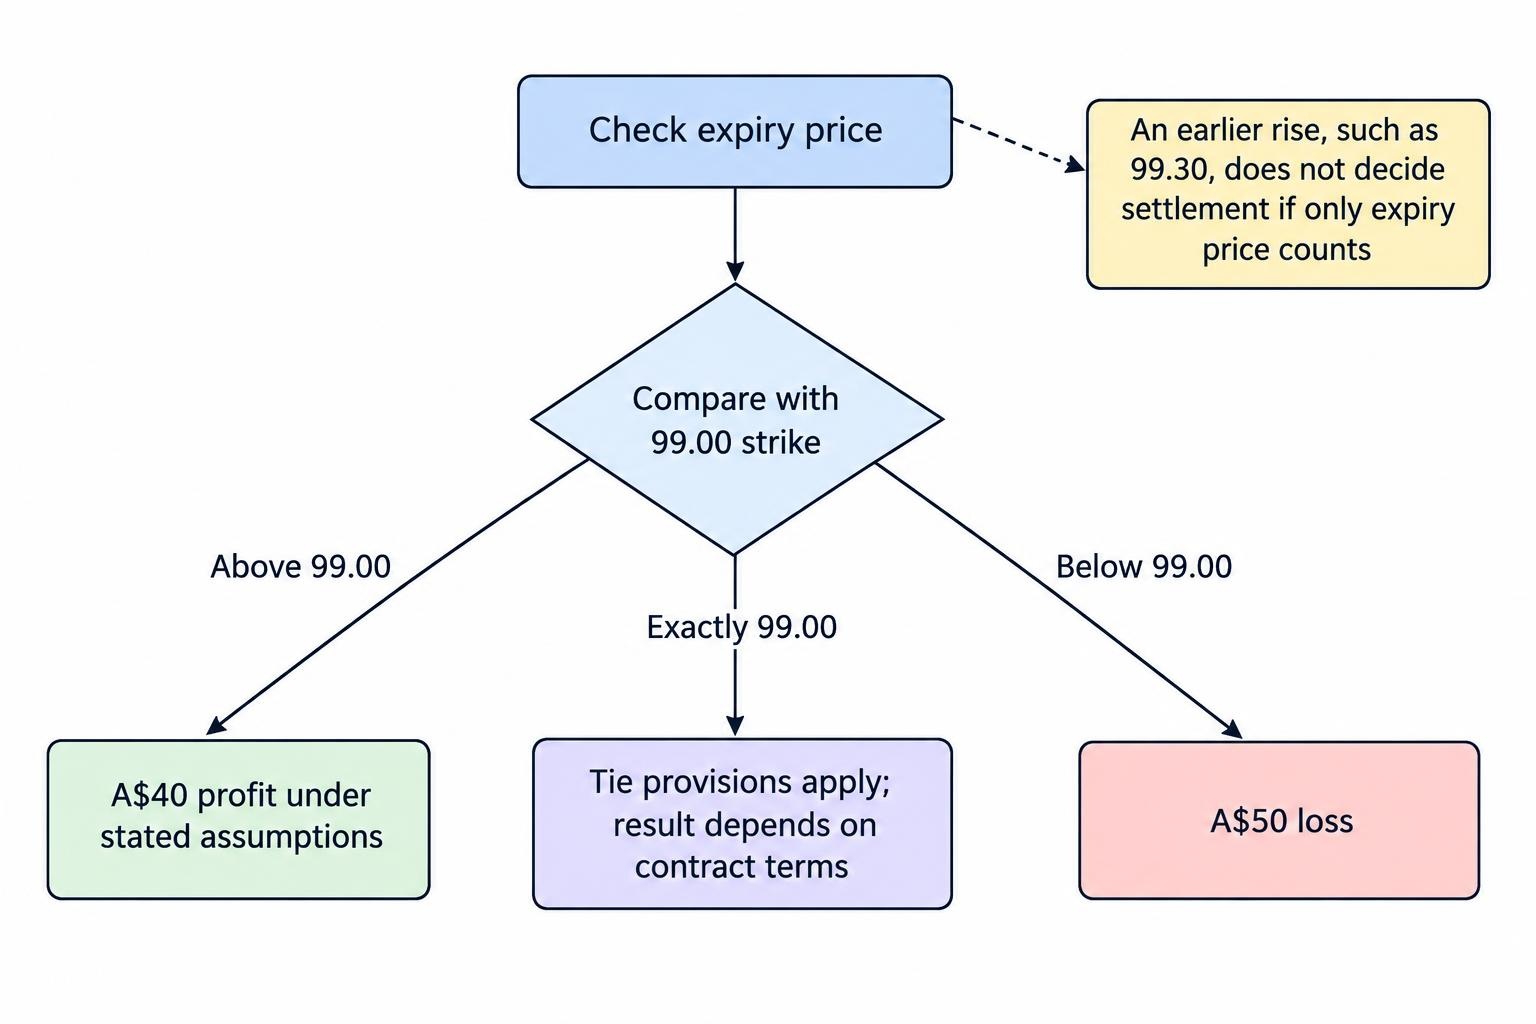
Consider a hypothetical higher contract with a strike of 99.00, a ten-minute expiry and an A$50 stake. Assume a successful result earns 80% profit on the stake, with the original stake also returned. An unsuccessful result loses the full A$50.
| Settlement price | Outcome under these assumptions | Net result |
|---|---|---|
| 99.08 | Above the strike; A$90 returned | A$40 profit |
| 98.99 | Below the strike; nothing returned | A$50 loss |
| 99.00 | Exactly at the strike; tie provisions apply | Depends on the contract terms |
Under those assumptions, finishing eight pips above the strike earns the same profit as finishing eighty pips above it. Finishing one pip below loses the same stake as finishing much further below. Movement size does not scale the payment in this higher/lower example.
The price path also needs separating from the final result. AUD/JPY could rise to 99.30 during the exercise, then settle at 98.99. The higher contract would still lose if only the expiry price determines settlement. A correct forecast of an earlier move is not necessarily a correct forecast of the contract outcome.
What Moves AUD/JPY?
Australian and Japanese interest-rate expectations
The difference between Australian and Japanese interest rates can influence demand for their currencies. Other things equal, a rise in Australian rates relative to Japanese rates makes Australian interest-bearing assets more attractive and can support the Australian dollar. The RBA explanation of Australian dollar drivers describes this relationship and the role of capital flows.
For analysis, distinguish an announced decision from the change in expectations it produces. A paper exercise might ask: was the decision anticipated, did the accompanying statement change the outlook, and what happened to AUD/JPY afterwards? Avoid reducing the exercise to “higher rates means higher currency”.
A binary contract does not itself collect the interest-rate difference between the two currencies. Its payment follows its own terms. Interest rates belong in the explanation of the underlying exchange rate, not as an extra income stream attached to a higher/lower position.
Commodity demand and the growth outlook
Commodity prices affect Australia’s export income and terms of trade, making them relevant to Australian dollar analysis. Demand from China can matter through this channel. However, the reason for a commodity-price move matters too: stronger demand and a temporary supply disruption need not have the same currency effect. The RBA research on exchange-rate determinants documents that distinction.
The practical implication is to test the explanation rather than adopt a slogan. “Iron ore rose, so AUD/JPY must rise” overlooks the yen side of the pair and the time horizon of the forecast.
In a paper study, separate observations around commodity-related news from ordinary sessions. Do not assume a relationship observed across weeks can identify which side of a strike the price will occupy ten minutes later.
Risk aversion and yen-funded positions
The yen has appreciated during some periods of financial stress, including episodes involving the unwinding of yen-funded carry trades. A carry trade involves funding an investment in a lower-interest currency to hold an asset offering a higher return. Bank of Japan working-paper research on yen exchange-rate behaviour examines historical episodes involving risk aversion and carry-trade unwinding.
This provides a possible explanation for an AUD/JPY decline during market stress, not a standing sell signal. The circumstances behind each episode still matter.
For a research journal, write down what would support the risk-aversion explanation and what would contradict it. Then compare that explanation with alternatives, such as an Australian data surprise or a change in expectations for Japanese policy. Labelling every falling candle “risk off” adds little analytical value.
News Timing and the Observation Window
A useful AUD/JPY study should check Australian and Japanese announcements rather than focus exclusively on one country. Candidate events include monetary-policy decisions, inflation figures, employment releases and central-bank communications. Chinese economic announcements also belong on the watchlist when testing a commodity-demand explanation.
Use an economic calendar to organise the observation window, then verify the release details with the publishing institution. Record the event time, chart time zone and hypothetical expiry. Do not copy an old screenshot’s clock setting and assume it still matches the session being studied.
For each exercise, distinguish three periods: before the announcement, the initial response and the subsequent movement. This prevents a common research mistake: choosing whichever part of the chart makes the original forecast look correct.
There is no need to declare one session universally “best” for AUD/JPY. A more useful question is whether a clearly defined observation window produces repeatable results under the same rules. A convenient time to watch the screen is not evidence of a profitable method.
Match the Forecast to the Expiry
An AUD/JPY forecast needs both a direction and a deadline. “The Australian dollar should strengthen against the yen” is incomplete for a contract that settles at a fixed time.
Suppose a paper study identifies a rising trend on an hourly chart. That observation does not establish whether the next one-minute price change will be positive. Conversely, a brief upward move does not prove that a longer-term trend has changed.
Keep the analysis interval, assumed entry and expiry separate. A five-minute candle describes a price interval; it does not automatically justify a five-minute contract. The guide to binary options expiry times covers those timing distinctions.
For a disciplined comparison, define two hypothetical expiries before observing the outcome, perhaps ten minutes and thirty minutes. Record both results without choosing the better one afterwards. If the shorter exercise loses and the longer one wins, that difference is a finding to investigate, not permission to rewrite the original rule.
Longer expiries are not automatically safer. They change the forecast window and may include more events. Shorter expiries are not automatically more precise either. An expiry does not wait for the economic argument to catch up.
Check the Reference Price, Not Just the Chart
Spot foreign exchange is an over-the-counter market rather than a single central exchange with one universal last-traded price. Dealers and trading venues form a decentralised market structure, documented in the BIS research on foreign-exchange execution. An independent chart should therefore not automatically be treated as the settlement record for a separate contract.
For an AUD/JPY paper exercise, identify the feed used, its displayed precision and whether the recorded price is a bid, ask or midpoint. Keep that convention consistent throughout the study.
Also define how the expiry observation is selected. Is it the last available quote before the deadline, the first quote afterwards, or another stated method? If historical data cannot reproduce the proposed settlement method, mark the result as uncertain rather than awarding a convenient win.
This matters most near the strike. A chart that visually appears level with 99.00 may not establish an exact tie. Rounded labels and candle images are poor substitutes for a timestamped price record.
Judge Results Against the Payout
AUD/JPY does not escape payout arithmetic. Under the earlier assumptions, each successful A$50 exercise earns A$40 while each unsuccessful one loses A$50.
Five wins and five losses would therefore produce A$200 in profits against A$250 in losses: a net loss of A$50. Getting half the forecasts right would not break even.
With an 80% profit payout, full-stake losses, no fees and no ties, the theoretical break-even win rate is:
1 ÷ (1 + 0.80) = approximately 55.56%
That threshold is arithmetic, not a forecast of achievable performance. A historical win rate above it can still reflect chance, favourable sample selection or assumptions that cannot be reproduced. The guide to probability and expected value in binary options develops the calculation.
Keep the assumed payout attached to every recorded result. If payouts differ between observations, calculate the monetary outcome for each one rather than judging the study by win rate alone. A higher percentage of correct predictions does not necessarily produce a better financial result.
A Practical AUD/JPY Paper Study
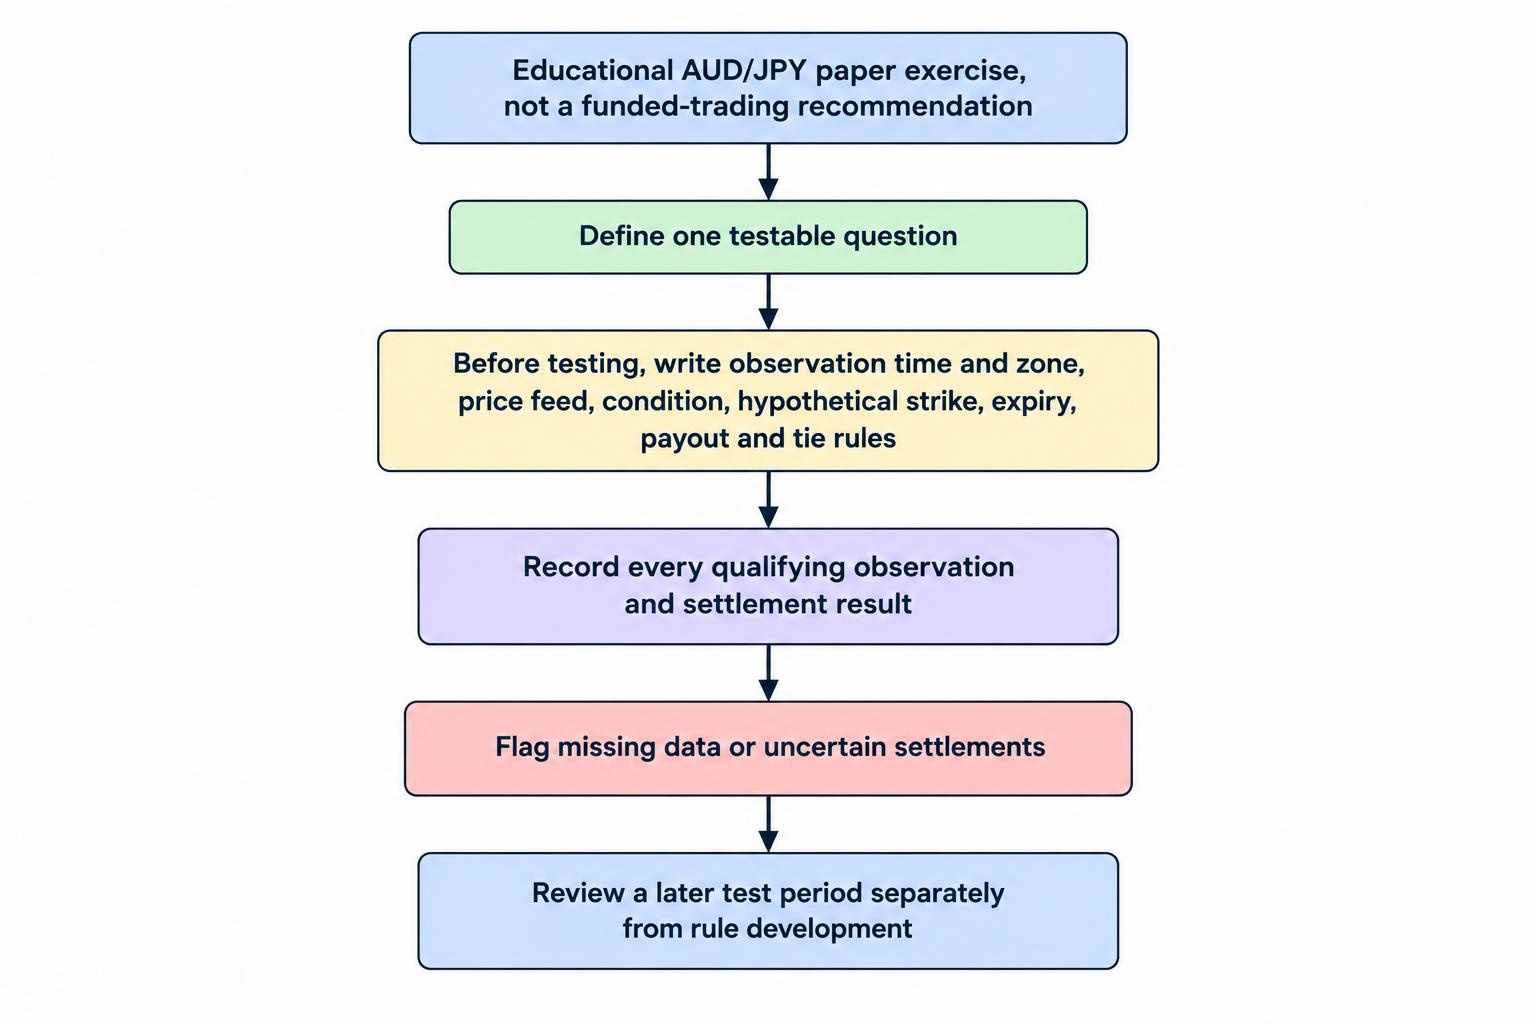
Start with one testable question, such as whether a defined trend condition has different hypothetical outcomes before and after scheduled announcements. Avoid combining several indicators, multiple expiries and discretionary exceptions before establishing a clear baseline.
Write the rules before examining the test period. At minimum, record:
- The observation time, time zone and AUD/JPY price feed.
- The condition being tested and the hypothetical strike.
- The expiry, payout assumption and tie treatment.
- The settlement observation and calculated result.
- Any missing data or departure from the original rules.
Include every qualifying observation, not just attractive charts. Keep the initial rule-development period separate from a later test period, and leave uncertain settlements labelled as uncertain.
A structured binary options practice plan can help maintain that consistency. The purpose is to assess a claim without putting money at risk, not to manufacture confidence for a deposit.
AUD/JPY offers a useful case study because analysing it requires attention to both currencies, the forecast deadline and the reference price. None of those replaces the contract arithmetic or Australia’s retail restriction. Treat the pair as a subject for disciplined research, not as a shortcut around either.
This article was last updated on: October 22, 2026