Momentum trading strategies look for price movement that may continue in the same direction. In binary options, that means more than spotting a strong candle: the price must finish on the correct side of the accepted strike at the chosen expiry. A correct view of market direction can still produce a losing contract.
For Australian retail readers, this is an educational topic, not an invitation to open an account. ASIC’s prohibition on issuing and distributing binary options to retail clients took effect on 3 May 2021 and has been extended until 1 October 2031. The ASIC announcement extending the binary options ban sets out the product risks behind that decision. The setups below are hypotheses for paper testing, not demonstrated profitable strategies.
What Momentum Measures
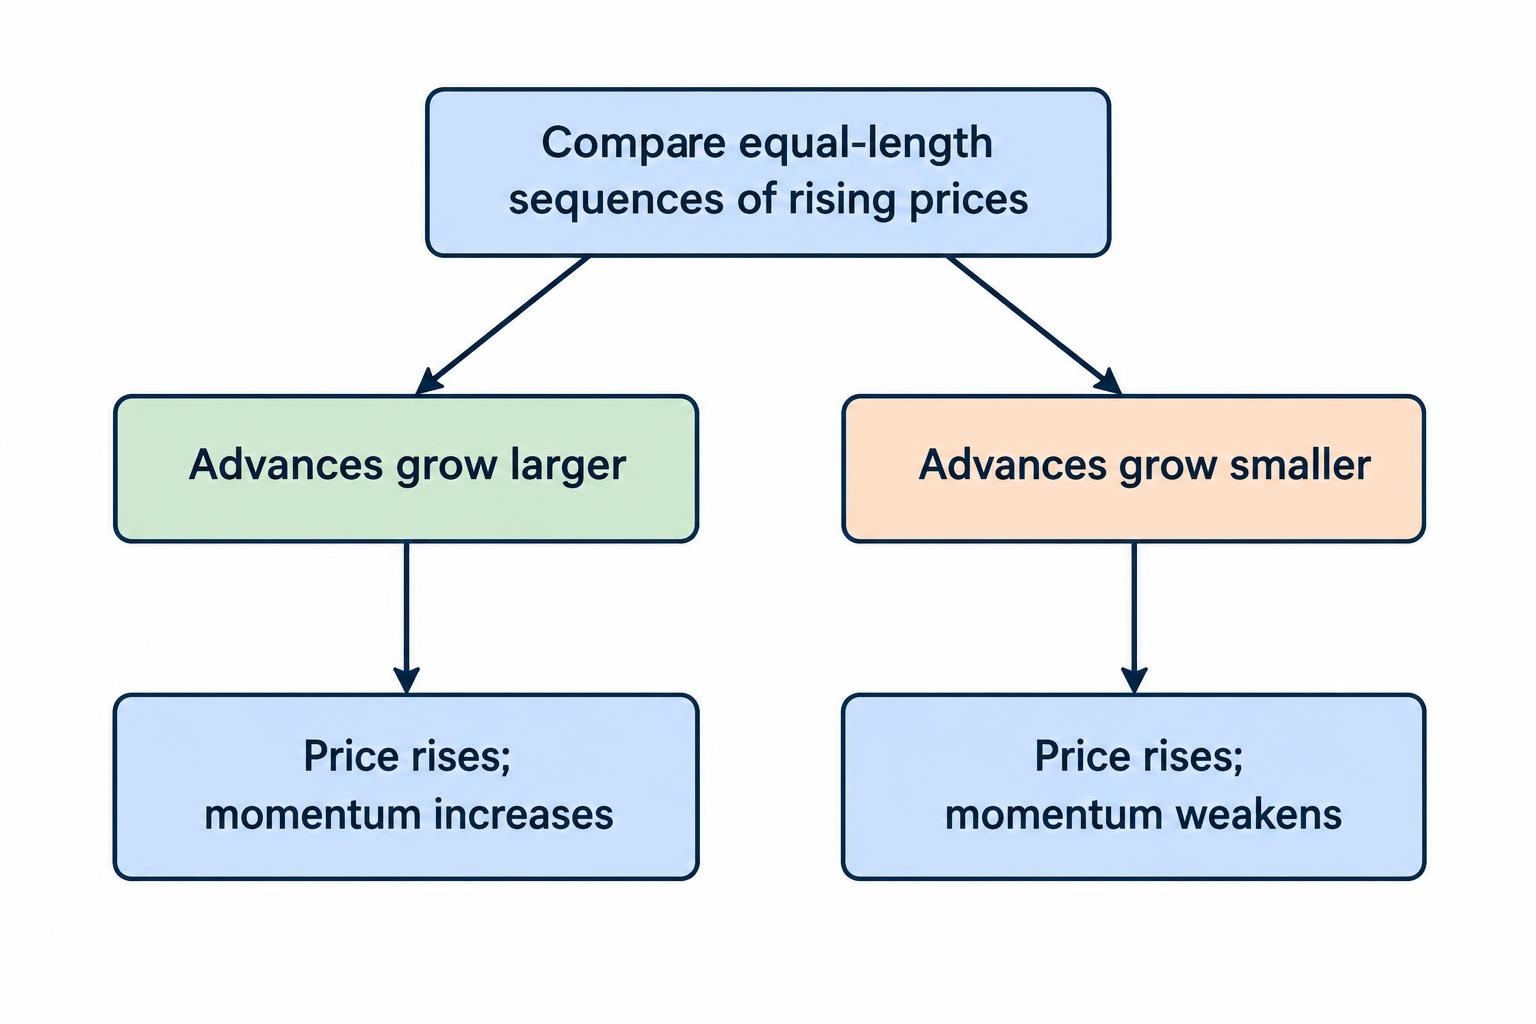
Momentum measures the direction and strength of recent price movement. Trend describes the broader path. The distinction matters: a market can remain in an upward trend while its latest advance loses speed.
Consider two sequences of equal length. In the first, price rises by progressively larger amounts. In the second, price continues rising, but each advance gets smaller. Both sequences point upward; only the first shows increasing price momentum under that simple measurement.
Academic evidence needs careful handling here. The Moskowitz, Ooi and Pedersen study of time series momentum examined 58 futures and forward instruments and found return persistence over horizons of one to 12 months. That is not evidence that a five minute binary option following three rising candles has positive expected value. Different instruments, holding periods and payoff structures require separate testing.
For binary options research, the relevant question is narrow: does a defined momentum signal predict settlement above or below the accepted strike often enough to overcome the payout disadvantage?
Build a Signal That Can Be Measured
A useful research setup separates market direction from the entry trigger. Start with one tool for each job rather than stacking indicators until the chart resembles an aircraft cockpit.
A moving average can provide a directional filter. An upward hypothesis might require the latest completed close to sit above a rising 20 period exponential moving average. Define “rising” precisely, such as the average being higher than it was three completed candles earlier. The separate guide to moving averages covers their calculation and interpretation.
Rate of change, or ROC, can measure recent movement. A five period ROC compares the current close with the close five candles earlier:
ROC = ((current close ÷ close five periods earlier) − 1) × 100
Positive ROC means price has risen over that window. An increase from the previous ROC reading means the measured return has strengthened. Neither observation establishes what happens next.
Use completed candles throughout. An unfinished candle can briefly satisfy a rule and then close without meeting it. Recording the final chart appearance as though it was available earlier introduces information the paper trader did not possess.
Two Momentum Setups for Paper Testing
The following setups illustrate how to turn an idea into repeatable rules. The periods and thresholds are arbitrary starting points, not recommended settings. Test each setup separately so that one cannot conceal the other’s losses.
Impulse Acceleration
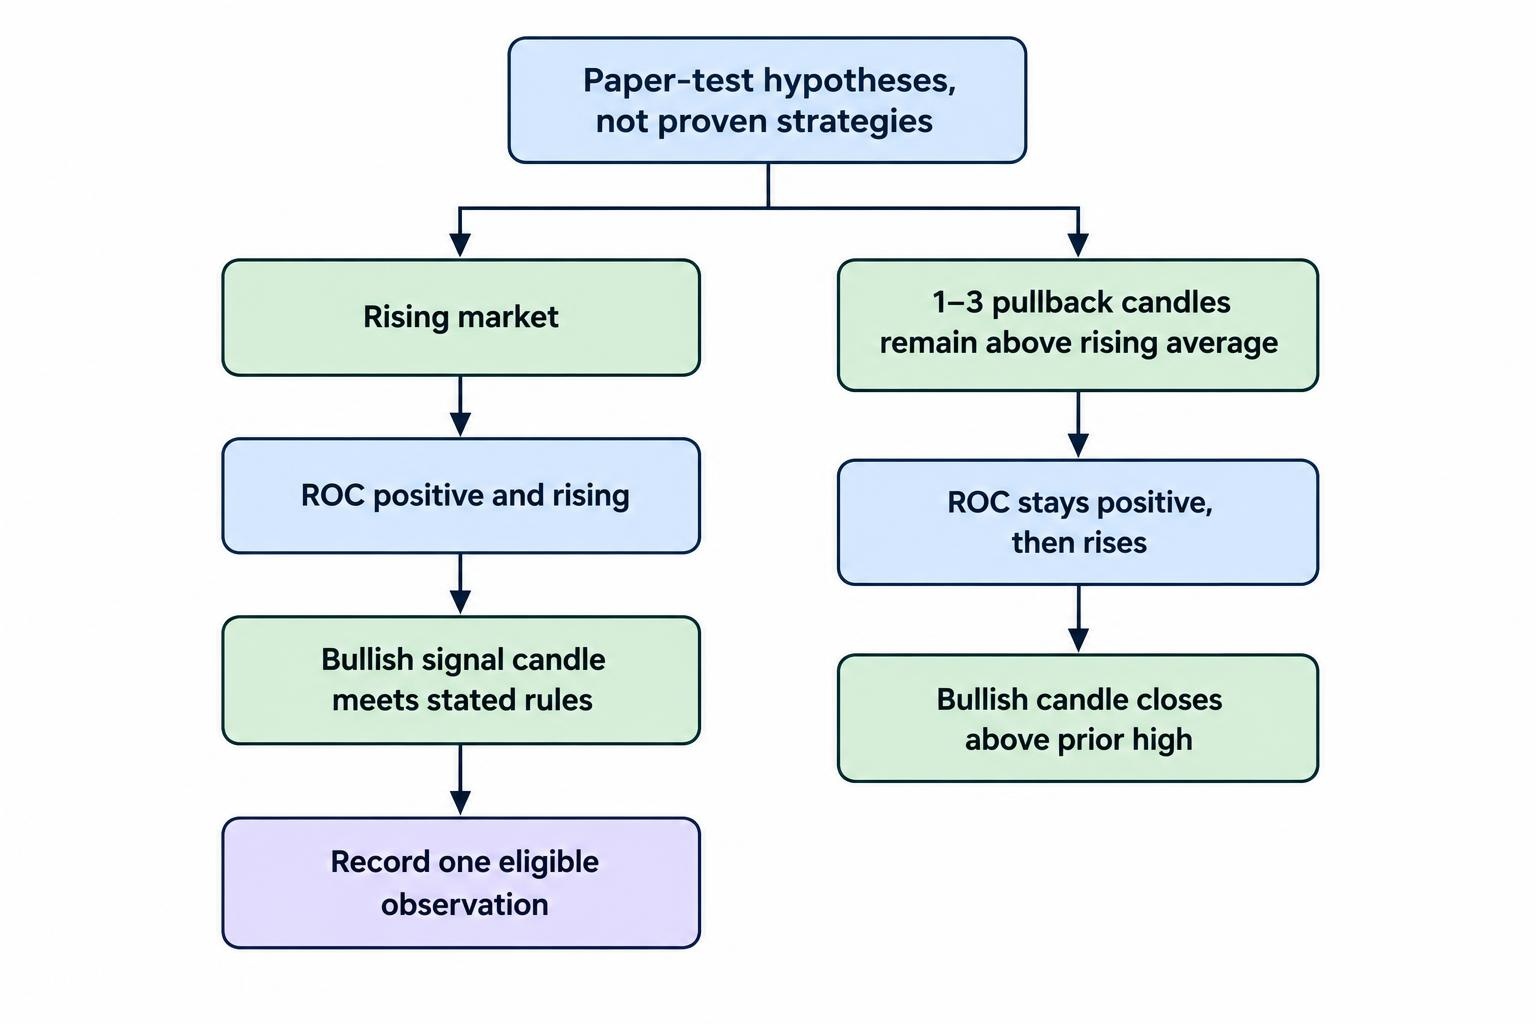
This setup looks for renewed upward pressure within an already rising market. A sample long signal could require all four conditions:
- The latest completed close is above the 20 period exponential moving average, which is higher than three candles earlier.
- Five period ROC is positive and higher than its previous reading.
- The signal candle closes above its opening price, with its body occupying at least 60% of its full high to low range.
- The close falls within the upper quarter of that candle’s range.
For a downward hypothesis, reverse the conditions: price below a falling average, negative ROC becoming more negative, and a bearish candle closing near its low.
Before recording results, define when a signal becomes eligible again. Otherwise, five consecutive qualifying candles could become five entries on essentially the same move. One research rule is to allow only one observation until the ROC acceleration condition has first stopped qualifying.
Pullback and Reacceleration
This version waits for momentum to ease before it strengthens again. An upward hypothesis could require one to three pullback candles that close above the rising moving average, followed by a bullish candle closing above the previous candle’s high.
Require ROC to remain positive during the pullback and rise again on the signal candle. This distinguishes the proposed setup from buying every dip in an upward trend.
The trade-off is straightforward. Waiting may produce a different entry price, but the move may resume without qualifying. Record missed moves as missed moves, not hypothetical winners. A strategy does not get paid for being almost triggered.
Match the Signal to a Defined Expiry
A chart interval and a contract duration are different settings. A signal on a five minute chart does not establish that a five minute expiry is suitable. Nor does using a longer expiry automatically make the signal safer.
Define the outcome horizon before testing. One experiment might measure settlement five minutes after the recorded entry; another might use 15 minutes. Keep their results separate rather than selecting whichever expiry would have won each historical example.
Also distinguish a fixed clock expiry from a duration measured after acceptance. A contract expiring at 10:15 gives different remaining time to entries accepted at 10:10 and 10:13. The guide to binary options expiry times covers these timing differences.
A useful initial study measures outcomes at a few predefined horizons. Look for results that persist across nearby settings rather than a single unusually successful duration. Repeatedly changing the expiry until a backtest turns profitable tests your ability to fit old data, not the original hypothesis.
A Worked Example: Right Direction, Losing Contract
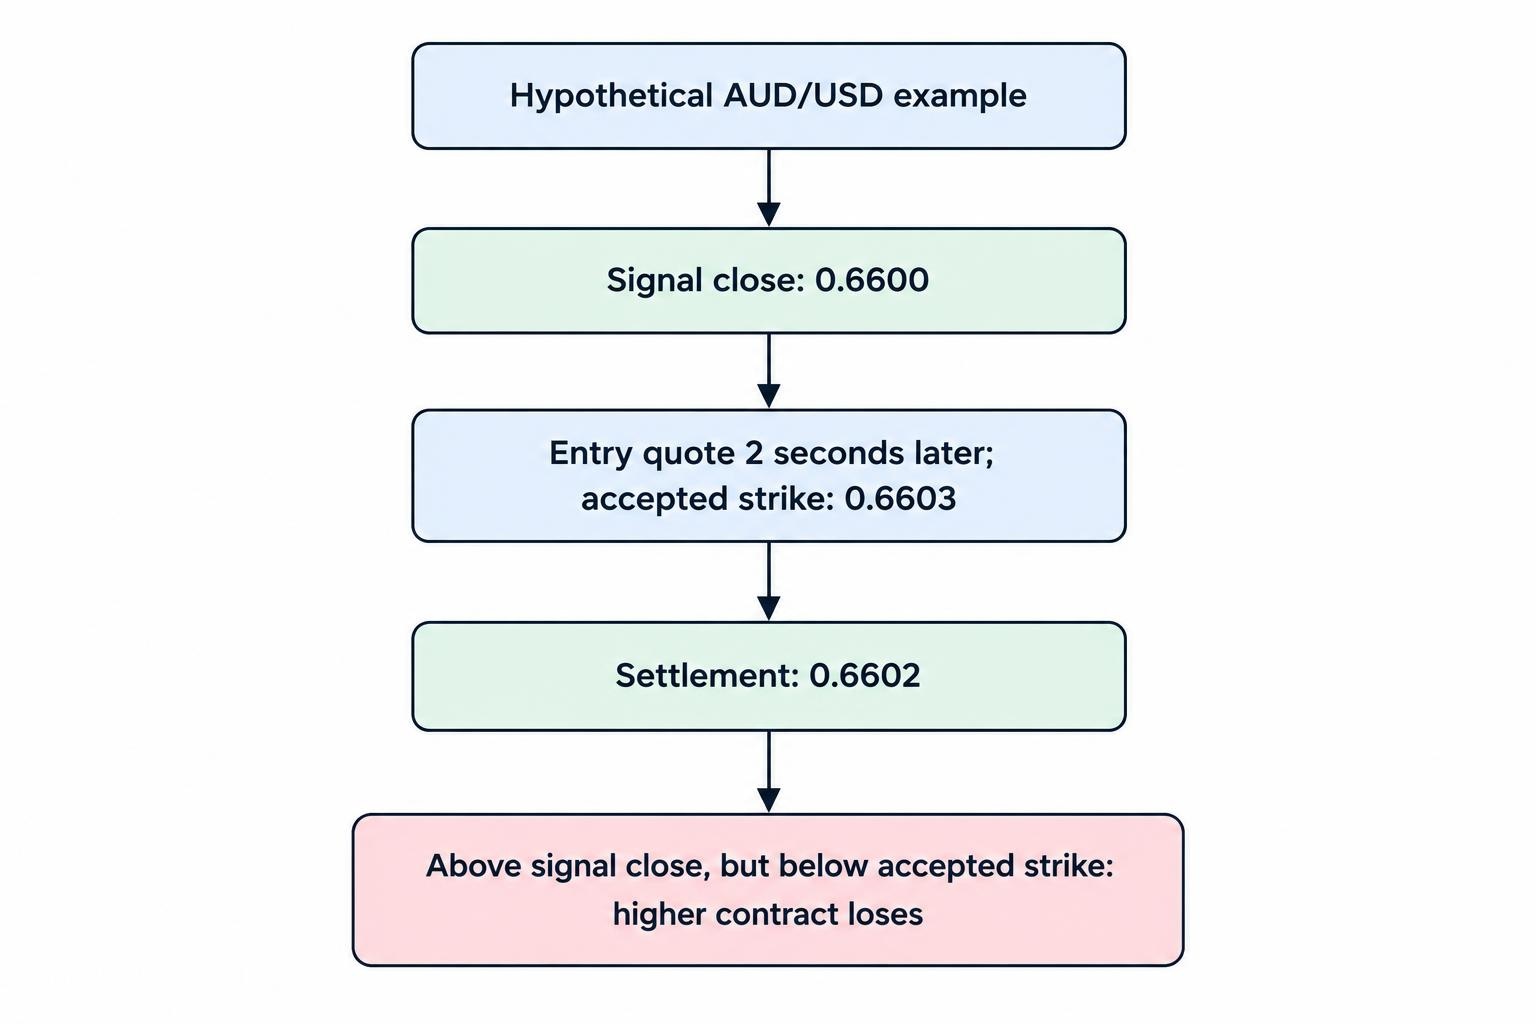
Suppose a hypothetical AUD/USD signal candle closes at 0.6600. It meets the upward momentum rules, and the paper test uses a fixed expiry five minutes later.
The first available entry quote arrives two seconds after the signal and sets the strike at 0.6603. At expiry, the stipulated settlement price is 0.6602.
Price finished above the signal close, so a chart based study using 0.6600 as its entry would mark a win. But a higher contract with an accepted strike of 0.6603 loses under terms requiring settlement strictly above that strike.
That difference is not a minor bookkeeping issue. The entry price is part of the strategy. Record the signal timestamp, first eligible quote, accepted strike and expiry separately. Apply a predefined entry tolerance, and reject observations where the quote has already moved beyond it. More detail belongs in the guide to binary options execution and latency.
If reliable historical quotes are unavailable, label the result as a signal study rather than an executable contract backtest.
Momentum Must Beat the Payout Mathematics
A directional signal can win more often than it loses and still lose money. For a fixed stake contract that loses the entire stake on failure, the required win rate depends on the net profit paid on a win.
Break-even win rate = 1 ÷ (1 + net profit rate)
| Net profit on a winning stake | Break-even win rate |
|---|---|
| 70% | 58.82% |
| 80% | 55.56% |
| 90% | 52.63% |
Here, an 80% payout means an $8 net profit on a $10 winning stake, with the original $10 also returned. It does not mean that the total returned is $8.
Consider 100 hypothetical observations with 56 wins and 44 losses, each using a $10 stake. At an 80% net profit rate, the wins earn $448 and the losses cost $440: an $8 net gain before other costs. At 70%, the same outcomes produce a $48 net loss.
This is why a momentum strategy needs both outcome records and payout records. The guide to probability and expected value in binary options develops the calculation further. A narrow historical margin above break-even is not persuasive evidence of a dependable edge.
Define When the Setup Does Not Apply
Exclusions should be written before testing, not added after an inconvenient loss. Possible research filters include rejecting unusually large signal candles, avoiding predefined economic announcement windows, or excluding periods with missing quotes.
Each filter creates another hypothesis. A rule excluding candles larger than twice the median range of the previous 20 candles can be tested. “Avoid candles that look exhausted” cannot be applied consistently without further definition.
Keep the distinction between momentum and chasing clear. A strong signal that occurred several candles ago is not a fresh signal simply because price is still moving. Use an eligibility window and reject late entries rather than changing the strike assumption to preserve an attractive chart example.
Do not assume several agreeing indicators provide independent confirmation. If they all transform the same closing prices, their agreement may repeat similar information rather than add new evidence.
Test the Rules Without Rewriting the Results
Begin with a written specification covering the market, session, candle interval, indicator settings, entry timing, expiry, payout assumptions and treatment of ties. Include rules for missing observations and overlapping signals.
Develop the idea on one chronological portion of data, then evaluate the frozen rules on a later portion. Keep a record of every version tried. Testing many combinations and reporting only the winner hides the selection process that produced it.
Report more than a headline win rate. Show the number of observations, net result under the assumed payouts, losing sequences, and results by session or market. Treat nearby entries during one price move as potentially related observations, not automatically as independent evidence.
Then conduct forward testing with rules fixed in advance. Log signals as they occur and retain rejected entries as well as accepted ones. A timestamped record is more useful than a folder of screenshots selected after settlement.
If the paper account supplies simulated prices or payouts, say so. Its results describe that simulation. They do not establish that equivalent contracts could have been entered, settled and withdrawn under real conditions.
Keep Strategy Risk Separate From Platform Risk
No momentum rule fixes unreliable settlement or a refusal to return funds. The SEC’s binary options fraud warning documents complaints involving withdrawal refusals, identity theft and alleged manipulation of trading software. These are platform risks, not weaknesses that another indicator can repair.
Within a paper test, hold the assumed stake constant while evaluating the signal. Increasing it after losses changes the risk profile without improving the signal’s predictive ability. Several entries following the same burst of momentum can also concentrate exposure to one reversal.
A useful momentum study ends with a reproducible answer, including a negative one. The setup needs measurable rules, realistic entry assumptions, a fixed settlement horizon and results that survive the payout calculation. Without those, a convincing chart remains a convincing chart—not evidence of a profitable binary options strategy.
This article was last updated on: October 22, 2026