Winning more binary options trades than you lose does not necessarily mean making money. If a winning trade earns $80 but a losing trade costs $100, a 50% win rate produces a loss. Probability measures the chance of winning; expected value combines that chance with the money gained or lost.
For Australian readers, this is an educational calculation, not a route around regulation. ASIC’s prohibition on issuing and distributing binary options to retail clients took effect on 3 May 2021 and was extended until 1 October 2031 under its binary options product intervention order. The examples below are hypothetical.
Probability and Expected Value Measure Different Things
Probability answers: how likely is this contract to finish with a winning outcome? Expected value, usually shortened to EV, answers: what is the probability weighted average profit or loss?
A contract can have a high chance of winning and still offer negative expected value if its profit is too small relative to its possible loss. Conversely, a lower probability outcome can offer positive mathematical EV if the reward adequately compensates for the risk.
The difficult part is not calculating EV. It is establishing a defensible probability rather than putting a precise number on a hunch.
The Binary Options Expected Value Formula
For a contract with two outcomes, the general formula is:
EV = (probability of winning × net profit on a win) − (probability of losing × loss on a loss)
Assume a hypothetical contract has these terms:
- A stake of A$100.
- An 80% net profit on a winning trade: A$80, plus the original stake returned.
- A loss of the full A$100 stake on an unsuccessful trade.
- No fees, refunds or ties.
The winning account credit is A$180, but the profit is only A$80. Confusing those figures overstates EV. The distinction between net profit and total money returned is covered in the guide to binary options payouts.
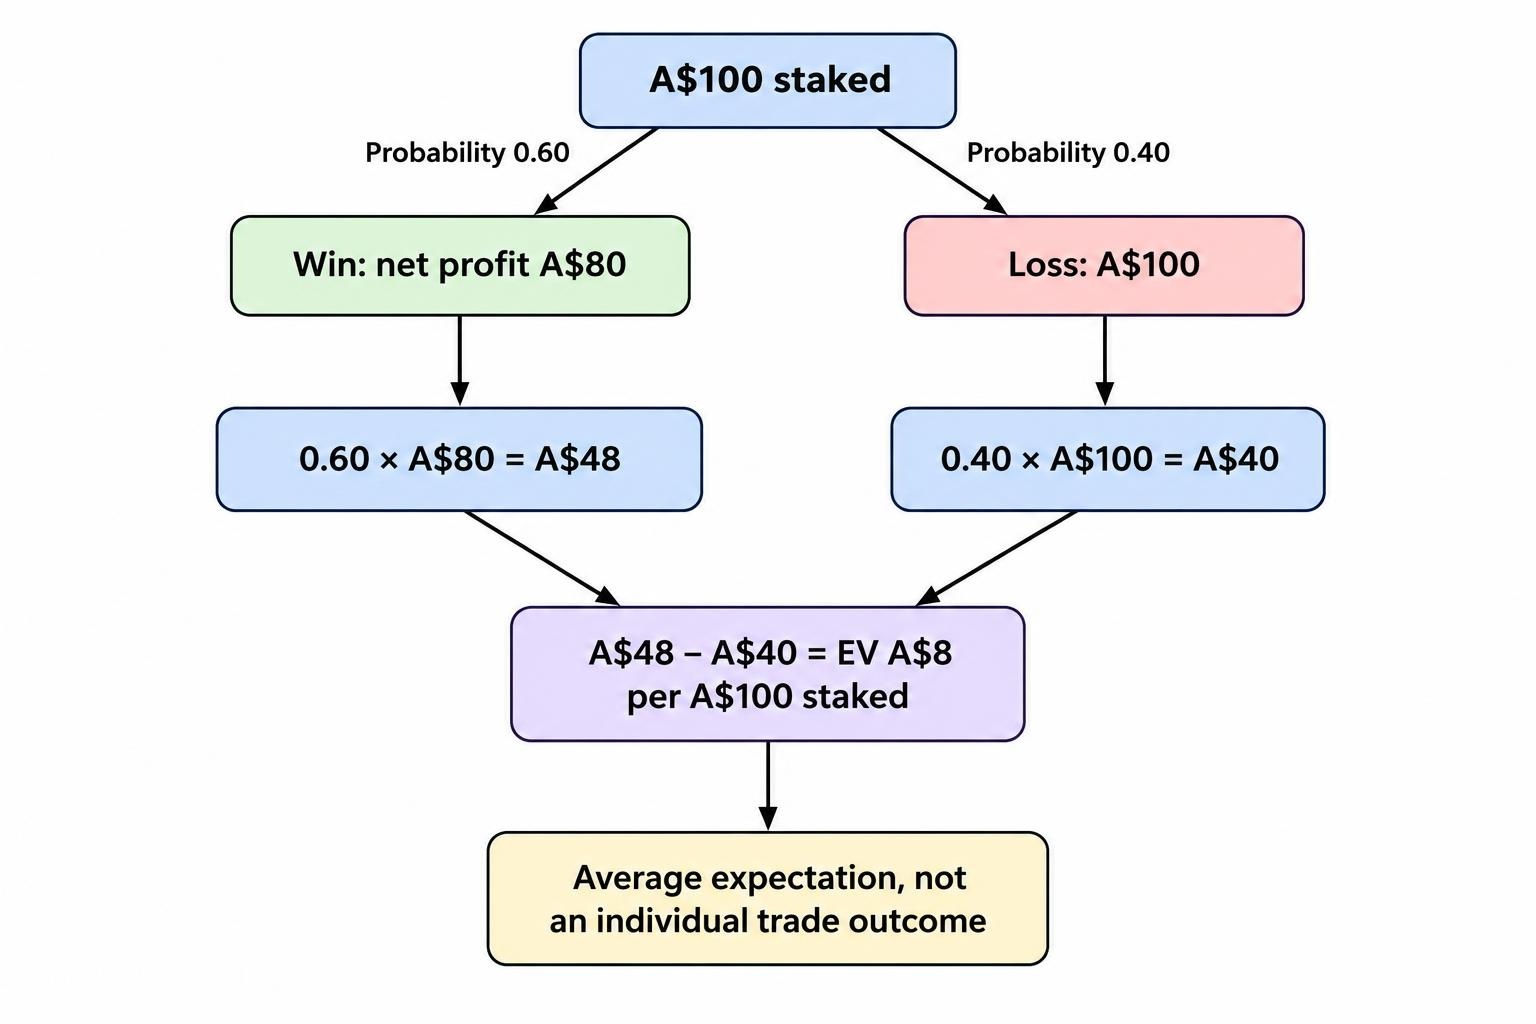
If the true probability of winning were 60%, the calculation would be:
EV = (0.60 × A$80) − (0.40 × A$100) = A$8
That is an expected profit of A$8 per A$100 staked, or an 8% expected return on the stake. It is not an 8% return on the entire account, nor a promise that the next trade will earn A$8. That trade still finishes at either +A$80 or −A$100.
Across 100 such trades with unchanged stakes and valid probability assumptions, expected total profit would be A$800. Actual results could be above or below that figure.
Calculate the Break-Even Win Rate
The break-even win rate is the probability at which expected profit equals zero. For contracts that lose the full stake and return a fixed net profit on wins:
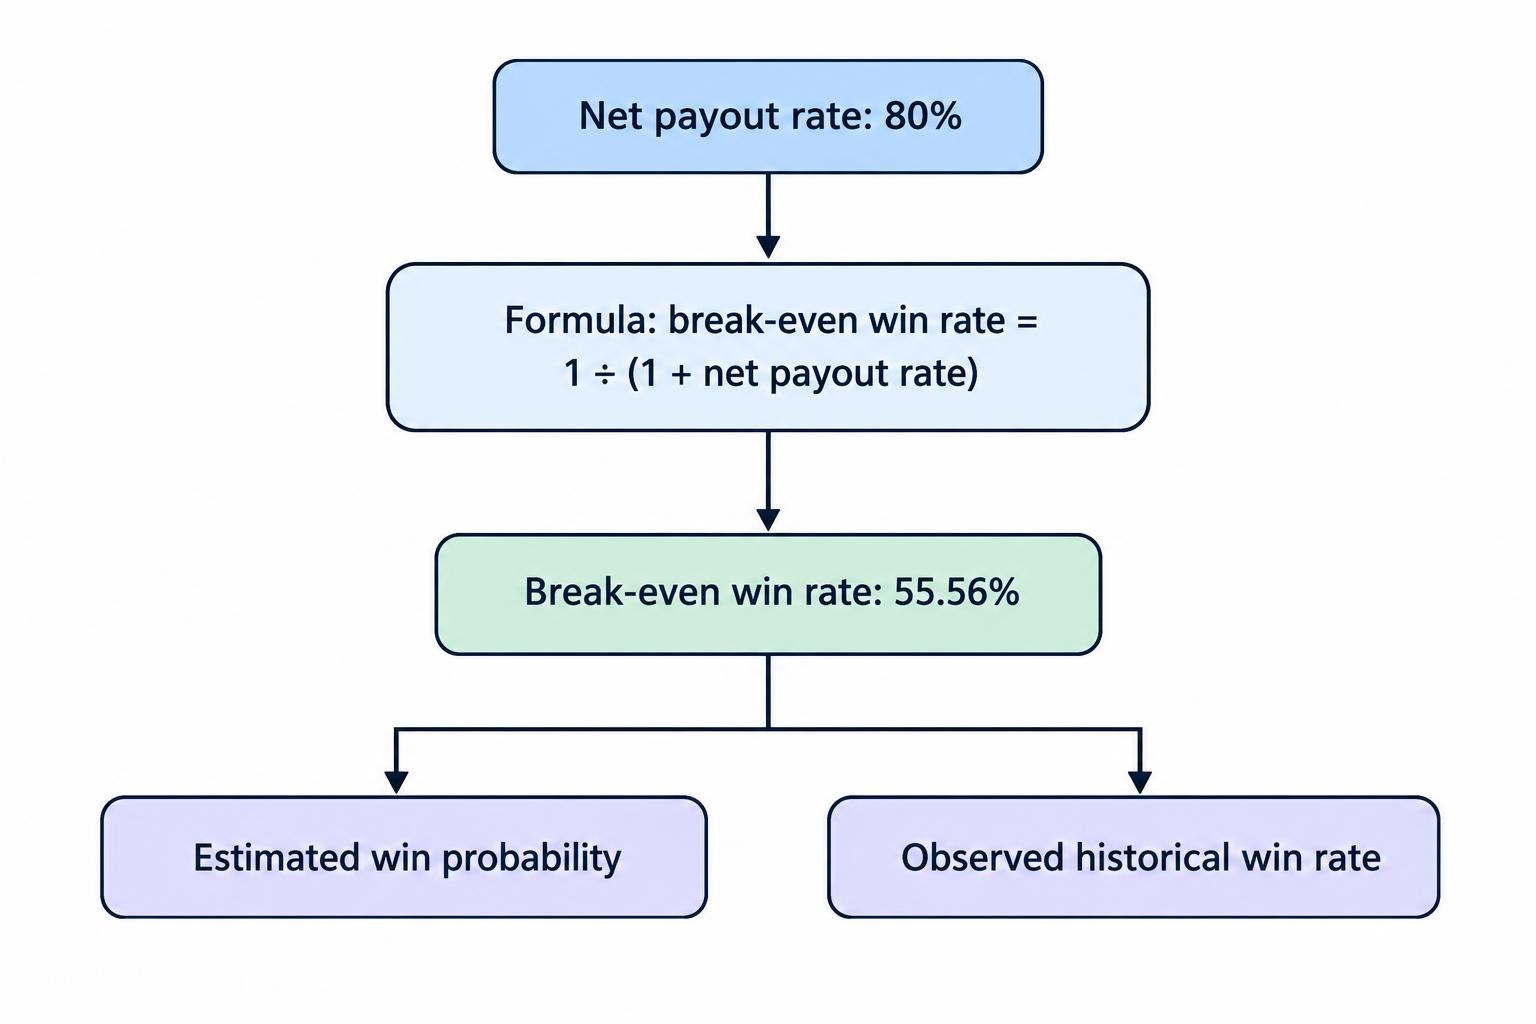
Break-even win rate = 1 ÷ (1 + net payout rate)
Express the payout as a decimal. An 80% net payout becomes 0.80, giving 1 ÷ 1.80 = 55.56%.
| Net profit on a winning stake | Break-even win rate |
|---|---|
| 60% | 62.50% |
| 70% | 58.82% |
| 80% | 55.56% |
| 90% | 52.63% |
| 100% | 50.00% |
At an 80% payout, winning 55 of 100 trades with A$100 stakes produces A$4,400 in winning profits and A$4,500 in losses. The result is −A$100 despite winning more often than losing.
A hypothetical 50% win probability produces EV of −A$10 per A$100 stake. Repeating that contract does not repair its economics. Negative expected returns and the likelihood of cumulative losses were among the harms identified in ASIC’s 2019 report on OTC binary options.
Two Outcomes Do Not Mean a 50% Probability
A contract may finish above or below a strike, but two possible outcomes do not make them equally likely. “Rain tomorrow” and “no rain tomorrow” are also two outcomes. Counting the possibilities is not a weather forecast.
The relevant probability concerns the exact contract event: the price relative to its strike, at the stated expiry, using the settlement rules. Predicting that an asset will generally rise is not the same as predicting that it will finish above a particular strike five minutes later.
The break-even percentage is also not an estimate of the actual probability. An 80% payout tells you that you need more than 55.56% winning outcomes before costs. It does not establish that the contract has a 55.56% chance of winning.
Keep three numbers separate: the required win rate, your estimated win probability and your observed historical win rate. They answer different questions.
Why Win Rate Alone Can Mislead
Payouts and probabilities must be assessed together. Consider a hypothetical strategy with a true 55% win probability and A$100 stakes.
At an 80% net payout, EV is −A$1 per trade. At a 90% net payout, EV becomes +A$4.50. The prediction accuracy has not changed, but the contract terms have.
This does not mean choosing the highest advertised payout automatically improves results. If the higher reward accompanies a harder event to predict, the probability may fall enough to cancel the apparent benefit.
For records containing different payouts, calculate the profit or loss of every trade rather than applying one headline payout to the whole sample. A 60% win rate says little if the winning trades had smaller stakes or lower payouts than the losing trades.
With unequal stakes, record both total cash profit and total money staked. The ratio of those amounts describes the sample’s realised return on staked money. It still does not prove that the same return will persist.
Adjust Expected Value for Fees, Ties and Refunds
The simple formula assumes every trade either wins its stated profit or loses the entire stake. Different settlement outcomes require a different calculation.
If a tie returns the stake without profit, that outcome contributes zero before fees:
EV = (win probability × winning profit) − (loss probability × losing amount)
Here, win and loss probabilities add to less than 100%; the remainder belongs to refunded ties. When comparing a recorded win rate with the usual break-even threshold, exclude fully refunded ties from the win/loss denominator. Do not count them as wins. Other tie treatments require their actual cash outcomes, as covered in binary options settlement and ties.
Costs reduce EV too. If each hypothetical A$100 trade incurs a certain A$1 charge, regardless of outcome, an 80% payout needs a win probability of 101 ÷ 180, or approximately 56.11%, to break even.
That calculation treats the charge as A$1 per completed trade. Account level charges need separate treatment. A withdrawal fee, for example, should not automatically be deducted once from every trade, but it still reduces the money ultimately retained.
An Observed Win Rate Is an Estimate
Suppose a paper trading record contains 57 wins and 43 losses. With fixed A$100 stakes and an 80% payout, its realised profit is A$260, averaging A$2.60 per trade.
Putting 57% into the EV formula also produces A$2.60. However, using a historical frequency as the probability does not establish that the true future EV is positive. The sample may have benefited from chance.
For 57 wins from 100 independent trials with a constant win probability, a 95% Wilson confidence interval is approximately 47.2% to 66.3%, calculated using the method in the NIST guidance on confidence intervals for proportions. That range includes probabilities well below the 55.56% break-even threshold.
The interval describes uncertainty under the statistical model. It does not promise that future results will remain within those percentages. Shared market conditions, overlapping positions and changing rules can make a simple independent trial model inappropriate.
There is no universal number of trades that proves an advantage. A narrow apparent margin above break-even demands stronger evidence than a large one, and collecting more biased observations does not cure the bias.
Estimate Probability Without Grading Your Own Homework
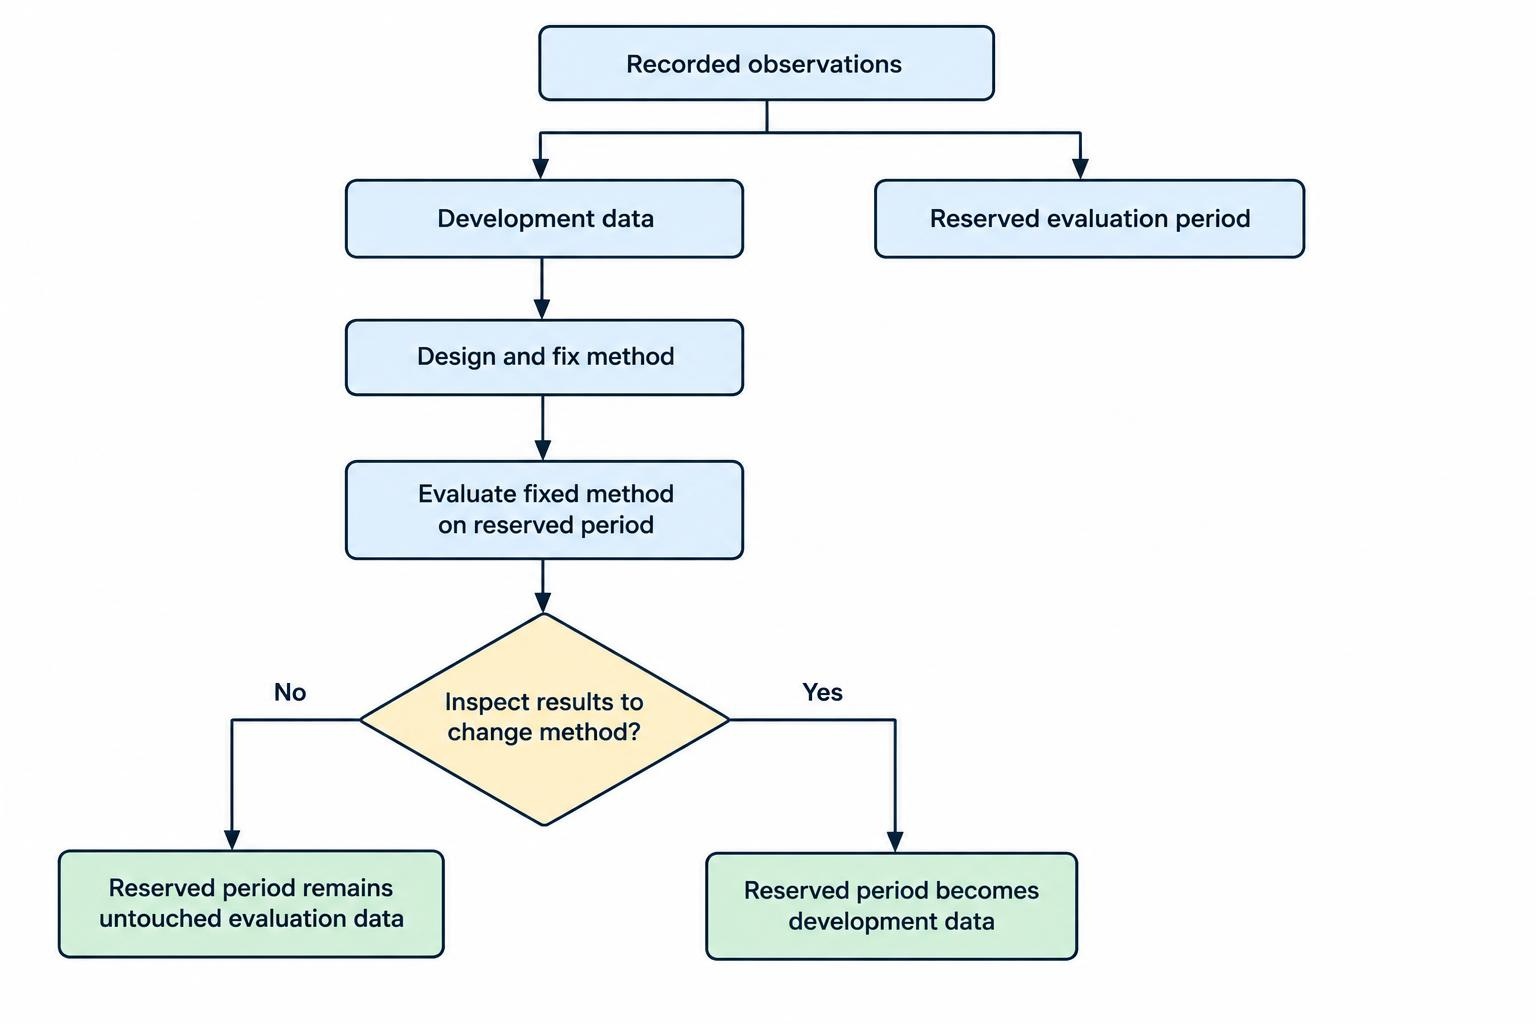
A defensible estimate needs rules fixed before outcomes are known. Otherwise, it is easy to select favourable examples, adjust an entry after seeing the chart or overlook signals that failed.
Separate the data used to develop a method from data reserved to evaluate it. The reserved period should remain untouched during development. If you repeatedly change the method after inspecting that period, it has become development data too.
Record the entry time, accepted strike, expiry, available payout and settlement result. A chart showing a favourable move is not enough to reconstruct whether the actual contract would have won. The guide to backtesting binary options strategies covers the testing process in more detail.
Probability estimates should also survive reasonable changes in assumptions. If moving the estimated win rate from 57% to 55% turns a result from profitable to unprofitable, that sensitivity deserves attention. A result that depends on the most optimistic estimate is fragile, even when the spreadsheet looks tidy.
Positive Expected Value Still Allows Losing Streaks
Expected value describes an average, not the order of outcomes. Even a hypothetical method with a genuine 60% win probability can produce consecutive losses.
Assuming independent outcomes and an unchanged 40% loss probability, the probability that the next five trades all lose is:
0.405 = 0.01024, or approximately 1.02%
That is the probability of one designated block of five losses. It is not the probability of encountering at least one five loss streak somewhere across 100 trades. A longer sequence offers more opportunities for a streak to occur.
Nor does a run of losses make the next independent trade more likely to win. Five losses do not create a debt that probability must repay. The separate guide to binary options losing streaks examines their account impact.
Correlated outcomes complicate the picture. Several positions driven by the same market move can lose together. Treating each as an unrelated observation can make the record appear more informative, and the exposure more spread out, than it really is.
Stake Sizing Does Not Create Positive Expected Value
Changing the stake changes the cash exposure. It does not turn unfavourable contract terms and an inadequate win probability into a profitable proposition.
If a contract has EV of −10% of the stake, increasing the stake from A$10 to A$100 changes the expected loss from A$1 to A$10. The percentage disadvantage remains.
Doubling after losses also runs into the payout asymmetry. Three unsuccessful stakes of A$10, A$20 and A$40 lose A$70. A subsequent A$80 stake winning at an 80% payout earns A$64 in profit. The sequence still finishes A$6 down.
Smaller stakes can reduce the immediate cash damage from a loss, but cannot remove negative EV. Equally, a positive EV estimate does not justify a large stake when the estimate itself is uncertain. Expected return, uncertainty and the ability to withstand losses are separate questions.
Use Expected Value as an Evidence Check
A useful assessment starts with the contract’s cash outcomes, not its advertised success rate. Establish the winning profit, losing amount, tie treatment and costs, then calculate the probability required to break even.
Next, examine whether the probability estimate has evidence behind it. A complete record with fixed rules is more useful than selected screenshots or a winning week. Keep those inputs and outcomes together in a trading journal, so changes in payout or stake cannot disappear inside a headline win rate.
Finally, test less favourable assumptions. Calculate EV with a lower win probability, reduced payout and realistic costs. If the result changes sign with a small adjustment, describe it as uncertain rather than treating a positive point estimate as an established advantage.
The practical distinction is straightforward: the break-even rate is arithmetic; the true win probability requires evidence. Expected value connects the two, but it cannot make an unsupported probability estimate reliable.
This article was last updated on: October 22, 2026