Fundamental analysis for binary options examines economic data, central bank policy, company results and supply and demand to assess an underlying market. Its purpose is to identify what could change expectations, how that might affect price, and whether the effect fits the contract’s expiry.
That last point matters. A sound economic forecast can still produce a losing binary option if price finishes on the wrong side of the strike at settlement.
Australian retail restriction: ASIC’s product intervention order bans the issue and distribution of binary options to retail clients and runs until 1 October 2031. The ASIC announcement extending the binary options ban sets out the restriction and the product risks behind it. The methods below are for education and paper analysis, not a recommendation to open an offshore account.
What Fundamental Analysis Can Establish
Fundamental analysis starts with a cause: a change in borrowing costs, inflation, business earnings, production or demand. It then asks how that change could alter the value or attractiveness of an asset.
For binary options, the question must be narrower than “Is this asset attractive?” In a hypothetical higher or lower contract, the relevant question is whether the settlement price will finish above or below a defined strike at a stated time.
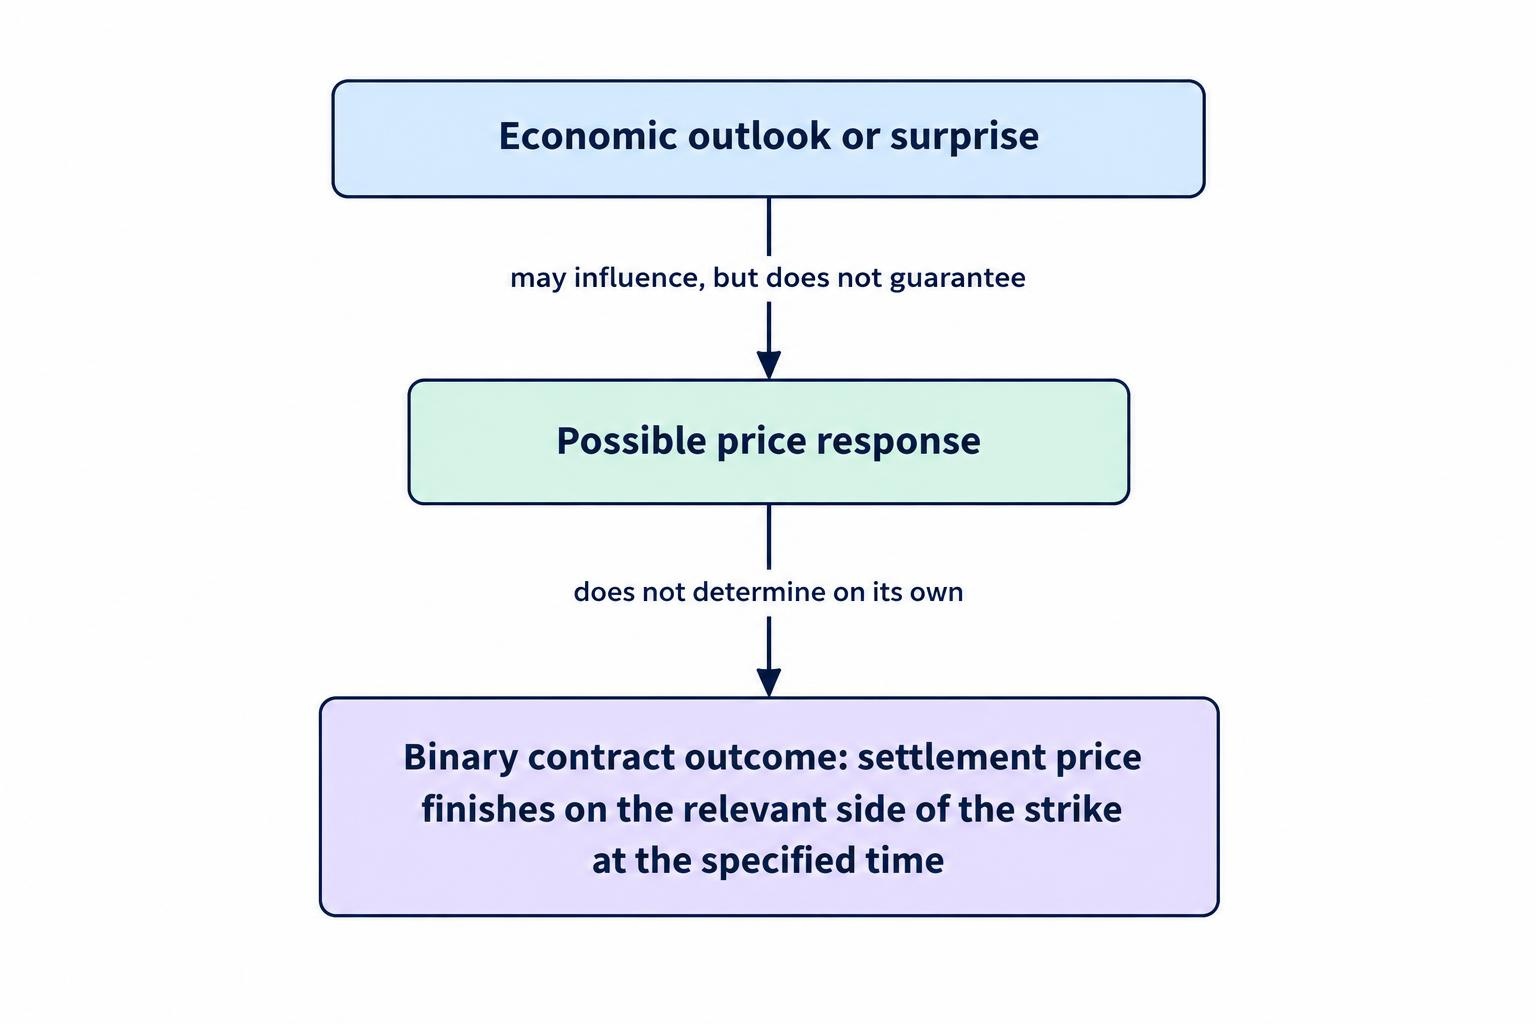
Keep three judgments separate: the economic outlook, the likely price response and the contract outcome. They are connected, but none guarantees the next.
This differs from technical analysis for binary options, which examines price behaviour and chart structure. Fundamentals provide a reason to expect a move; charts help assess where price stands. Combining them does not automatically create an advantage, especially when both interpretations are chosen after the event.
Expectations Matter More Than Whether News Looks Good
Markets respond to new information relative to what participants expected. A strong result can disappoint if expectations were stronger still. The distinction between an announced result and its surprise component is central to the RBA research on market responses to economic data.
Consider a hypothetical inflation release:
- Previous annual inflation: 3.4%.
- Consensus forecast: 3.0%.
- Actual result: 3.2%.
Inflation has fallen compared with the previous reading, but it is higher than forecast. An analyst who focuses only on the decline could miss the surprise.
The next question is what the surprise changes. Does it alter the expected path of interest rates? Does it challenge assumptions about household demand? Is the headline masking a different result in the underlying measure?
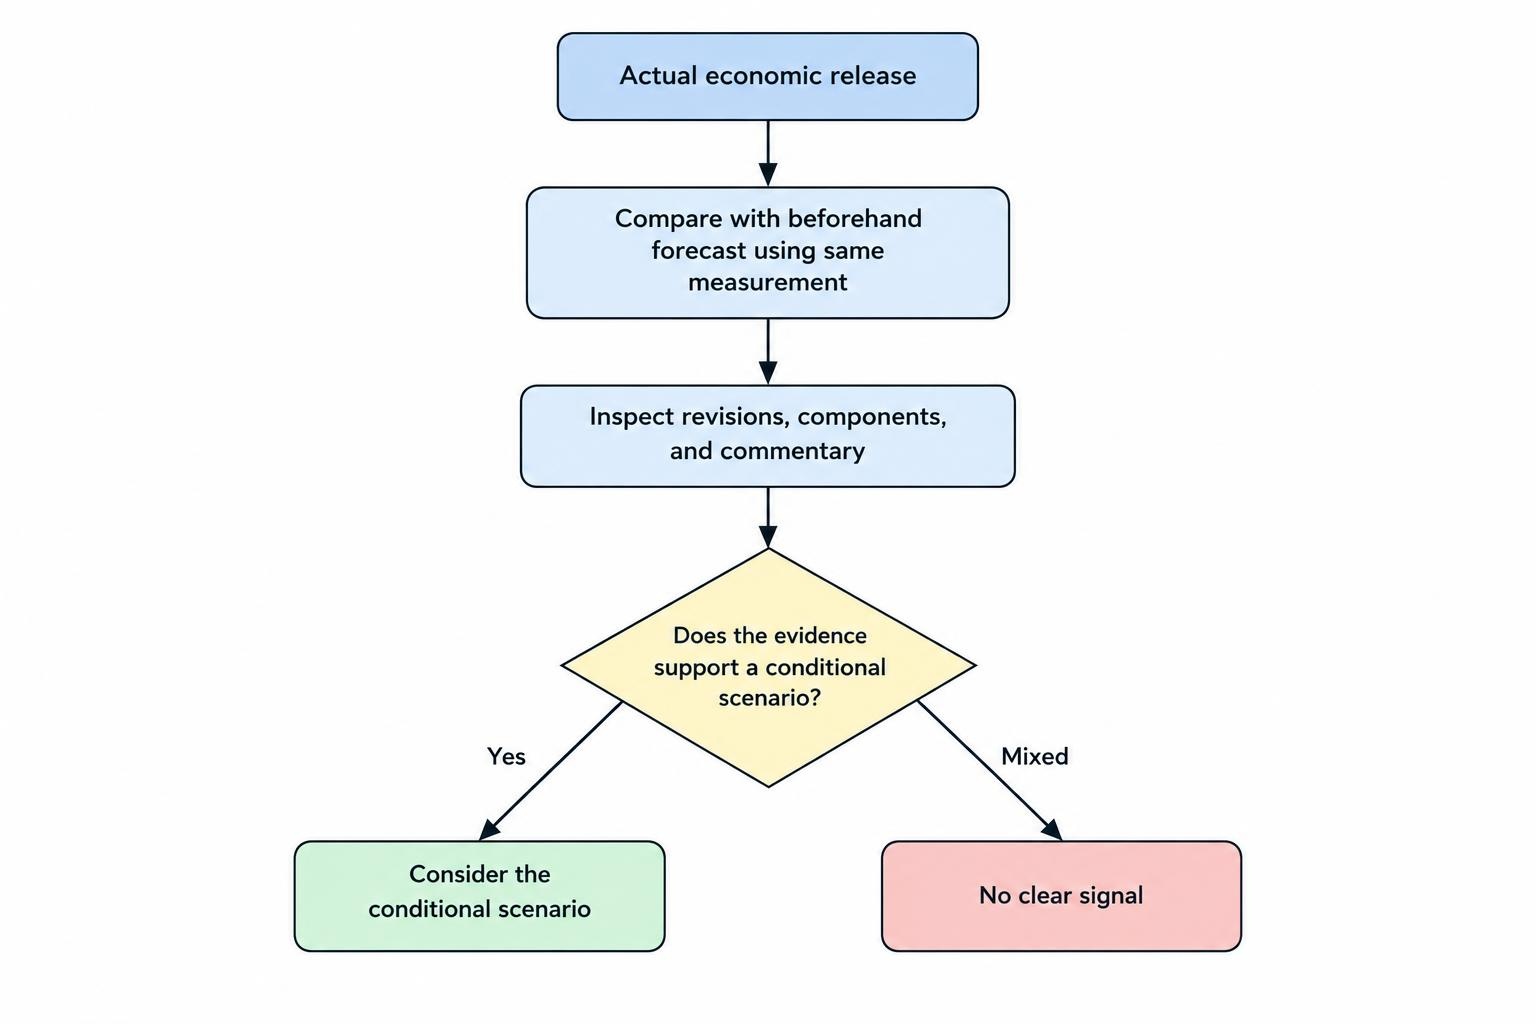
Consensus is a reference point, not a complete picture of market expectations. Record which forecast you used and when you captured it. Check the actual figure against the same measurement: monthly change, annual change and an index level are not interchangeable.
Read the release beyond its headline. Revisions, component data and accompanying commentary can change the interpretation. If the evidence points in different directions, “no clear signal” is a valid finding.
Choose Fundamentals That Fit the Underlying Market
Forex: Analyse Both Currencies
A currency pair expresses one currency’s value relative to another. Analysis of AUD/USD therefore needs an Australian side and a US side.
Interest rate differences, commodity export prices and investor attitudes to risk can affect the Australian dollar. The RBA explanation of Australian dollar exchange rate drivers describes these channels and why they can operate over different periods.
A useful research question is not simply “Was Australian data strong?” It is “Did the release improve the expected outlook for Australian dollar assets relative to US dollar assets?”
Keep the interpretation conditional. Stronger Australian data might support an AUD/USD appreciation thesis, but a simultaneous US development could challenge it. Write down what would invalidate the view before examining the subsequent chart.
Shares and Indices: Separate Results From Expectations
For a company, examine revenue, profit margins, cash flow, debt and management’s outlook. US company annual and quarterly filings contain financial statements, business risks and management discussion; the SEC investor bulletin on reading Forms 10-K and 10-Q identifies the relevant sections.
Suppose a hypothetical company reports earnings above analysts’ forecasts but cuts its revenue outlook. Calling the announcement “positive” would conceal the disagreement between past performance and future expectations.
For an index, avoid treating one company’s announcement as a complete explanation. Assess the company’s relevance to that index and whether broader economic news changes the interpretation. Also identify whether the contract references a cash index, futures price or another quoted benchmark.
Oil: Examine the Balance Behind the Headline
Oil analysis centres on production, consumption and inventories. Inventory changes can indicate shifts in the supply and demand balance, but prices also affect incentives to store oil. The EIA analysis of petroleum inventories and prices describes this two way relationship.
For a paper exercise, do not label every inventory decline bullish. Ask what caused it and how it compares with expectations. Check production, imports, refinery activity and refined product stocks where those figures are available.
A hypothetical fall in crude stocks accompanied by rising fuel stocks presents a different research problem from falling stocks across both categories. The task is to interpret the balance, not turn one number into a mechanical signal.
Gold: Avoid the Inflation Shortcut
“Higher inflation means higher gold” is too simple for a research rule. Inflation expectations, expected real interest rates and concern about economic conditions can all matter. Chicago Fed research on gold price drivers examines these influences and how their relationships have varied over time.
When assessing an inflation announcement, consider competing channels rather than selecting the one that supports your preferred direction. An inflation surprise and a change in expected interest rates need not imply the same outcome for gold.
Match the Economic Thesis to the Expiry
Fundamental analysis needs a time horizon. A view about economic growth over six months does not, by itself, justify a forecast about the next sixty seconds.
Separate the announcement response from the longer adjustment you expect. For a paper test, examine several predetermined observation points rather than picking the most favourable point afterwards. Record the initial reaction, any reversal and the price at the intended settlement time.
Neither a short expiry nor a longer one fixes weak reasoning. A longer observation window gives the original thesis more time to develop, but also leaves room for other information to arrive. The trade-offs belong in the choice of binary options expiry times, not in an assumption that more time must be safer.
Entry price matters just as much. If an asset rises before the hypothetical entry, a correct bullish interpretation does not establish that it will keep rising from the new strike. Being right about the announcement and being right about the contract are different achievements.
Build a Repeatable Fundamental Analysis Process
A useful process produces a written decision before the outcome is known. It should be clear enough that another person could follow the same rules without guessing what you meant.
Before the Announcement
Choose one market and one event category to study. Record the event, forecast, previous reading, underlying asset, observation window and conditions that would make the result inconclusive.
Use an economic calendar to organise the research, then confirm the event details with the original publisher. Check the publication date and time, your local time zone and the platform clock separately. Do not assume a saved local release time remains correct throughout the year.
Write a short scenario statement: “An upside surprise would support this view if it changes expected policy in this direction; conflicting component data would invalidate the signal.” This is more useful than a vague instruction to follow positive news.
After the Announcement
Read the original release before assigning a direction. Compare the actual result with the forecast you recorded, inspect revisions where relevant and check whether the release supports the scenario.
For paper analysis, establish the hypothetical entry only after the information your rule requires would have been available. Do not use the price from just before the announcement while making a decision based on its contents.
Record the strike, entry time, expiry, settlement benchmark and assumed payout. Missing contract details cannot be repaired by a persuasive economic explanation.
Worked Example: A Correct View, a Losing Contract
The following numbers are hypothetical. They illustrate timing risk, not a tested trading method.
Suppose an Australian inflation release exceeds the recorded consensus forecast. The paper trading thesis is that the surprise will support AUD/USD through a change in expected Australian interest rates.
| Observation | Hypothetical AUD/USD price |
|---|---|
| Immediately before publication | 0.6500 |
| After reading the release; paper entry and strike | 0.6520 |
| Five minute settlement | 0.6517 |
| Thirty minutes after publication | 0.6530 |
A higher contract entered at 0.6520 and settled after five minutes loses under the assumed terms. The asset is above its pre-announcement price, and later rises further, but neither fact changes that settlement result.
Now assume a stake of A$50, an 80% net profit payout on a win and loss of the full stake on a loss. A winner earns A$40; a loser costs A$50.
With no fees, refunds or ties, the break-even win rate is 1 ÷ 1.8, or approximately 55.56%. Winning half the contracts would therefore lose money. The relationship between payout and required accuracy is covered in probability and expected value in binary options.
The market does not pay extra for a convincing explanation. The contract’s actual outcome and payout determine the result.
Test the Method Without Rewriting Its Rules
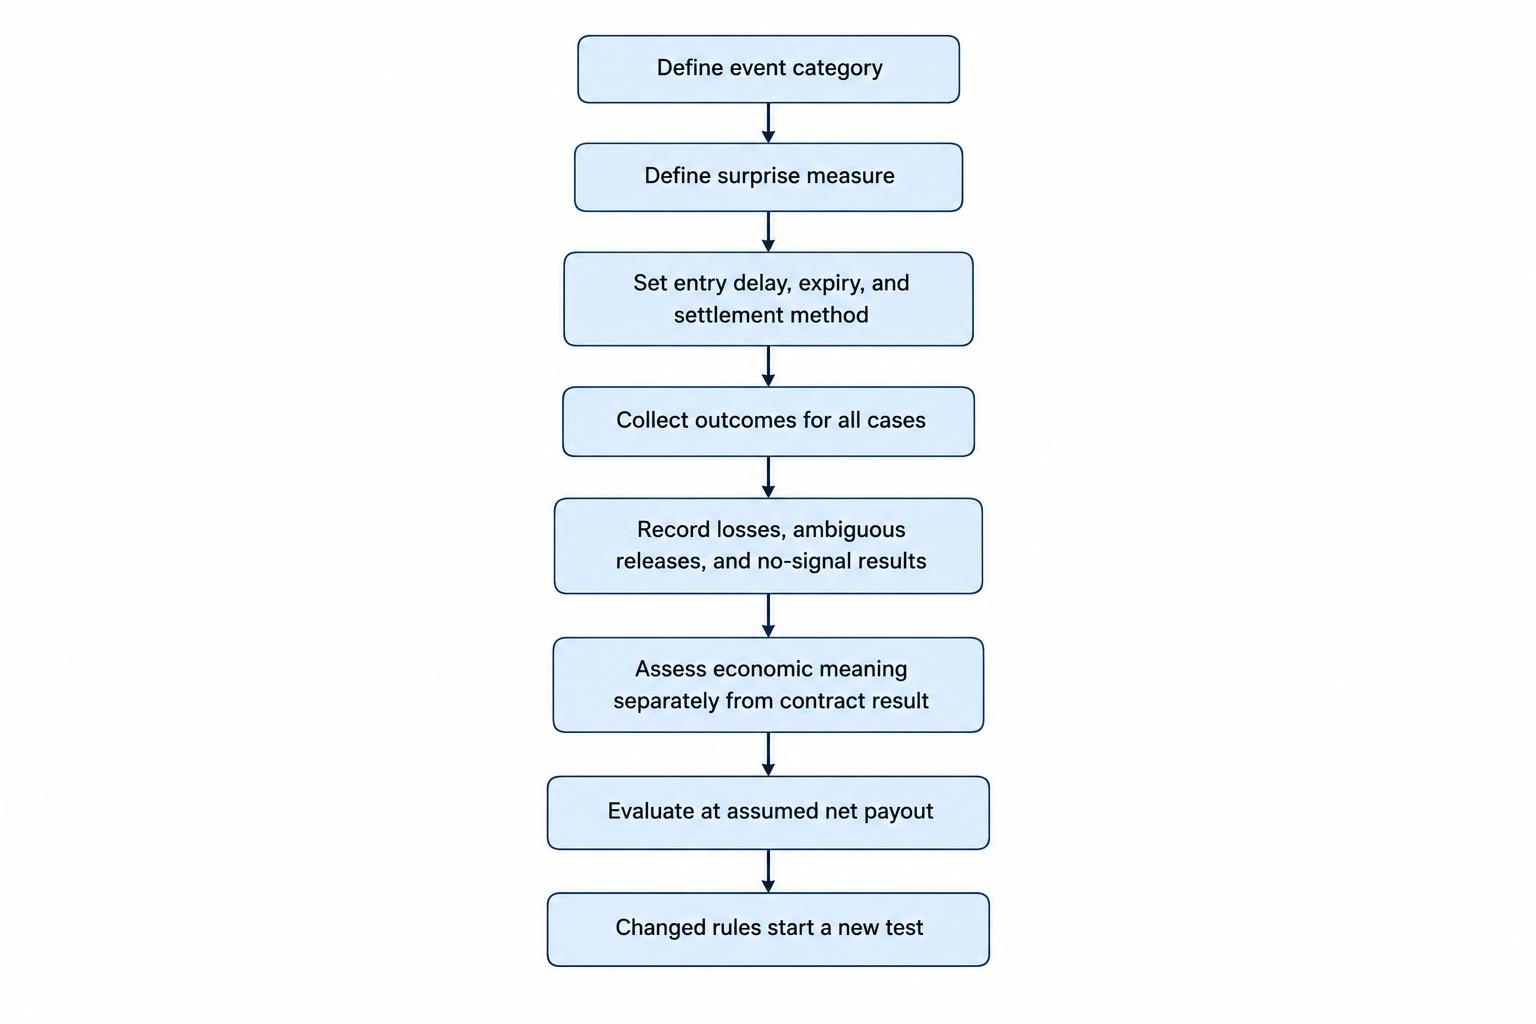
Start with paper records rather than deposits. Define the event category, surprise measure, entry delay, expiry and settlement method before collecting outcomes.
Include ambiguous releases, losing observations and occasions when the rules produced no signal. Excluding awkward results after seeing the chart turns research into a highlight reel.
Keep economic interpretation separate from contract performance. Record whether the thesis appeared consistent with later price behaviour, then record whether the defined contract won or lost. That distinction can reveal a timing problem without pretending the original entry was successful.
Once the rules are written, use forward testing to observe subsequent events without changing the method after each result. Preserve the information available at the time, including the original forecast and release values.
Evaluate results using the assumed net payout, not win rate alone. Any change to the rules starts a new test; it should not silently improve the old record.
Know When the Analysis Does Not Support a Signal
Fundamental analysis is most useful when it forces a clear explanation of what changed, why it matters and when the effect is expected. It is least useful when a headline becomes an excuse to predict the next few price movements.
Reject the signal when the release is mixed, the benchmark is unclear, the entry cannot be reconstructed or the economic thesis does not fit the expiry. A longer explanation does not resolve those gaps.
A disciplined result can be a documented decision to do nothing. That preserves the distinction between analysing a market and assuming every announcement creates an opportunity.
This article was last updated on: October 22, 2026