The Relative Strength Index (RSI) measures the balance between recent upward and downward price changes. Traders use it to assess momentum, identify stretched moves and compare the strength of successive price swings.
For binary options analysis, the distinction is timing. An RSI reading can suggest that momentum is weakening without showing whether price will finish above or below a strike at expiry. A useful indicator reading and a profitable contract are not the same thing.
Australian readers: ASIC’s ban on issuing and distributing binary options to retail clients took effect on 3 May 2021 and has been extended until 1 October 2031. The ASIC binary options ban extension remains the relevant regulatory starting point. The examples below are for chart study and paper testing, not a recommendation to open or fund a binary options account.
What Does RSI Measure?
RSI is a momentum oscillator: an indicator displayed on a scale from zero to 100. Its standard calculation compares smoothed gains with smoothed losses, usually using closing prices and a 14 bar setting. The familiar reference levels are 30 and 70. These settings and calculation inputs appear in the TradingView RSI documentation.
A high reading means upward price changes dominate the calculation. A low reading means downward changes dominate. This is different from saying that an asset is expensive or cheap. RSI does not examine company earnings, interest rates or fair value.
It also does not compare one asset’s performance with another, despite the words “relative strength” in its name. Standard RSI analyses the price changes within one series.
The practical question is not simply “Is RSI high?” It is “What does this reading add to the price pattern already visible?” A reading of 75 during a breakout deserves a different interpretation from 75 during another failed attempt to leave a trading range.
How RSI Is Calculated
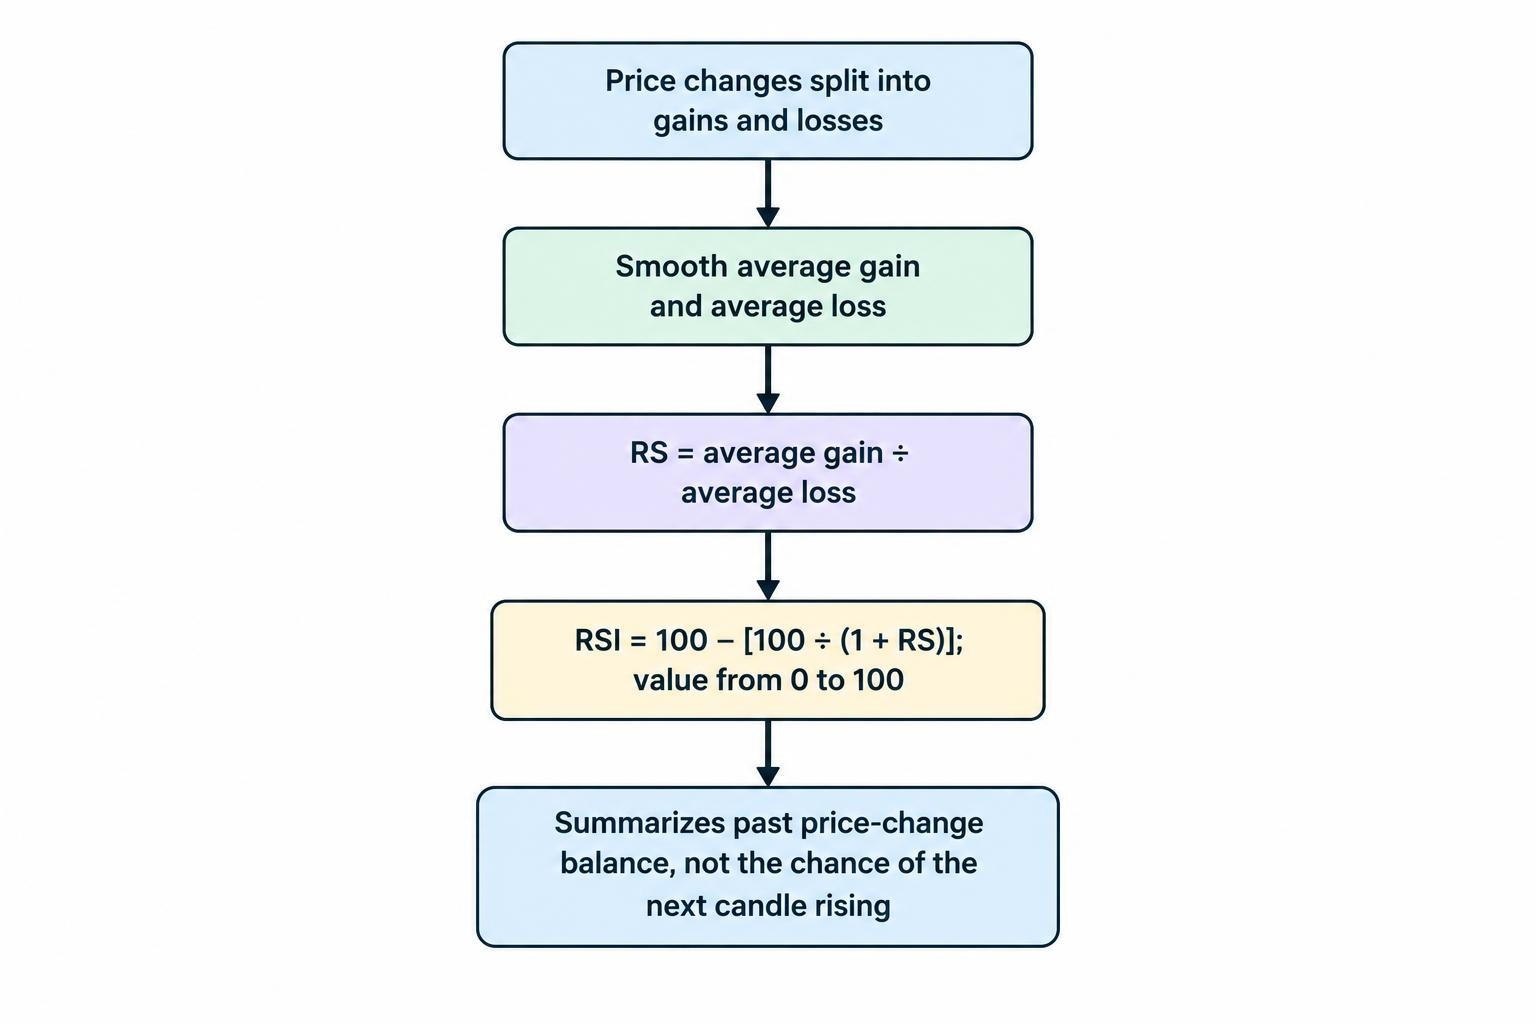
The formula is:
RSI = 100 − [100 ÷ (1 + RS)]
RS = average gain ÷ average loss
Losses enter the calculation as positive magnitudes. For the initial 14 period calculation, gains and losses are each totalled across 14 price changes and divided by 14. Subsequent values use Wilder’s smoothing:
New average gain = [(previous average gain × 13) + current gain] ÷ 14
The average loss follows the same process. The StockCharts RSI calculation reference covers this initialization and smoothing method.
Suppose the smoothed average gain is 0.06 price units and the average loss is 0.04. RS equals 1.5, giving an RSI of 60. That describes the balance of past price changes. It does not mean there is a 60% chance that the next candle will rise.
The smoothing also means RSI(14) is not a simple calculation that completely forgets everything older than 14 bars. Earlier observations retain a declining influence. When comparing readings between charts, check the price feed, candle boundaries, input price and indicator implementation before assuming one chart is wrong.
Reading the 30, 50 and 70 Levels
The standard levels provide reference points, not automatic instructions.
| RSI reading | Conventional interpretation | What it does not establish |
|---|---|---|
| Below 30 | Oversold: downward momentum dominates | That price has reached its lowest point |
| Around 50 | Smoothed gains and losses are broadly balanced | That price will remain flat |
| Above 70 | Overbought: upward momentum dominates | That a decline must begin immediately |
“Overbought” is particularly easy to misread. It describes an indicator condition, not a deadline for selling. A strong advance can keep RSI elevated while price continues higher. The equivalent problem occurs when someone repeatedly buys an oversold market that keeps falling.
Crossing back through a threshold is a different event from touching it. RSI moving from 28 to 33 shows a change in momentum; RSI sitting at 28 does not show that recovery. Neither event proves that a reversal will last.
The centre line also needs context. A move from 45 to 52 may support a developing recovery, but a brief crossing during sideways trading may add little useful information.
Choosing RSI Settings
Start research with a fixed baseline, such as RSI(14) calculated from closing prices. This gives you something consistent to evaluate before changing the indicator to fit individual charts.
A shorter setting, such as seven periods, responds more sharply to recent changes. A longer setting, such as 21, smooths them more heavily. Neither is automatically more accurate. Faster readings can produce more triggers; slower readings can arrive after much of a move has already occurred.
The chart interval changes the meaning of the period setting. RSI(14) on a five minute chart uses five minute observations. It is not the same indicator series as RSI(14) on an hourly chart, even though both display the number 14.
Changing the thresholds from 70/30 to 80/20 creates a stricter definition of an extreme reading. Treat that as another research choice, not an upgrade. Write down why the change is being tested and compare it on data that did not influence the choice.
Also distinguish the RSI line from any extra moving average displayed over it. A platform may offer both an RSI length and a separate smoothing length. Changing the second setting may alter the signal line without changing the underlying RSI calculation.
Four Ways to Use RSI in Chart Analysis
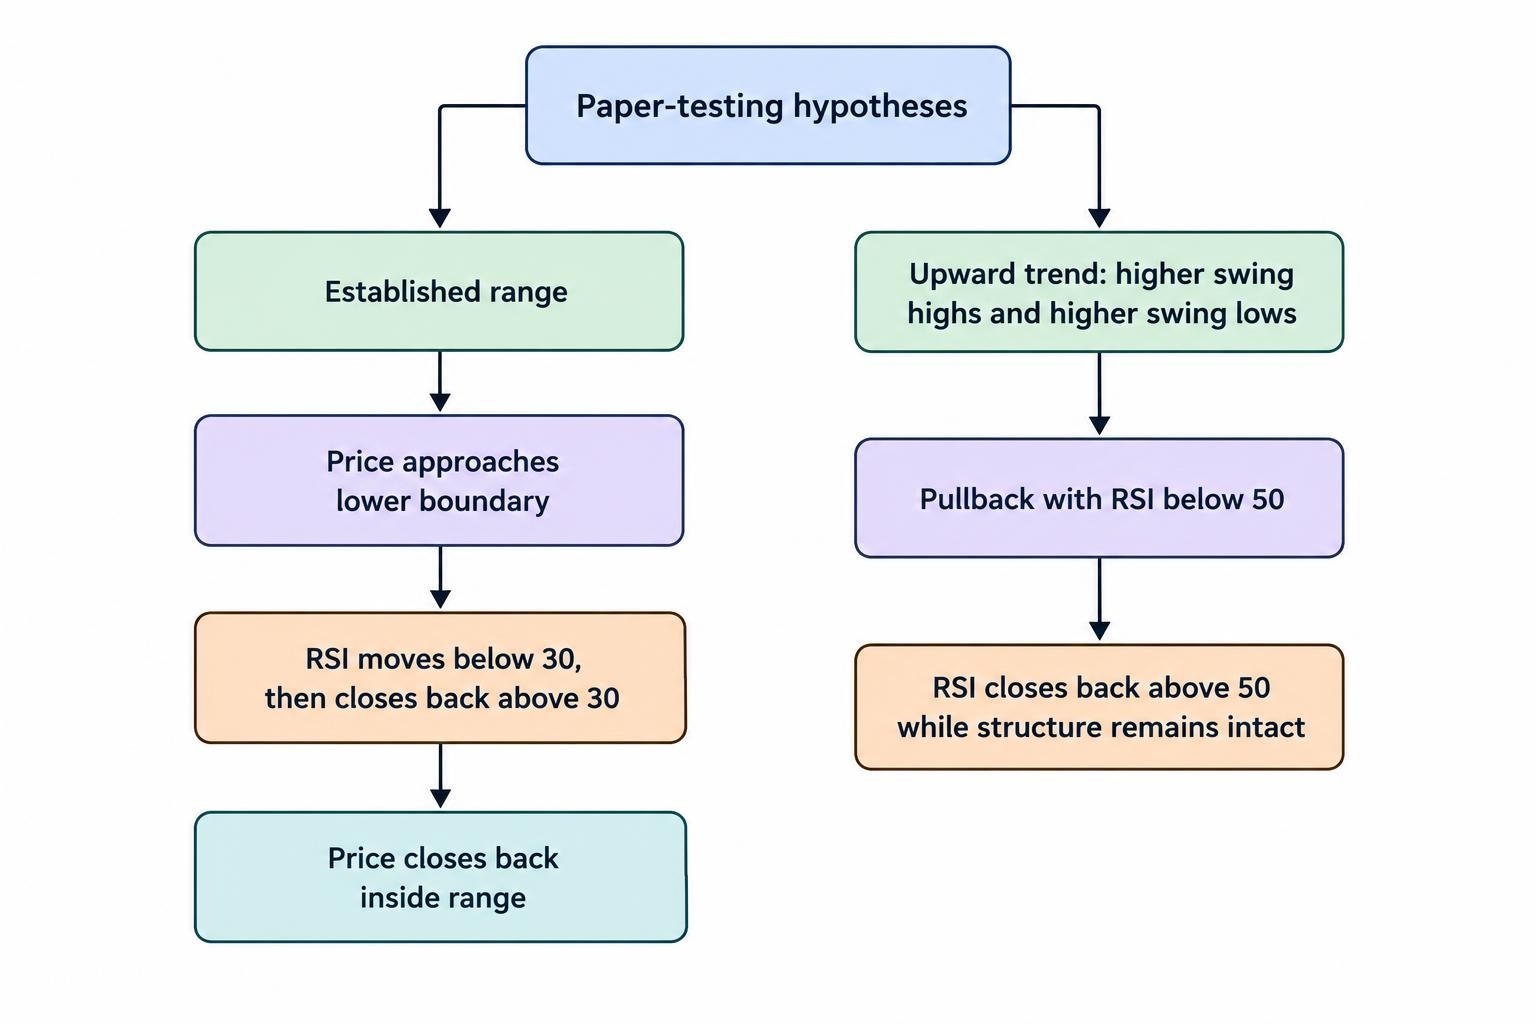
1. Study Reversals Within an Established Range
A range reversal hypothesis starts with price boundaries, not an oscillator reading. Mark the range before examining the latest RSI signal. Previous reactions can help define those support and resistance areas, although no boundary is guaranteed to hold.
A paper testing rule might require price to approach the lower boundary, RSI to move below 30, then a completed candle to show RSI recovering above 30. A separate price condition could require a close back inside the range.
This produces a testable sequence: location, momentum condition and confirmation. It is more useful than deciding afterwards that an RSI dip “looked good”.
Define when the range hypothesis stops applying. A close beyond the boundary, repeated movement outside it or another predefined condition could invalidate the setup. Otherwise, the same rule may keep proposing reversals after price has started a trend.
2. Assess Pullbacks Within a Trend
A trend continuation hypothesis asks a different question: has a temporary retreat ended while the broader price structure remains intact?
For an illustrative upward trend, define higher swing highs and higher swing lows before looking for an RSI recovery. A research rule might study RSI falling below 50 during a pullback and then closing back above it, provided price has not broken the chosen structural boundary.
A moving average trend filter can provide another consistent condition, but it does not supply independent proof. Both indicators are transformations of price. Agreement between them should not be counted as two unrelated witnesses.
Keep trend continuation and range reversal results separate. Combining them into one performance figure can hide the conditions in which each rule succeeds or fails. A rule should have a clear job before its results are measured.
3. Compare Price Swings With RSI Divergence
Bullish divergence occurs when price makes a lower low while RSI makes a higher low. Bearish divergence occurs when price makes a higher high while RSI makes a lower high.
Consider a hypothetical asset making successive highs at 100 and 102 while RSI peaks at 76 and 68. Price has advanced, but the second RSI peak is lower. That is bearish divergence, not proof that the next price movement will be downward.
For testing, define what counts as a swing and which RSI observation belongs to it. Comparing a price high with an unrelated indicator peak can manufacture a pattern that was never there.
A divergence may justify watching for a change in price structure. It does not supply an expiry time. Avoid drawing a line between two convenient points and treating the line itself as evidence of a profitable strategy.
4. Identify RSI Failure Swings
A failure swing is a pattern within RSI itself. It does not require price and RSI to diverge.
A bearish version begins above 70. RSI then falls below 70, rebounds without regaining that level and breaks its intervening low. The StockCharts bearish failure swing example illustrates this four stage pattern and its distinction from divergence.
Using hypothetical readings, RSI might move from 76 to 62, recover to 68, then fall below 62. The final break completes the pattern. Acting at 68 would anticipate completion rather than observe it.
That distinction matters in research. Record the moment the whole pattern becomes available, not the earlier point that produces the most attractive result on a finished chart.
RSI Timeframes and Binary Options Expiry
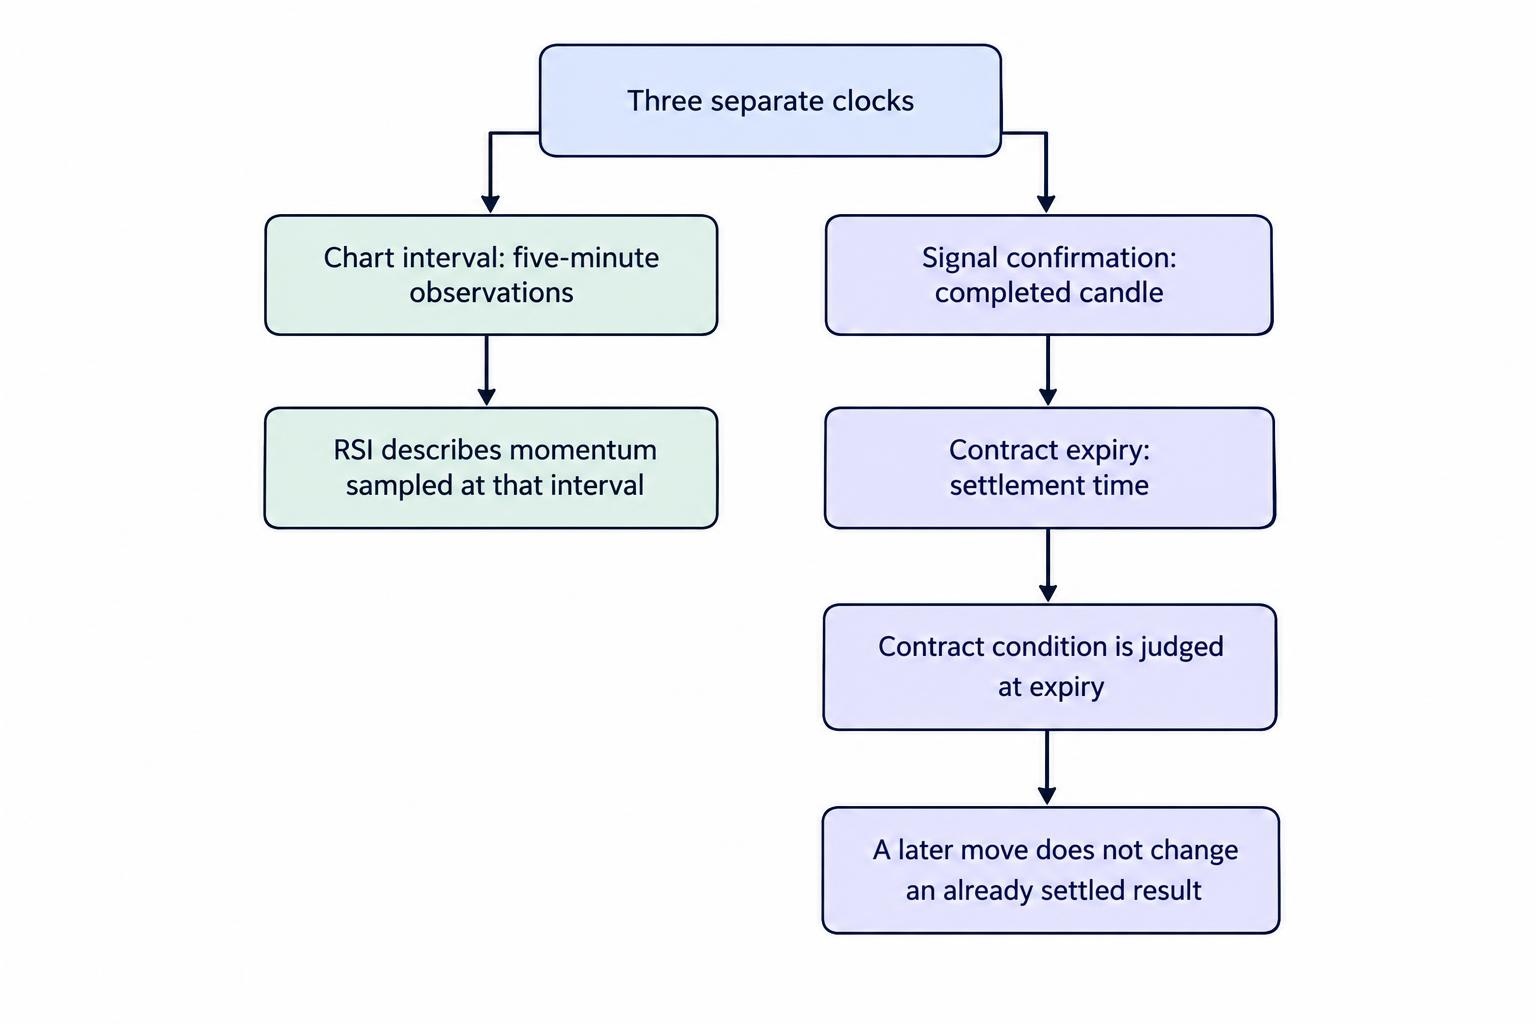
Three separate clocks matter: the chart interval, the signal confirmation time and the contract expiry. RSI does not connect them automatically.
A signal observed on a five minute chart does not establish that a five minute contract is appropriate. Nor does a pattern on a 15 minute chart necessarily support a 60 second prediction. The indicator describes momentum at its chosen sampling interval; the contract asks whether a settlement condition will be met at a particular time.
The difference between a fixed clock expiry and a duration measured from acceptance also matters. An expiry at 10:30 provides less remaining time for an entry accepted at 10:27 than one accepted at 10:21. Research should record the actual remaining duration, not just the expiry label.
Keep the horizon fixed when comparing signals. Testing the same setup at several horizons can be legitimate research, but selecting the winning horizon after each trade is hindsight. The guide to binary options expiry times covers the contract timing questions separately.
A later move in the predicted direction does not rescue a contract that has already settled. Being eventually right is not the same as being right at expiry.
A Worked RSI Paper Trading Example
Suppose an AUD/USD study uses five minute candles and RSI(14). The written rule requires price to approach a previously marked range low, RSI to recover above 30 on a completed candle and price to close back inside the range.
In this hypothetical sequence, RSI closes at 27, then 34 on the following candle. The price condition also passes. The researcher records a simulated higher contract at 0.65020, with a fixed expiry 15 minutes after the assumed acceptance time.
Assume a $100 stake, an $80 net profit for a win, full stake loss for a loss and no fees. If the settlement quote is 0.65030, the simulated profit is $80. If it is 0.65010, the loss is $100. An equal settlement price must be handled using the contract’s stated tie rule.
The indicator’s appearance does not change those economics. With these assumptions and no ties, the break even win rate is:
$100 ÷ ($100 + $80) = 55.56%
Across 100 hypothetical trades, 55 wins produce $4,400 in profits, while 45 losses cost $4,500. The result is a $100 loss before other costs. This is why probability and expected value matter more than whether the majority of signals were correct.
One example demonstrates the recording method, not a trading advantage. The same rule needs evaluation across all qualifying observations, including the untidy ones.
Use Confirmed Signals, Not Finished Chart Illusions
RSI on an open candle changes as the current price changes. It can cross above 30 during the candle and finish below 30 when that candle closes. Historical charts normally show the confirmed value rather than every temporary crossing. The TradingView documentation on repainting explains this difference between live and historical indicator behaviour.
Choose which event the rule uses. A completed candle rule should wait for the completed candle. An intrabar rule needs data capable of showing what happened inside that candle. Testing one while describing the other creates a misleading comparison.
Automatic divergence labels deserve another check. If a script requires later candles to confirm a turning point, the label may appear beside an earlier candle even though it was not available then. Use the confirmation time as the earliest possible decision time.
Confirmation introduces delay. That delay is part of the method, not an inconvenience to remove from the results. A study should not use a confirmed signal while pretending it could have entered at an earlier, more favourable price.
How to Test an RSI Rule
Write the rule before inspecting its performance. Record the market, chart interval, RSI settings, price conditions, entry timing, expiry method and payout assumptions. Another person should be able to identify the same qualifying observations without asking what you meant.
A compact research record should include:
- The signal and confirmation timestamps, including the time zone.
- The RSI reading, relevant price levels and assumed entry quote.
- The expiry quote, payout, tie treatment and resulting profit or loss.
- Any missed signal or exclusion, with a reason defined in advance.
Separate development data from evaluation data. Use the first portion to formulate the rule, then assess the unchanged version on another period. If that result prompts revisions, the revised rule needs another fresh evaluation. The guide to backtesting binary options strategies covers the broader research process.
Assess returns rather than win rate alone. Record losing streaks, drawdown, trade count and whether a small number of sessions account for most of the result. Several overlapping signals during one market move should not be treated as wholly independent evidence.
Check what the dataset can establish. Candle closing prices cannot necessarily reproduce a contract’s acceptance quote or settlement benchmark. Where those records are missing, describe the exercise as a chart signal study rather than a verified contract performance test.
Finally, observe the frozen rule in paper trading. Record decisions as they become available. That makes it harder to skip inconvenient signals or redraw a range after seeing what price did next.
Common RSI Questions
What Is the Best RSI Setting for Binary Options?
No setting is established here as the best. RSI(14) is a practical research baseline, not a promise of accuracy. Any alternative needs evaluation for the chosen market, sampling interval, signal rule, expiry and payout. A setting that looks effective on selected screenshots has not passed that test.
Does RSI Above 70 Mean Price Will Fall?
No. It identifies an overbought momentum condition under the standard threshold convention. A bearish hypothesis still needs a defined trigger and horizon. Selling simply because RSI reaches 70 confuses a description of the current move with evidence about the next one.
Can RSI Work Alone?
A rule using only RSI can be tested, but its simplicity does not establish profitability. Adding more indicators does not establish it either. Use RSI within a clear technical analysis framework, then judge the complete rule by reproducible results, realistic contract assumptions and its performance on fresh observations.
This article was last updated on: October 22, 2026