GBP/USD binary options settle on whether the British pound meets a stated price condition against the US dollar within a set period. In a simple higher or lower contract, the question is whether GBP/USD finishes above or below a strike price at expiry. Predicting the direction is only part of the task: the timing, settlement price and payout also determine the result.
Australian retail restriction: ASIC’s order banning the issue and distribution of binary options to retail clients took effect on 3 May 2021 and extends until 1 October 2031. The ASIC announcement extending the binary options ban sets out that restriction. This article explains the market and contract mechanics for education, not as a route around the ban.
What the GBP/USD price means
GBP/USD expresses the value of one British pound in US dollars. At a hypothetical quote of 1.2700, £1 is worth US$1.27. A rise to 1.2750 means sterling has strengthened against the dollar. A fall to 1.2650 means sterling has weakened against it.
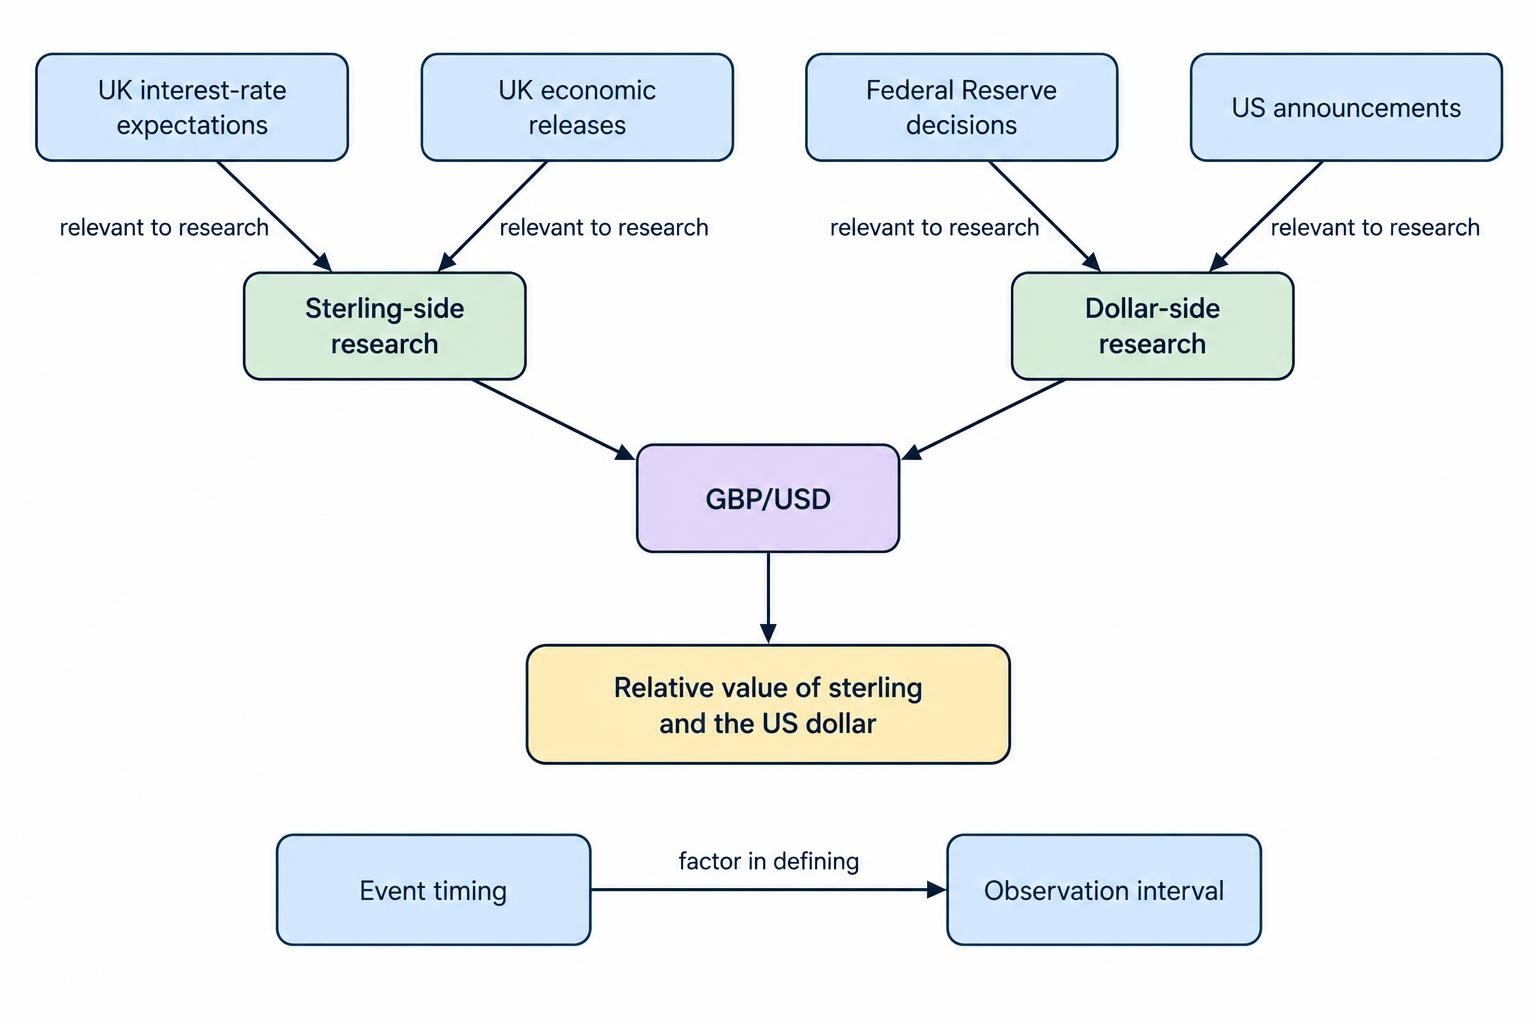
The pair can rise because the pound strengthens, because the dollar weakens, or because both happen together. Looking only at British news leaves half the comparison missing. The broader guide to forex markets for binary options covers how currency pairs express that relative value.
For GBP/USD, one pip conventionally equals 0.0001. A move from 1.2700 to 1.2710 is ten pips. A fifth decimal place represents a fraction of a pip. That distinction matters when a contract settles close to its strike: two prices that look identical on a rounded chart may produce different outcomes.
How GBP/USD binary options work
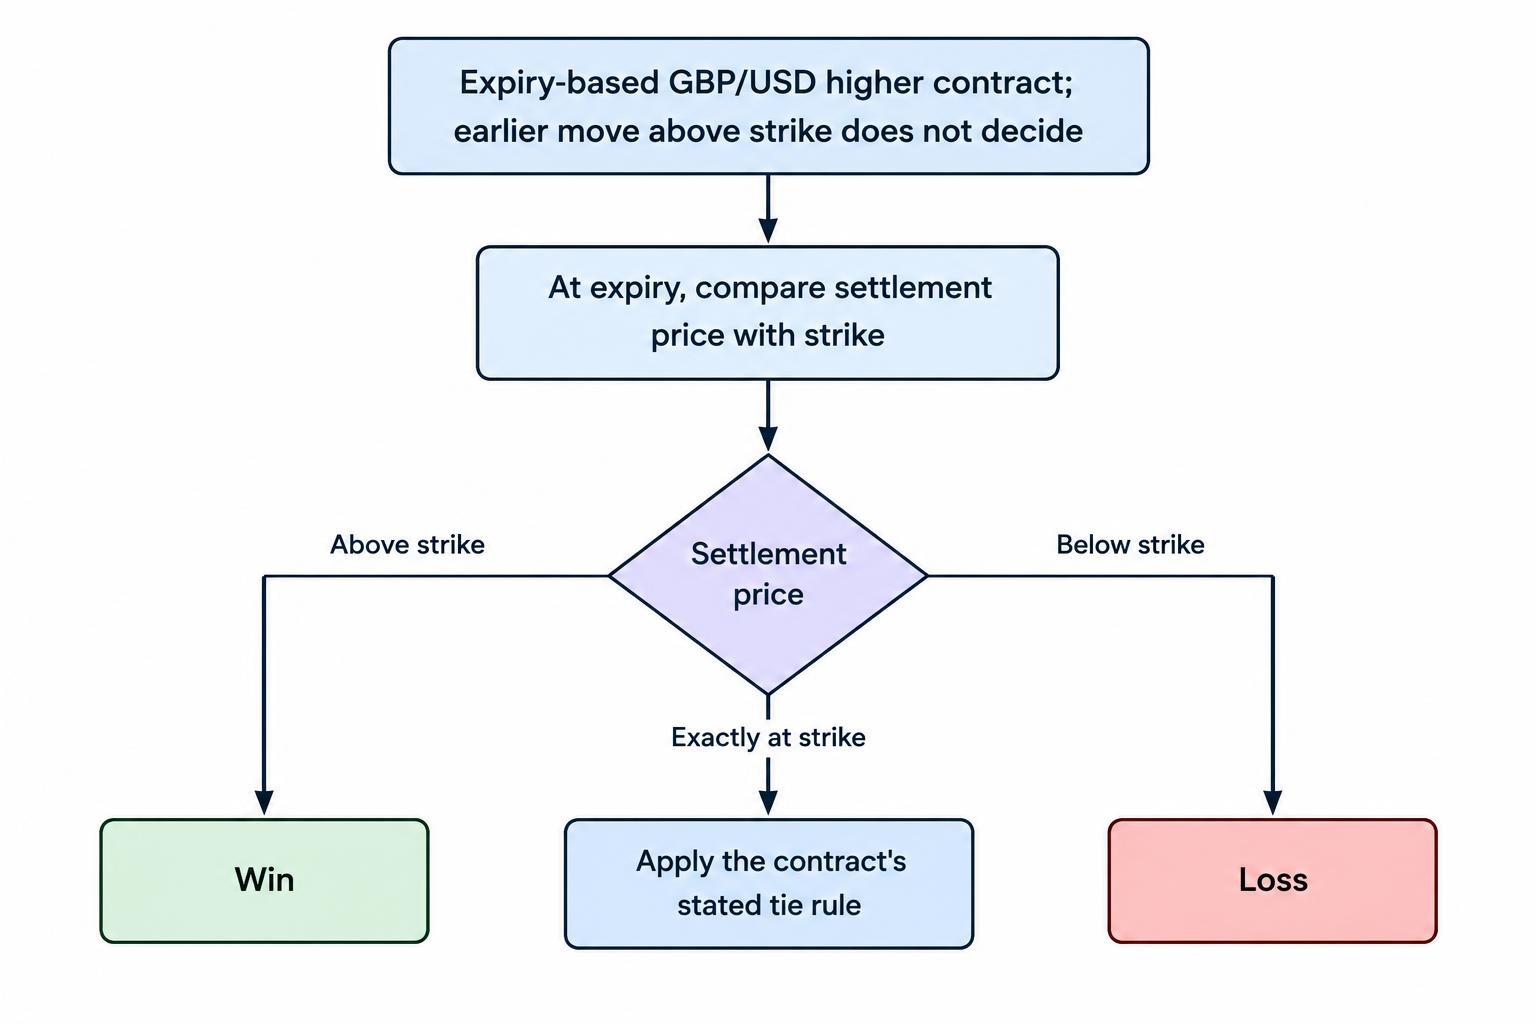
Consider a hypothetical higher contract with a strike of 1.27000, a five minute duration and an A$50 stake. Assume a successful outcome earns 80% profit on the stake, a losing outcome forfeits the stake, and the contract requires settlement strictly above the strike.
| Settlement price | Contract result | Net result |
|---|---|---|
| 1.27010 | Above the strike | A$40 profit; A$90 returned including the stake |
| 1.26990 | Below the strike | A$50 loss |
| 1.27000 | Exactly at the strike | Depends on the stated tie rule |
Under these assumptions, finishing one pip above the strike earns the same profit as finishing fifty pips above it. The distance travelled does not increase the fixed payout. Equally, finishing a fraction below the strike can lose the entire stake.
A higher or lower contract also differs from a touch contract. GBP/USD might move above the strike during the five minutes, then finish below it. That temporary move does not satisfy an expiry based higher contract. The final settlement condition controls the result, not the most encouraging moment on the chart.
The account currency is separate from the underlying quote. An example measured in Australian dollars does not mean GBP/USD is priced in Australian dollars, or that the contract gives ownership of either currency.
What moves GBP/USD?
Relative interest rate expectations
Interest rates matter through the comparison between the UK and the US. Holding other influences constant, higher UK interest rates relative to overseas rates can make sterling assets more attractive and support the pound. The Bank of England’s analysis of monetary policy transmission describes this exchange rate channel.
For contract analysis, distinguish the rate announced from what was expected beforehand. Suppose a hypothetical Bank of England rate increase matches expectations, but its accompanying message points to fewer future increases than anticipated. Treating the decision as an automatic reason for GBP/USD to rise would ignore the change in the expected policy path.
Even a sound assessment of the policy outlook does not establish where the pair will stand sixty seconds later. A macroeconomic argument and a short expiry contract answer different questions.
British inflation, employment and growth data
UK inflation, labour market, GDP and retail sales releases belong on a GBP/USD research calendar. Check the Office for National Statistics release calendar for confirmed publication dates and times rather than relying on an old screenshot or an unlabelled platform clock.
A useful research note separates the previous reading, any revision, the forecast and the new result. Suppose inflation falls from the previous month but remains above the forecast. Calling that release simply “lower inflation” discards the comparison that may matter to expectations.
Avoid turning such examples into rigid instructions. “Higher inflation means a higher contract” is not a complete method. It says nothing about what was already expected, the dollar side of the pair, the entry price or the time remaining before settlement.
US announcements and Federal Reserve decisions
The dollar needs its own event schedule. Federal Reserve decisions are particularly relevant because the associated material can include a policy statement, a press conference and, at selected meetings, economic projections. The Federal Reserve’s FOMC calendar and meeting documents identify those events and provide the published material.
For a paper exercise, mark each stage separately. An expiry after the statement but before the press conference tests a different interval from an expiry covering both. Grouping them under one label, such as “Fed day”, makes later results harder to interpret.
Do not assume that reading the first headline provides a reliable entry signal. A repeatable test needs a defined observation time and a recorded price, not a judgement made after the chart has already moved.
Trading sessions and Australian time zones
GBP/USD should not be treated as having identical conditions throughout the day. Sterling trading has historically concentrated in UK daytime hours, with volumes highest when London and New York are both open. The Bank of England’s November 2016 analysis of sterling liquidity documents that pattern and the risks associated with thinner trading conditions.
This makes session labels useful in research, but it does not make the London and New York overlap an automatic winning window. More trading activity does not tell you which side of a strike will win. A busy market and a predictable market are different things.
For Australian readers, record the event time in UTC alongside the local date and time. Do not reuse a fixed Sydney conversion throughout the year. Check whether each calendar displays local time, UK time, US time or the platform’s server time, and account for daylight saving changes.
Keep weekend observations separate from ordinary weekday GBP/USD observations. If a platform presents a weekend product bearing the same currency label, establish what generates its quote before treating it as equivalent market data. A familiar symbol is not a settlement specification.
Match the expiry to the question being tested
An upward trend on an hourly chart does not guarantee a higher settlement one minute after an entry. GBP/USD can pull back during a rising trend, cross the strike repeatedly, or remain below an entry until just after expiry. The direction was right, the expiry was not.
Define the research question before choosing the duration. A test of price behaviour after a scheduled announcement needs a different structure from a test of an ordinary session breakout. Keep the entry rule and duration unchanged while collecting observations; otherwise each result measures a different idea.
Also distinguish a fixed clock expiry from a duration measured from acceptance. Entering a contract labelled “five minutes” shortly before a fixed expiry may not provide five full minutes of exposure. The guide to binary options expiry times covers that distinction.
Longer duration is not automatically safer. It can reduce the importance of one brief fluctuation while allowing more time for another announcement or reversal. The expiry must fit the hypothesis, not serve as a rescue plan after an unfavourable move.
Payouts set the required win rate
The GBP/USD label does not determine whether a contract offers favourable mathematics. In the earlier example, a winning A$50 stake earns A$40, but a loss costs A$50. One win does not cancel one loss.
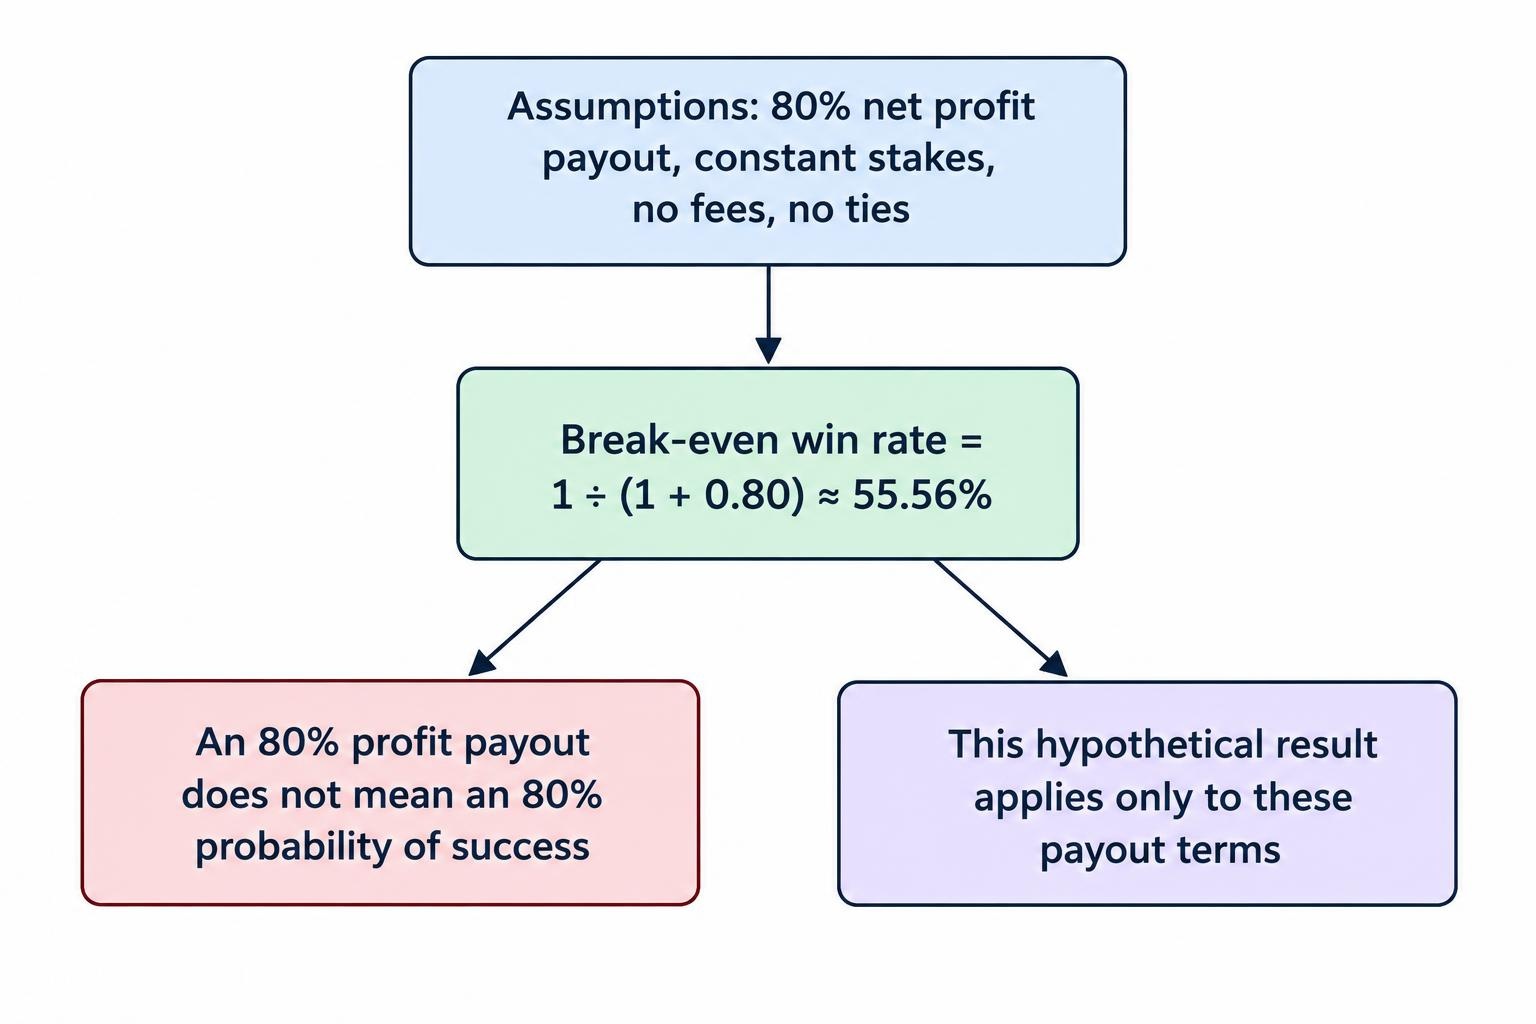
Assuming constant stakes, an 80% net profit payout, no fees and no ties, the break even win rate is:
Break even win rate = 1 ÷ (1 + 0.80) = approximately 55.56%.
Across twenty hypothetical contracts, eleven wins and nine losses produce A$440 in profits and A$450 in losses. That is a 55% win rate and a net loss of A$10. Being right more often than wrong is not enough under those terms.
Record the payout available at each observation rather than applying the best advertised percentage to every historical result. If the payout changes, the profitability calculation changes too. The explanation of probability and expected value in binary options develops the calculation beyond a single fixed payout.
A quoted 80% profit payout is not an 80% probability of success. Confusing those two percentages can make an unattractive contract look far more generous than it is.
Use the settlement feed, not whichever chart looks best
A contract’s rules should identify the price used to set the strike and determine settlement. Check whether that price is a bid, ask, midpoint or another defined reference, and whether settlement uses one observation or an averaging method.
Those details matter most near the strike. In a hypothetical case, an analysis chart might display 1.27001 while the contract’s settlement reference records 1.26999. Against a 1.27000 strike, the difference changes the result. A screenshot from the analysis chart alone would not establish which outcome the contract rules require.
Before interpreting a disagreement as an error, compare the timestamps, decimal precision and price definitions. The guide to price feeds and benchmarks covers these checks.
Keep click time separate from acceptance time as well. If a test uses a price that was visible before an entry could have been accepted, it may credit the method with an entry that was never available.
A practical GBP/USD paper research plan
Paper research lets the reader examine these mechanics without depositing money. Start with one narrow question, such as whether a clearly defined move beyond a recorded session range persists over a fixed observation period. That is a hypothesis to test, not a proven strategy.
- Define the observation: Record the session, entry condition, hypothetical strike and expiry before checking the outcome.
- Control the event window: Either exclude scheduled announcements under a written rule or analyse them as a separate group.
- Record the economics: Log the assumed stake, available payout, settlement price and treatment of ties.
- Keep rejected observations: Note why a case failed the entry rules instead of deleting it from the record.
Separate rule development from evaluation. Use one group of observations to form the rules, then assess them on later observations without changing the conditions midway. If a rule changes, begin a new test rather than blending the results.
The useful question is not whether GBP/USD produced an attractive chart pattern. It is whether a repeatable observation rule, applied before the outcome was known, produced results above the relevant break even threshold. Even a favourable paper record does not establish reliable live execution, counterparty safety or lawful product availability. The Australian retail restriction remains the starting point, not a footnote.
This article was last updated on: October 22, 2026