A profitable binary options demo account shows what happened inside a simulation. It does not establish that the same decisions would produce the same returns with real money, different contract terms or actual order acceptance. The screen can look identical while the evidence behind the balance is very different.
This study reviews published evidence and sets out a reproducible method for examining demo versus live trading differences. It does not report an original broker trial, a proprietary trade dataset or a measured industry average. The calculations below are hypothetical sensitivity tests, not observed trading results. For the account basics, see the separate guide to demo versus live binary options trading.
Australian context: ASIC’s prohibition on issuing and distributing binary options to retail clients took effect on 3 May 2021 and extends until 1 October 2031. Before the ban, 74–77% of active retail clients lost money during the 13 months examined by ASIC. Those figures describe actual client outcomes, not the percentage of profitable demo users who later failed. Both points appear in ASIC’s binary options ban extension announcement. Nothing in this methodology requires an Australian retail reader to open or fund a live account.
What the Published Evidence Establishes
Matched simulator and real account research
A Brazilian stock market study examined 39,734 simulator accounts, of which 3,109 subsequently opened real money accounts. The dataset included simulator activity through 2011 and real trading records for 2011 and 2012. More active and riskier simulator users were more likely to open real accounts. Strong performance in a user’s best individual stock, rather than the portfolio as a whole, also predicted account opening and was associated with poorer subsequent real account performance. The accessible primary research appears in Chapter 2 of Luqi Xu’s dissertation, “Trading Simulations and Real Money Outcomes”.
This was stock trading research, not a binary options experiment. It examined associations among simulator behaviour, account opening and later performance; it did not randomly assign people to demo and live conditions. It therefore cannot establish that simulation caused the poorer results, or supply a percentage discount to apply to binary options demo profits.
The practical research question is narrower: does a participant evaluate the complete record, or mistake a memorable winner for evidence of skill? A binary options audit should preserve every qualifying decision, not just the profitable screenshots.
Hypothetical results omit real financial exposure
Simulated results cannot fully represent how financial risk affects a participant’s willingness to withstand losses or follow a trading programme. Hypothetical models can also misrepresent execution conditions. These limitations are addressed in the NFA interpretive notice on hypothetical performance results. This is a US futures industry standard, not an Australian binary options rule, and its discussion of hindsight should not be applied automatically to every forward running demo.
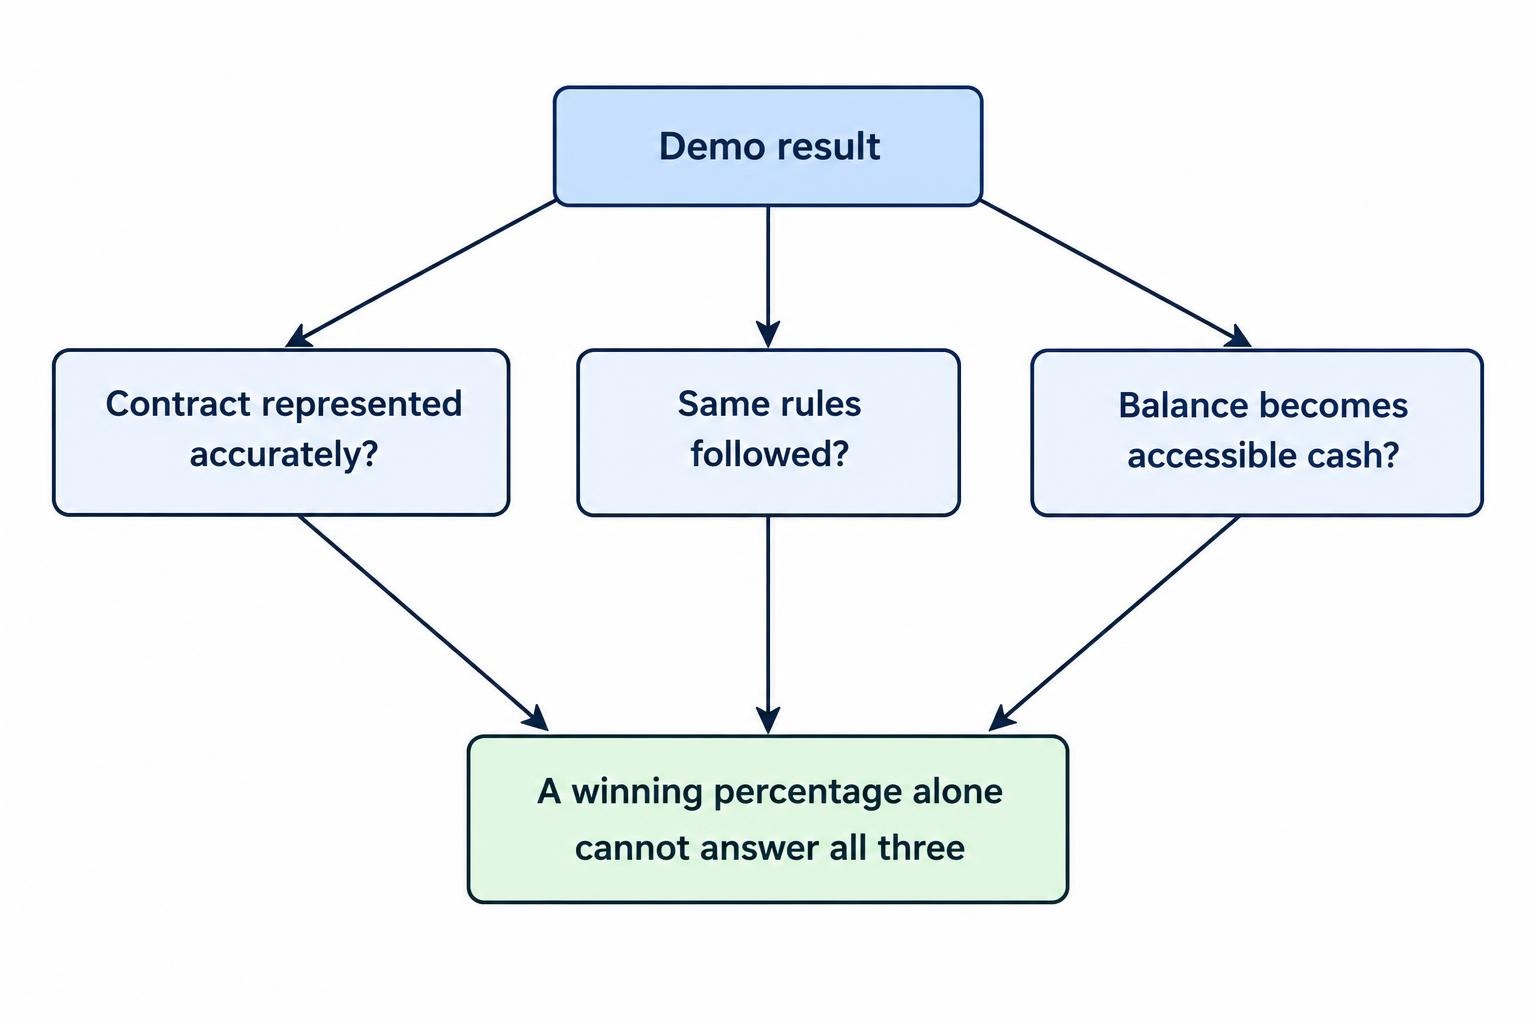
For this study, that distinction creates three separate questions: whether the simulation represents the contract accurately, whether the participant follows the same rules, and whether the resulting account balance can become accessible cash. One winning percentage cannot answer all three.
What a Demo Versus Live Study Should Measure
The comparison should separate contract differences from changes in behaviour. Otherwise, a lower return might be blamed on execution when the participant actually changed expiry times or increased stakes after losses.
| Dimension | Evidence to collect | Question it answers |
|---|---|---|
| Contract economics | Stake, net winning payout, loss amount and tie treatment | Did both environments offer the same payoff? |
| Order acceptance | Request time, acceptance time, accepted strike and rejection records | Was the intended contract actually obtained? |
| Settlement | Expiry timestamp, reference feed and recorded settlement value | Were outcomes determined on comparable terms? |
| Decision behaviour | Qualifying signals, skipped entries, extra trades and stake changes | Did the participant follow the same process? |
| Cash access | Account statements and completed withdrawal records | Did a displayed balance become received funds? |
Measure the accepted contract, not just the chart visible when someone clicked. A timestamped signal and a later accepted entry are different observations. The mechanics belong in the guide to binary options execution and latency; the research task is to establish whether those differences occurred in the records.
Do not assume that every live entry suffers a worse price, that every demo offers inflated payouts, or that a different outcome proves manipulation. Each is a claim requiring evidence. Where a field is unavailable, report it as unknown rather than inserting an estimate that looks measured.
A Hypothetical Comparison: How Small Changes Affect Returns
The following calculation isolates two possible differences without claiming that either occurs at any particular platform.
Assume 100 accepted contracts, each with an A$10 stake. There are no ties, refunds, fees, early exits or changes in stake size. “Payout” means net profit on a winning contract, excluding the returned stake. Every losing contract loses the full A$10.
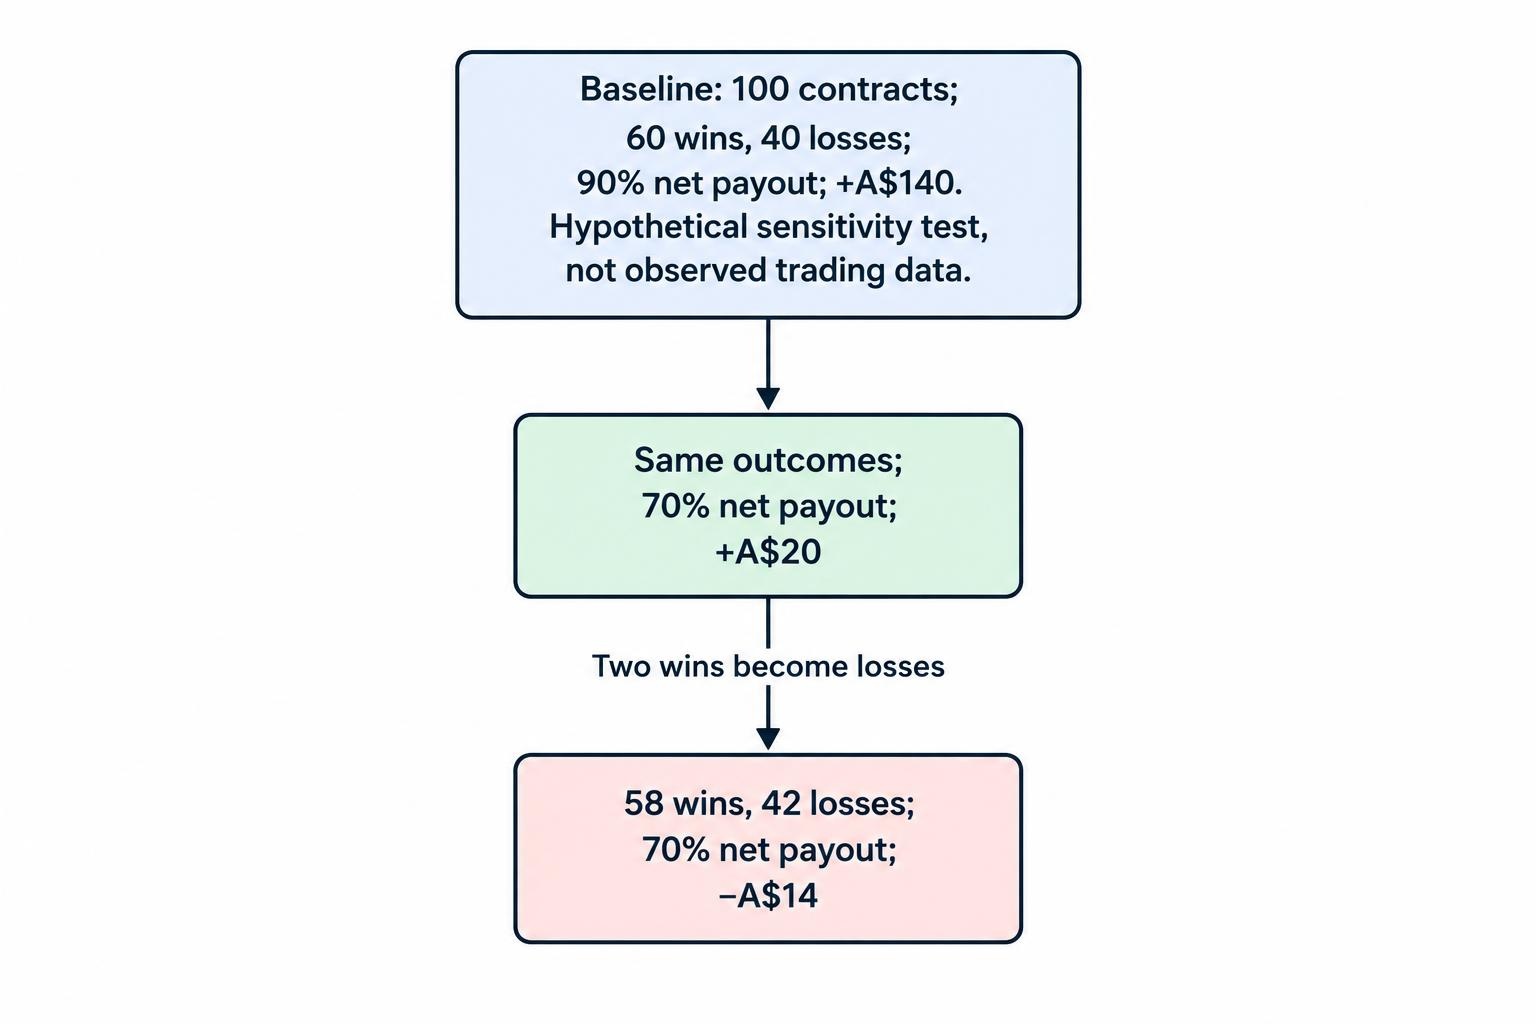
In the baseline simulation, 60 contracts win and 40 lose. A 90% net winning payout produces A$9 profit per win. Total profit is therefore A$540 minus A$400, or A$140.
Keep those outcomes unchanged but reduce the payout to 70%. Each win now produces A$7, leaving A$420 minus A$400, or A$20. The forecast accuracy has not changed. The economics have.
| Scenario | Net winning payout | Wins / losses | Net result |
|---|---|---|---|
| Baseline simulation | 90% | 60 / 40 | +A$140 |
| Lower payout only | 70% | 60 / 40 | +A$20 |
| Lower payout and two wins changed to losses | 70% | 58 / 42 | −A$14 |
In the third scenario, suppose different accepted strikes change two previously winning outcomes into losses. At the 70% payout, each change removes an A$7 profit and adds an A$10 loss. Two changes reduce the result by A$34, turning A$20 profit into A$14 loss.
With a 70% net payout and full stake losses, the break-even win rate is 1 ÷ 1.70, approximately 58.82%, before other costs. The assumptions and wider calculations are covered in probability and expected value in binary options.
This example does not estimate a typical demo to live performance gap. It shows why a study must record both outcomes and contract terms. Applying a blanket haircut to demo profits would hide the mechanism rather than measure it.
A Reproducible Research Design
Define the question before examining results
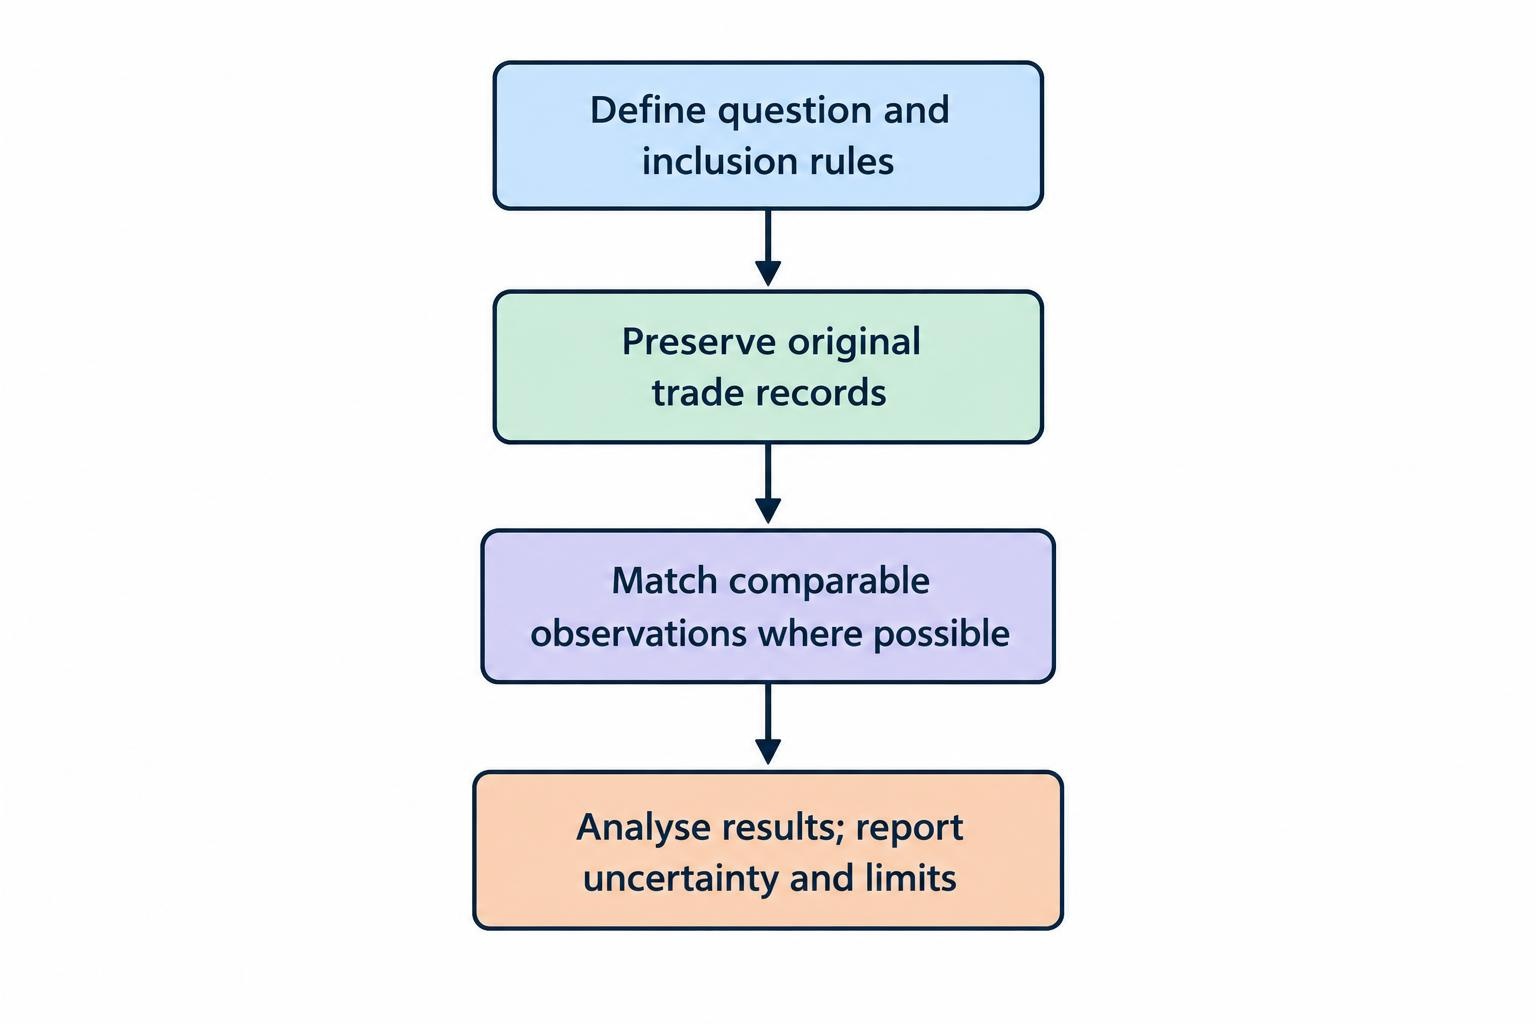
A useful primary question is: “How much of the observed return difference remains after matching contract terms and trading rules?” That is more testable than asking whether demo trading “works”.
Write the inclusion rules before calculating performance. Identify the product type, underlying market, observation dates, expiry convention, stake rule and treatment of incomplete records. Keep exchange traded contracts separate from broker issued fixed payout contracts unless their structural differences are expressly modelled.
Use lawfully obtained historical records or an approved research dataset. An Australian retail study can analyse existing records and run hypothetical comparisons without arranging prohibited live binary options distribution. Legal eligibility and data availability are prerequisites, not problems to work around.
Preserve the original trade records
Retain the original exports alongside a cleaned analysis file. Record account environment, trade identifier, instrument, direction, stake, offered payout, accepted strike, expiry and settlement outcome. Where available, preserve both request and server acceptance timestamps, using a consistent time zone.
A screen recording can support the audit but should not replace transaction records. If the interface displays only whole seconds, it cannot establish millisecond execution differences. Likewise, a screenshot of a winning balance does not document rejected orders or deleted trading history.
Separate observation from interpretation. “The acceptance timestamp was later” is an observation. “The delay caused the loss” requires a defensible reconstruction of what would otherwise have happened.
Use comparable observations
A before and after comparison can mix account effects with changing market conditions. A demo period during orderly prices and a later live period during sharp reversals do not isolate the account environment.
Where records permit, match observations by market, session, contract duration and underlying decision rule. Record the accepted terms in each environment rather than assuming that matching instrument labels mean matching contracts.
If simultaneous matched records are unavailable, describe the work as an observational comparison. Do not present its return difference as a causal estimate of demo account bias.
Record decisions that never became trades
The dataset should include qualifying signals that were skipped, orders that were rejected and trades placed outside the written rules. Otherwise, an audit may compare disciplined demo selections with a different set of live decisions.
Keep the denominator visible. Report signals, attempts, acceptances and settlements separately. Rejected orders should not disappear from an execution analysis simply because they generated no profit or loss.
A consistent trading journal can organise these fields. It should preserve the rule and rationale recorded before the outcome, not a tidier explanation written afterwards.
How to Analyse the Results Without Overclaiming
Begin with a transparent reconciliation: qualifying decisions, attempted orders, accepted contracts, wins, losses, ties and missing settlements. Then calculate profit from the recorded payout and stake for each contract. An average advertised payout is not a substitute for the terms actually accepted.
Report profit per accepted contract and per unit staked alongside the winning percentage. Keep changing stake sizes separate from prediction accuracy. One large losing trade can dominate the account result without explaining whether the entry rule deteriorated.
For matched observations, examine the differences directly: payout changes, acceptance timing, strike differences and settlement disagreements. Include a denominator with every rate. “Four mismatches among 200 matched contracts” is more informative than “a few trades looked wrong”.
Statistical uncertainty also needs attention. A positive result over 100 trades does not establish a durable advantage. Repeated contracts taken during the same price move may share much of the same exposure, so treating every contract as independent can overstate the amount of evidence.
A defensible report should explain its uncertainty method and examine results by day or session where appropriate. If the records cannot support formal inference, publish descriptive results and say so.
Keep strategy development separate from evaluation. If the entry rule changes after every losing batch, the resulting history no longer evaluates one fixed rule. Preserve each version, identify when it changed and reserve later observations for assessment.
Why Withdrawals Need a Separate Evidence Track
Execution records and account balances do not establish that money can be withdrawn. Complaints involving refused reimbursements, blocked withdrawals and manipulated trading software are documented in the joint CFTC and SEC alert on binary options fraud. These are documented complaint categories, not evidence that every platform or every disputed trade is fraudulent.
A study should therefore distinguish displayed profit, a submitted withdrawal request and funds received. None is interchangeable with the others.
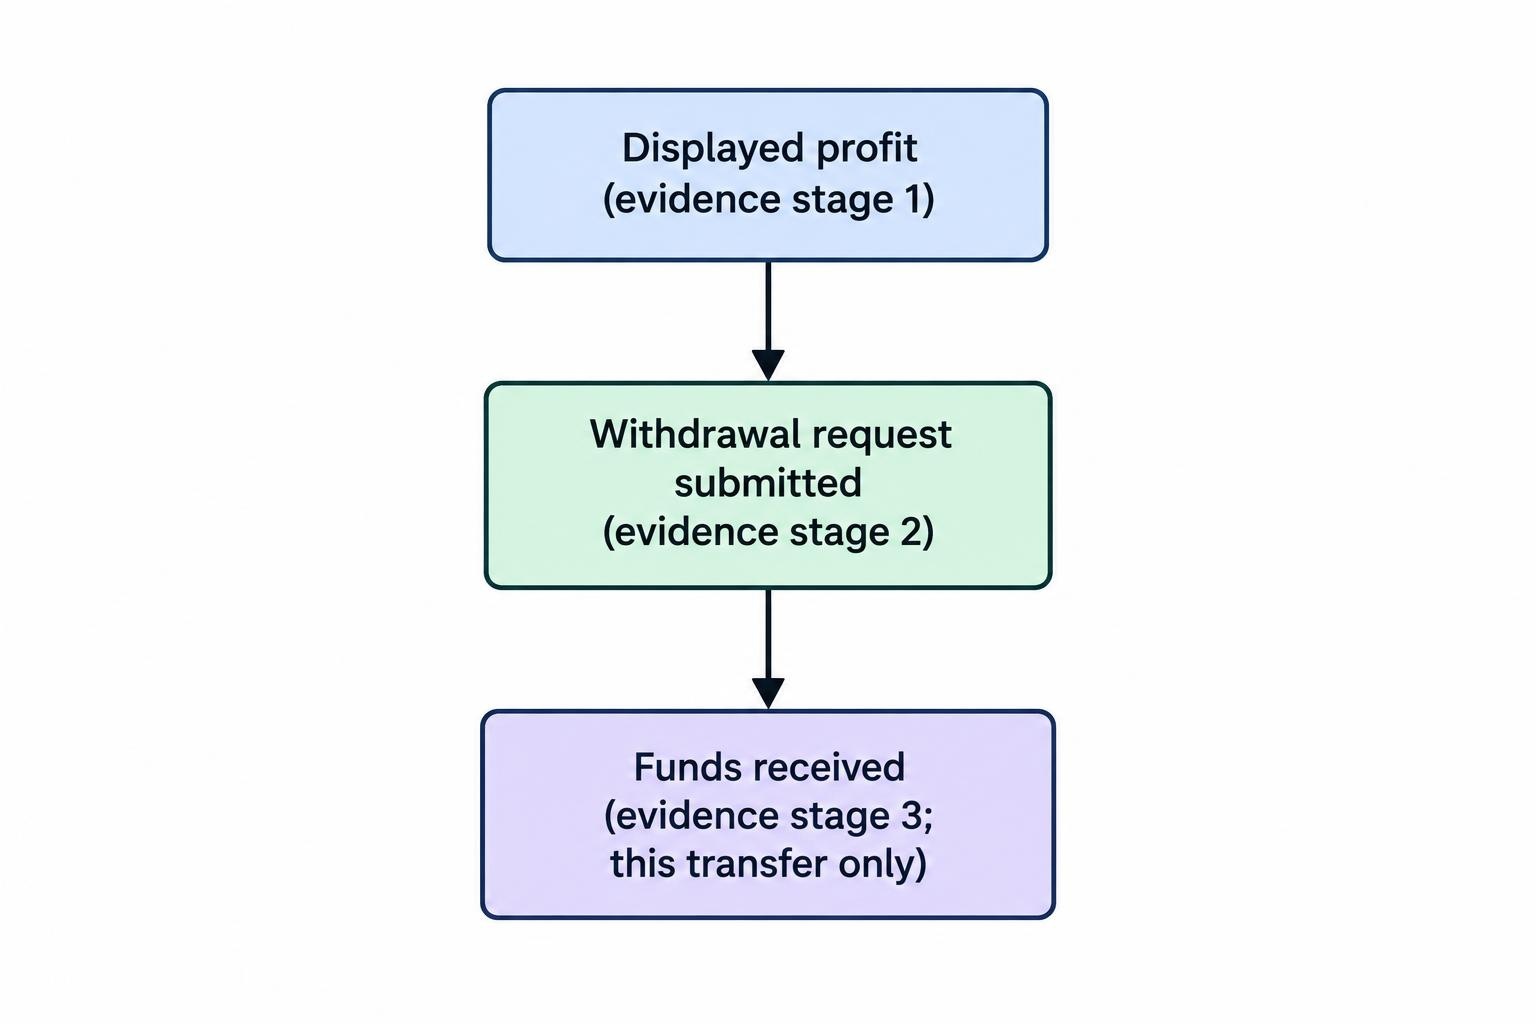
One completed withdrawal establishes that one payment occurred under those circumstances. It does not establish continuing solvency, unrestricted access to the remaining balance or future payment reliability. Conversely, an unresolved request needs investigation before its cause can be classified.
Do not deposit money just to fill a gap in the research. If withdrawal evidence is absent, the correct finding is “cash access not assessed”. A demo balance cannot supply that missing observation.
What a Defensible Study Can Conclude
A useful final report should state the dataset’s origin, observation period, inclusion rules, missing fields and whether comparisons were genuinely matched. It should distinguish published findings, original observations and hypothetical calculations throughout.
The strongest finding may be narrow: different payouts explain the return difference, accepted strikes account for several changed outcomes, or participant rule changes prevent a fair comparison. “Not enough evidence” is also a valid result. A reset button is not a risk control, and a polished dashboard is not a research method.
This review supports a cautious interpretation: demo records can document simulated decisions, but they do not establish equivalent live execution, behaviour or access to cash. It provides no measured binary options industry conversion rate from demo success to live profitability.
Related work in the binary options research collection examines payouts, loss statistics and settlement evidence separately. Keeping those questions separate makes the combined assessment more useful—and much harder to dress up as a promise of profit.
This article was last updated on: October 22, 2026