60 second binary options strategies try to predict whether a price will finish above or below a contract’s strike one minute later. The practical challenge is not finding an indicator that flashes often. It is producing enough correct forecasts to overcome the payout disadvantage, using prices and timestamps that match the contract.
For Australian retail clients, this is an educational topic, not a route to live trading. ASIC’s ban on issuing and distributing binary options to retail clients took effect on 3 May 2021 and has been extended until 1 October 2031. The ASIC binary options ban extension covers the regulatory position. The examples below are frameworks for paper testing, not proven profitable systems.
What a 60 Second Strategy Must Predict
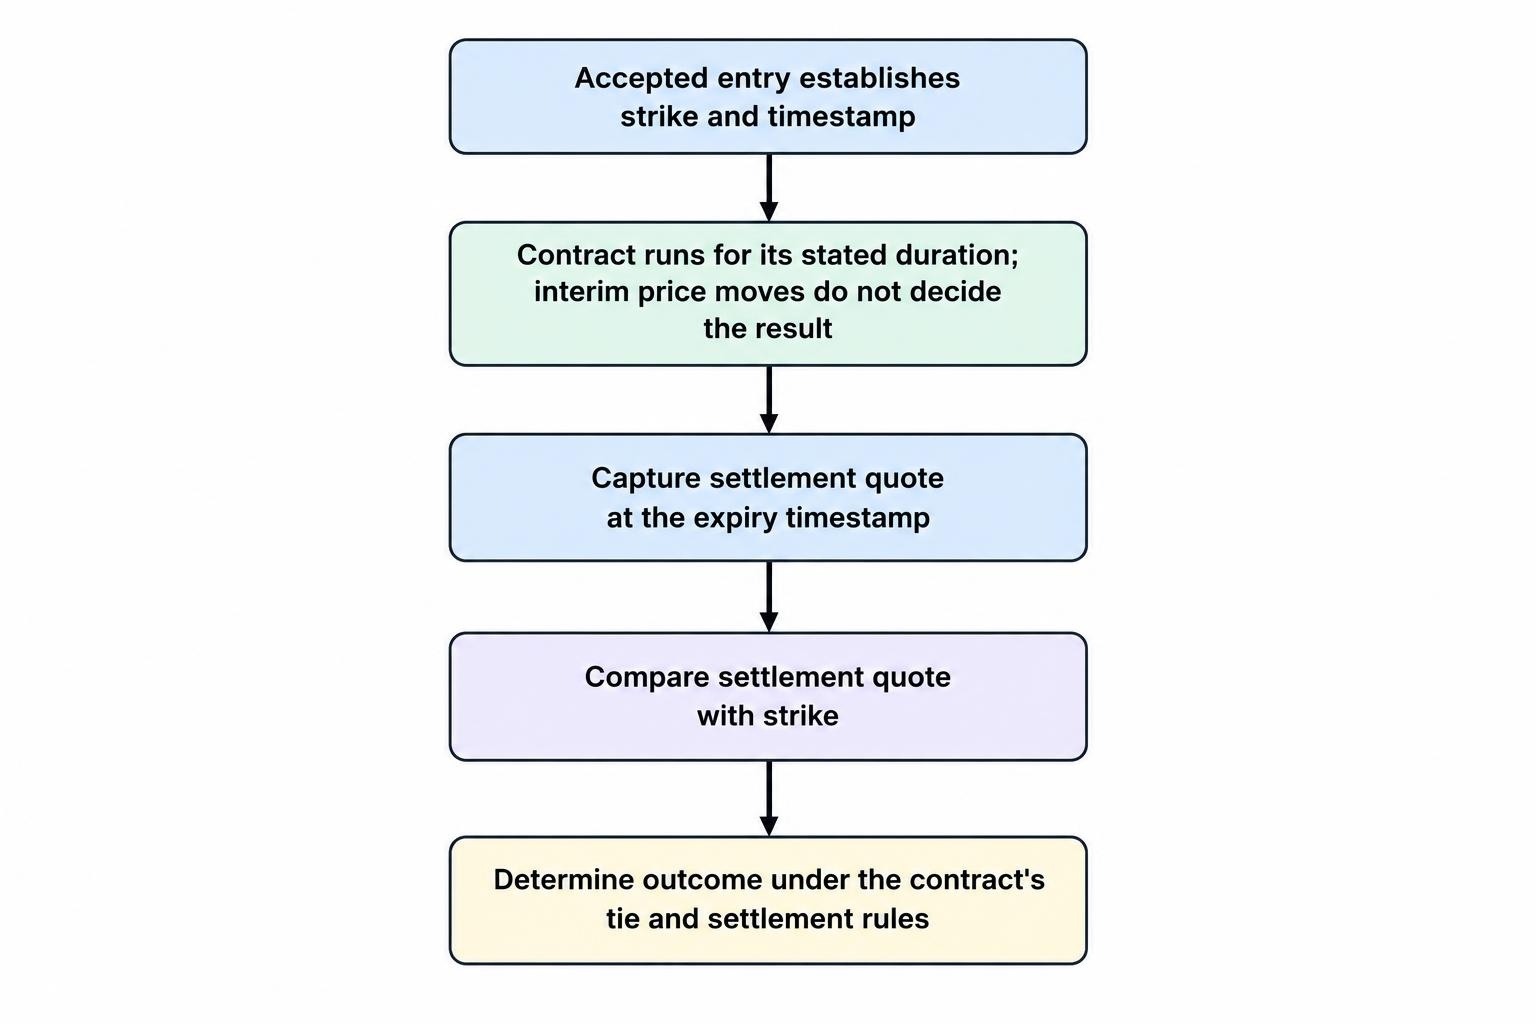
For a straightforward higher or lower contract, the relevant question is where the settlement price finishes relative to the strike. A price move in the predicted direction before expiry does not necessarily produce a winning result.
Suppose a hypothetical higher contract has a strike of 0.66000. The price reaches 0.66008 after 20 seconds but settles at 0.65999 after 60 seconds. Under terms requiring settlement strictly above the strike, the contract loses. A correct observation about the initial move was not a correct expiry forecast.
A one minute chart also does not automatically match a 60 second holding period. An entry accepted at 12:00:18 with a duration of 60 seconds expires at 12:01:18, not at the 12:01:00 candle close. A fixed expiry contract could have a different remaining duration again.
Before testing, define the strike, acceptance timestamp, expiry timestamp, settlement feed and treatment of ties. Do not assume an external chart’s last traded price matches the price used to settle a contract. Our guide to binary options execution and latency covers the gap between recognising a signal and obtaining an accepted entry.
Start With the Payout Maths
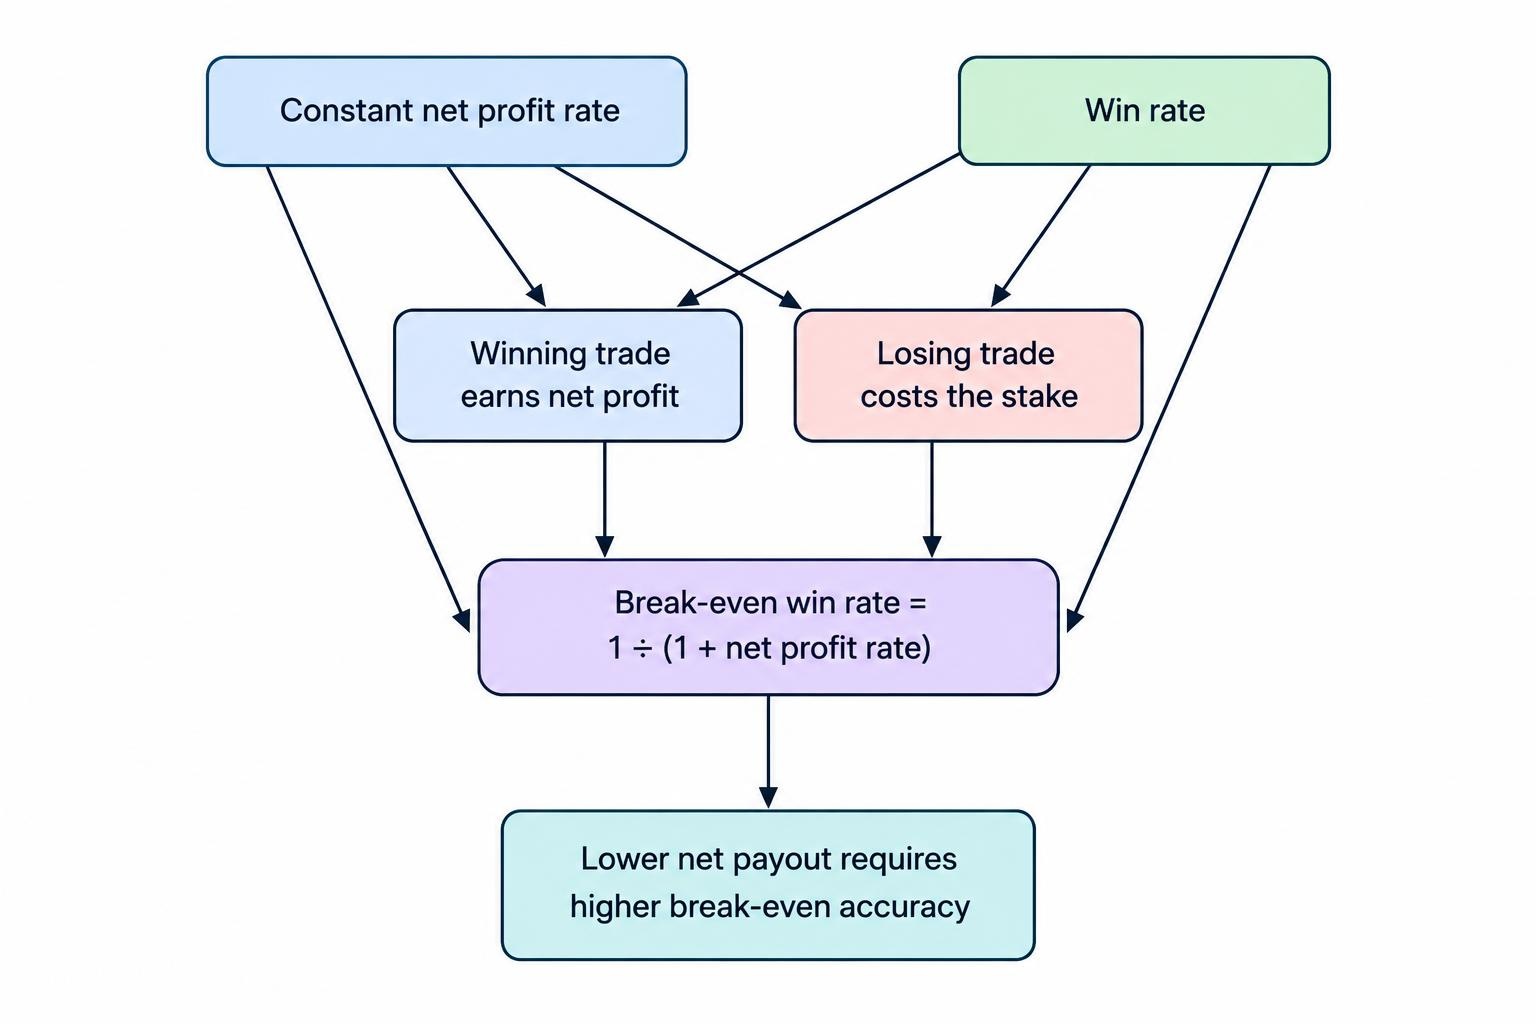
A strategy’s required accuracy depends on its net profit per winning contract. An advertised “80% payout” needs a precise definition. In the following examples, it means an $8 profit on a $10 stake, with the original stake also returned. A losing contract costs the full $10.
With a constant payout, no fees and no ties, the calculation is:
Break even win rate = 1 ÷ (1 + net profit rate)
| Net profit on a win | Profit on a $10 stake | Break even win rate |
|---|---|---|
| 70% | $7 | 58.82% |
| 80% | $8 | 55.56% |
| 90% | $9 | 52.63% |
Consider 100 paper trades at an 80% net payout, each with a $10 stake. With 55 wins and 45 losses, the result is $440 in winning profits minus $450 in losses: a $10 loss. Winning more often than losing was not enough.
At a 70% payout, those same results would lose $65. This is why a screenshot showing an attractive win rate tells only part of the story. Record the payout available for every simulated entry, rather than assigning the best observed payout to the entire test. The relationship between accuracy and profitability is covered in probability and expected value in binary options.
Three Strategy Frameworks for Paper Testing
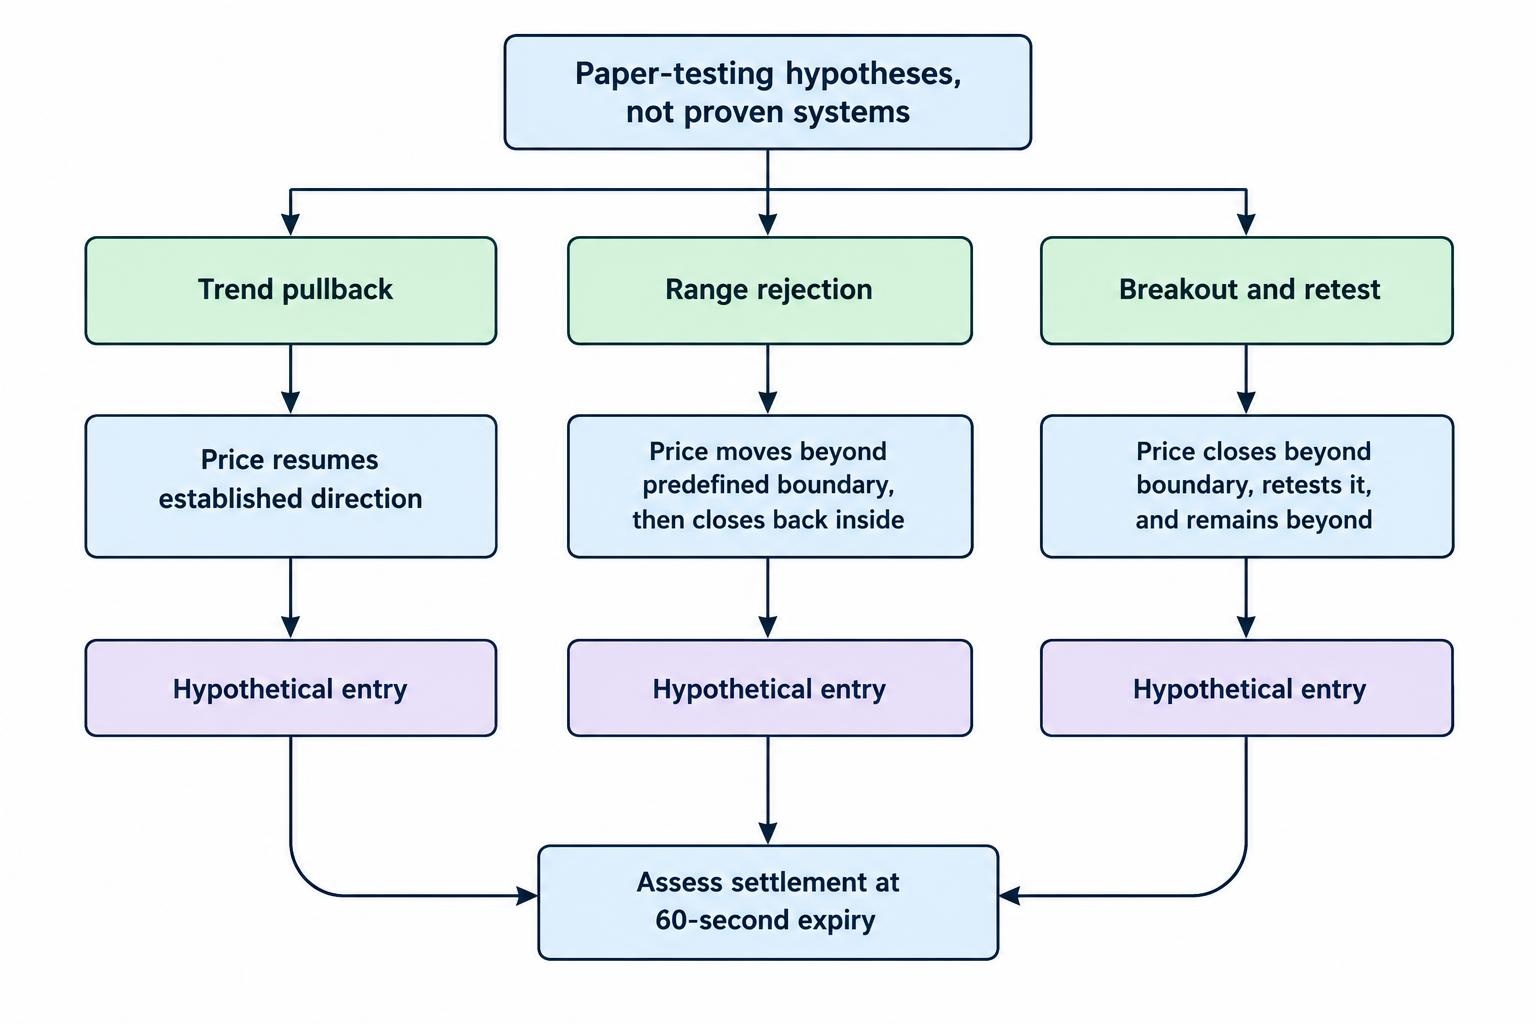
The following setups express different hypotheses: continuation, rejection and breakout acceptance. Their parameters are illustrative starting rules, not recommended settings. Choose one framework before collecting results. Switching between them after seeing what happened makes the record difficult to evaluate.
Trend Pullback: Test Whether Direction Resumes
A trend pullback framework asks whether a brief move against an established direction is followed by renewed movement within the next minute.
One paper specification could require the last two confirmed swing highs and swing lows on a five minute chart to be rising. Define a swing using a fixed rule, such as a high with two lower highs on either side, and use it only after those later candles have closed.
On the one minute chart, mark a pullback towards a rising 20 period moving average. A candidate higher signal could occur when a completed candle closes back above that average after the preceding candle closed below it. Record the next available quote as the simulated strike, then assess settlement 60 seconds later.
The moving average is a reference point, not evidence of predictive power. The hypothesis fails whenever the rebound does not leave settlement above the accepted strike. Even a continuing five minute uptrend can contain a losing one minute interval.
Reject entries where the five minute structure has already broken. Also define whether a second signal during the same pullback counts as another opportunity. Otherwise, one price movement can become several selectively recorded “trades”.
Range Rejection: Test a Return From an Established Boundary
A range rejection framework asks whether price moves back inside a previously defined trading band after testing its edge. The boundary must exist before the candidate signal appears.
For a reproducible exercise, define the upper and lower boundaries from the highest and lowest prices of the preceding 20 completed one minute candles, excluding the signal candle. Freeze those boundaries while evaluating the signal. Require a candle to move beyond one boundary and then close back inside it.
A rejection of the lower boundary becomes a hypothetical higher signal; rejection of the upper boundary becomes a hypothetical lower signal. Record entry after the rejection candle closes, rather than pretending an entry occurred at its most favourable price.
The distinction between a rejection and a break needs written rules. Our support and resistance guide covers how to define price areas without treating them as guaranteed turning points.
The central weakness is timing. Price might return towards the range centre after three minutes but remain beyond the strike after one minute. That would support a broader reversal idea while still failing the 60 second test. Do not extend expiry retrospectively to rescue the result.
Breakout and Retest: Test Acceptance Beyond a Boundary
A breakout framework takes the opposite position: price may continue beyond an established boundary instead of returning inside it.
Using the same frozen range definition, one paper rule could require a completed candle to close above the upper boundary. During the next three completed candles, require a retest that touches the boundary but closes above it. A hypothetical higher entry follows that confirmation. Reverse the conditions for a lower signal.
This rule deliberately misses breakouts that never retest. That is acceptable. A testable strategy needs a defined set of opportunities, not a claim on every move visible afterwards.
Record how far the accepted strike sits beyond the boundary. If confirmation arrives only after a large move, the subsequent minute may fail the test despite the breakout remaining intact. Also record rejected setups: a retest closing back inside the range should not become a continuation signal because the next candle happened to recover.
None of these frameworks establishes an advantage by description alone. A clear rule is the beginning of a test, not its result.
Define When the Strategy Does Nothing
A usable specification needs exclusions as well as entry conditions. For these paper exercises, exclude periods where timestamps are missing, quotes have stopped updating or the settlement method cannot be reproduced. Mark the observation as untestable rather than guessing the outcome.
Scheduled announcements should have a separate treatment. For an AUD/USD exercise, the RBA’s 2026 monetary policy announcement schedule places decision releases at 2.30 pm on the second meeting day. Match the published local time to the timezone used in your data.
You could predefine an exclusion window around those releases, then test announcement periods separately. The chosen window is a research rule, not a proven safe interval. Do not remove announcement losses after the test while retaining announcement wins.
Apply the same discipline to payout changes. If a paper strategy requires at least an 80% net payout, an otherwise valid signal at 70% is a skipped observation. It is not a win or loss that can be added later when convenient.
How to Test Without Giving Yourself Imaginary Entries
A useful binary options backtesting process separates information available at entry from information revealed afterwards. If a signal requires a completed candle, its closing price and final indicator reading cannot justify an entry several seconds before that close.
Ordinary one minute candles may also be insufficient. Their opening, highest, lowest and closing prices do not identify the quote at every possible expiry second. An entry at 12:00:18 requires a settlement observation at 12:01:18 under the assumed duration. The 12:01 candle close cannot substitute for that observation.
Keep a compact record containing:
- Instrument, date, timezone and strategy version.
- Signal timestamp, simulated acceptance time and entry quote.
- Expiry timestamp, settlement quote and tie treatment.
- Net payout, paper stake and resulting profit or loss.
- Any exclusion, missing data or rule breach.
Where historical contract payouts or settlement feeds are unavailable, label the output accurately: it is a price direction study under assumed terms. Do not present it as a reconstruction of achievable trading returns.
Use an initial period to develop the rules, then freeze them before testing later dates. Record every variation tried. Repeatedly changing lookback lengths, indicator settings and filters on the same history can produce an attractive result by chance, a problem examined in the research paper Backtest Overfitting in Financial Markets.
Then conduct a forward paper test, recording signals as they occur. Review results across dates and sessions, not just as one pooled win rate. Report uncertainty rather than treating a small margin above break even as proof. Several entries clustered around the same movement should also be identified, not presented as wholly separate evidence.
Keep Stake Rules Separate From Signal Rules
Use a constant paper stake while assessing forecast quality. Otherwise, a few large simulated wins can conceal a weak entry rule, or a stake increase can make an ordinary losing sequence look like a different strategy.
Doubling after losses does not repair an unfavourable payout. Consider stakes of $10, $20, $40 and $80, all losing. The accumulated loss is $150. A subsequent $160 win at an 80% net payout earns $128, leaving the sequence $22 down. The familiar doubling rule does not even guarantee recovery under these assumptions.
Nor does reducing the stake establish that the strategy works. It changes the size of the financial outcome, not the accuracy required to break even.
The historical context matters here. In the 13 months before Australia’s ban, 74–77% of active retail binary options clients lost money. These are historical market findings, not a measured failure rate for the three examples above; the figures appear in Moneysmart’s binary options warning.
A Chart Pattern Cannot Resolve Platform Risk
Separate two questions: whether a forecasting rule has evidence behind it, and whether a provider will honour the contract and return funds. An answer to the first does not settle the second.
The SEC and CFTC have documented complaints involving refused withdrawals, identity theft and alleged software manipulation designed to generate losing binary options trades. The joint investor alert on binary options fraud includes allegations of altered prices, payouts and expiry countdowns.
That does not mean every losing expiry is manipulation. A price discrepancy can require investigation of timestamps, quote types and contract terms. But a profitable-looking demo record cannot establish that a provider’s live settlement or withdrawal process is trustworthy.
For Australian readers, the practical response is to keep these exercises on paper rather than treating access to an offshore platform as permission to trade.
What Would Count as a Useful Result?
A useful result is a documented answer to a narrow question: did a fixed rule predict the required settlement outcome often enough to overcome the assumed payout, using entries that could be reconstructed without hindsight?
If the result disappears after correcting timestamps, lowering payouts to their recorded values or testing fresh dates, reject the rule. If it survives, investigate the remaining uncertainty. Neither outcome justifies guaranteed returns or a daily income promise. A stopwatch is not a business model.
Use the wider binary options strategy guides to compare the hypotheses behind continuation, reversal and breakout methods. The standard remains the same: explicit rules, honest settlement data and results that do not depend on rewriting the test after the event.
This article was last updated on: October 22, 2026