Average True Range (ATR) measures the size of recent price ranges, including gaps from the previous close. It helps distinguish relatively quiet conditions from wider price swings. It does not tell you whether the next candle will rise or fall, or whether a binary option will finish above its strike.
For Australian readers, the regulatory position comes first: ASIC’s ban on issuing and distributing binary options to retail clients remains in force until 1 October 2031. The examples below are for education and paper analysis, not a recommendation to use an offshore platform.
ATR’s useful role is narrower than many indicator tutorials suggest. It puts price movement into context. A six pip move means something different when recent ranges average three pips than when they average fifteen. That context can improve a research process, but it cannot turn a chart reading into a reliable probability.
How Average True Range Is Calculated
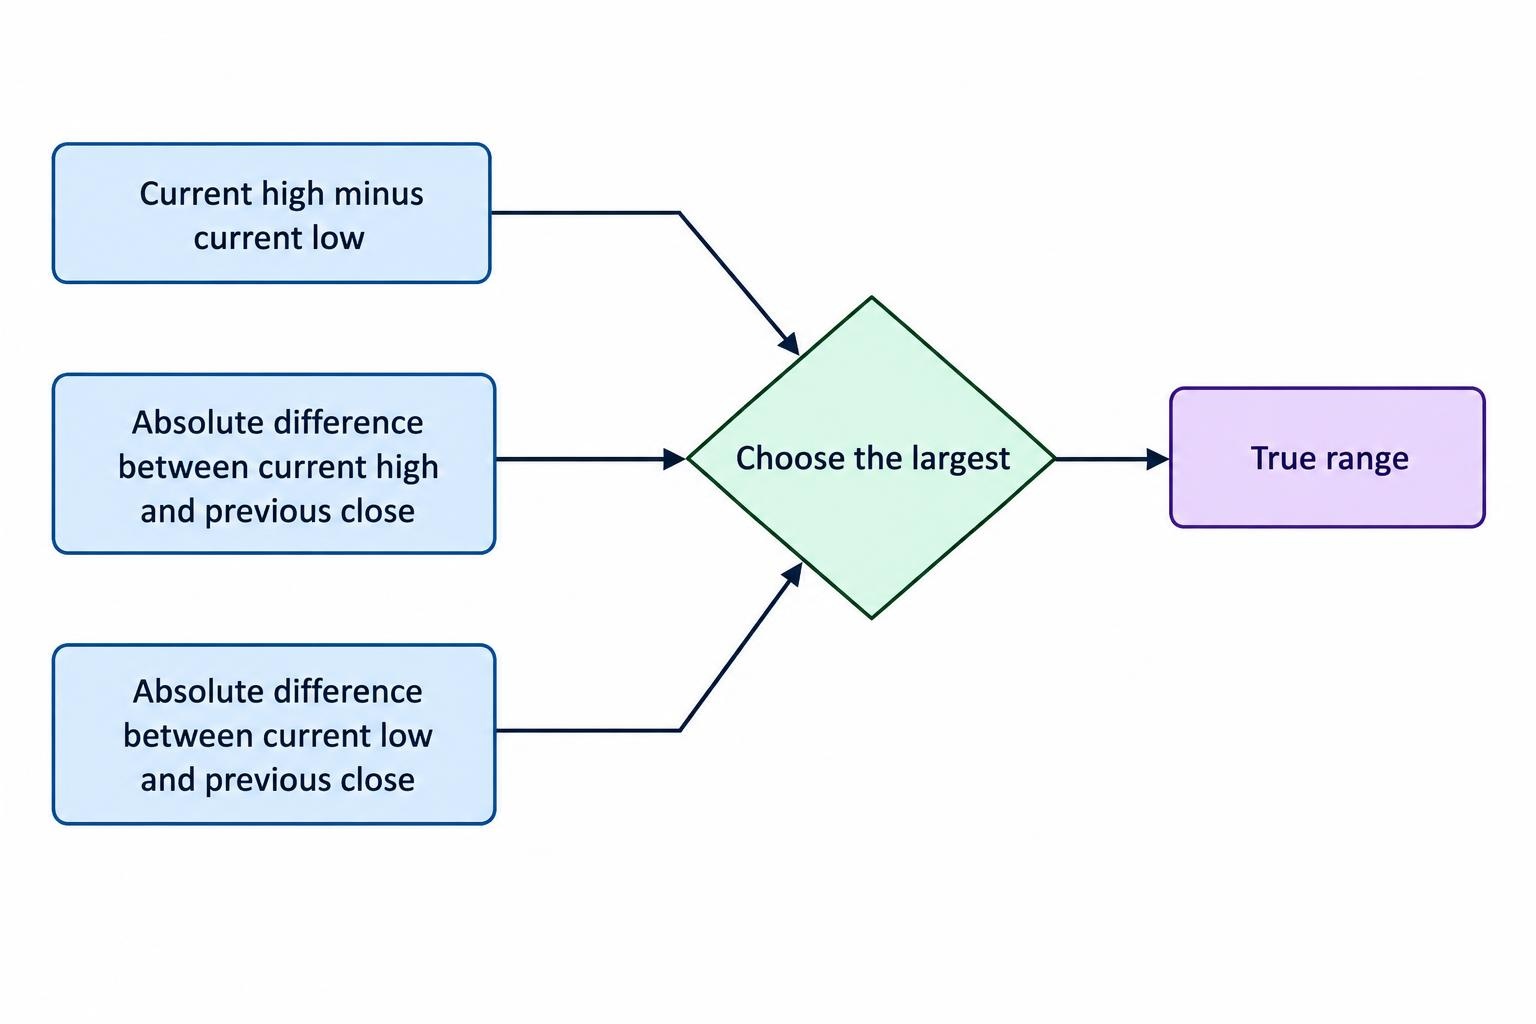
ATR starts with true range, which measures the largest of three distances:
- The current candle’s high minus its low.
- The absolute difference between the current high and the previous close.
- The absolute difference between the current low and the previous close.
Using absolute differences removes direction from the calculation. A gap down can increase true range just as a gap up can. The calculation captures movement that a simple high minus low measurement would miss.
A worked true range example
Suppose a hypothetical EUR/USD candle has a high of 1.0850 and a low of 1.0838. The previous candle closed at 1.0830.
The candle’s own range is 0.0012, or 12 pips. The distance between its high and the previous close is 20 pips, and the distance between its low and the previous close is eight pips. True range is therefore 20 pips, the largest of those measurements.
The next step smooths successive true range readings. For a 14 period calculation, the initial ATR is the average of the first 14 true ranges. Subsequent values use Wilder’s ATR calculation:
Current ATR = [(Previous ATR × 13) + Current true range] ÷ 14
If the previous ATR was 14 pips and the latest true range is 20 pips, the updated ATR is approximately 14.43 pips. One larger candle lifts the average without replacing it entirely.
This smoothing also means ATR(14) is not simply a fresh average of only the latest 14 candles. Earlier observations retain a declining influence through the previous ATR value.
ATR Settings: Period, Timeframe and Smoothing
A setting of 14 refers to chart bars, not automatically to days or minutes. ATR(14) on a one minute chart processes one minute ranges. On a daily chart, it processes daily ranges. Those readings answer different questions and should not be treated as interchangeable.
Check the smoothing method too. TradingView’s ATR settings use a relative moving average, or RMA, by default, with other averaging methods available. Two charts labelled ATR(14) can therefore differ if their smoothing settings differ.
A shorter period gives each new observation more influence. A longer period reduces that influence, producing a steadier reading that responds more slowly to a sudden change. Neither setting is automatically better. The appropriate choice depends on the question being tested.
For repeatable research, record the instrument, chart interval, ATR period, smoothing method and data feed. Session settings matter because including overnight trading changes the candles used in the calculation.
Also distinguish a completed candle from a developing one. During a live candle, a new high or low can change its true range and the displayed ATR. If a paper rule requires a closed candle, record the value after that candle closes rather than using its later appearance on a historical chart.
How to Read High, Low and Rising ATR
ATR has no universal “high” reading. Eight pips might be elevated for one currency pair and chart interval, but ordinary for another. Compare a reading with that same market’s earlier readings under matching settings.
| ATR behaviour | What it indicates | What it does not establish |
|---|---|---|
| Rising ATR | Recent true ranges are lifting the smoothed average. | That price will continue in its current direction. |
| Low ATR relative to its history | Recent ranges have been comparatively small. | That a breakout is imminent. |
| High ATR relative to its history | Recent ranges have been comparatively large. | That price must reverse or that an entry is attractive. |
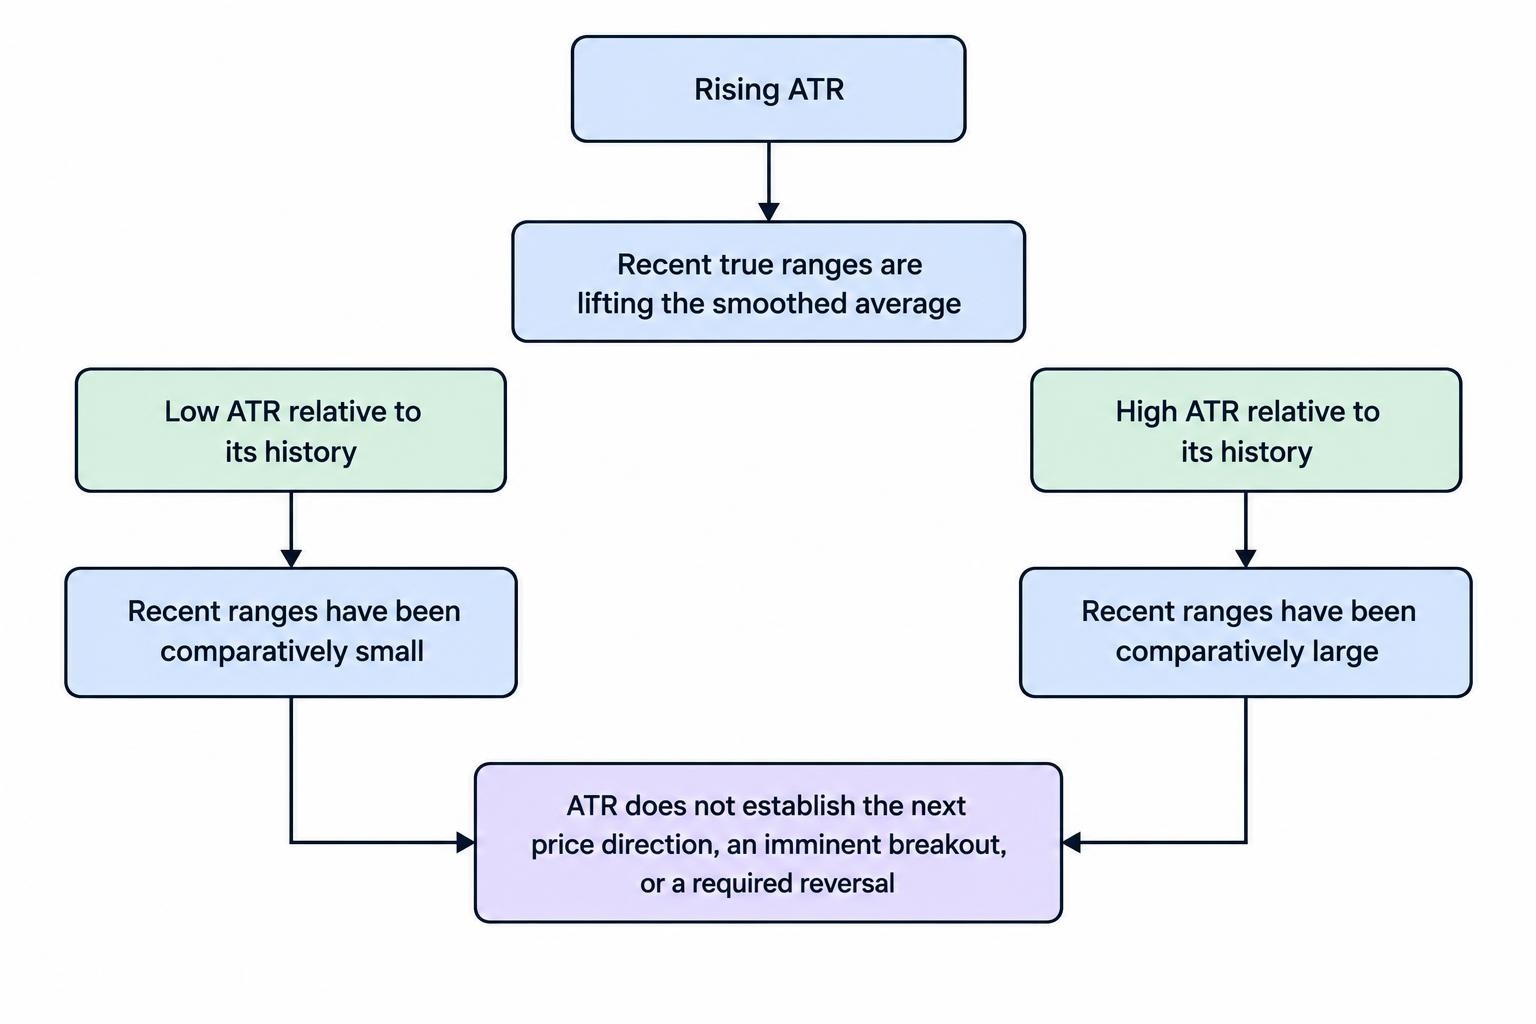
A market can fall sharply while ATR rises. It can also move sideways through large, overlapping candles and produce a high reading. ATR measures range, not the efficiency of a trend.
Keep directional analysis separate from volatility analysis. The broader technical analysis guide covers that distinction across chart tools. ATR’s job is to describe the movement surrounding a setup, not to supply the entire setup itself.
Raw ATR Versus ATR Percentage
Raw ATR uses the instrument’s price units. A reading of 25 on an index means 25 index points; a currency reading of 0.0008 may represent eight pips, depending on the pair. Comparing those raw numbers tells you little.
Percentage ATR adjusts the reading for the current price. The ATR percentage calculation is:
ATR percentage = ATR ÷ Closing price × 100
Consider two hypothetical shares. Share A trades at $20 with an ATR of $0.40, giving an ATR percentage of 2%. Share B trades at $200 with an ATR of $2, giving 1%. Share B has the larger dollar range, but Share A has the larger range relative to its price.
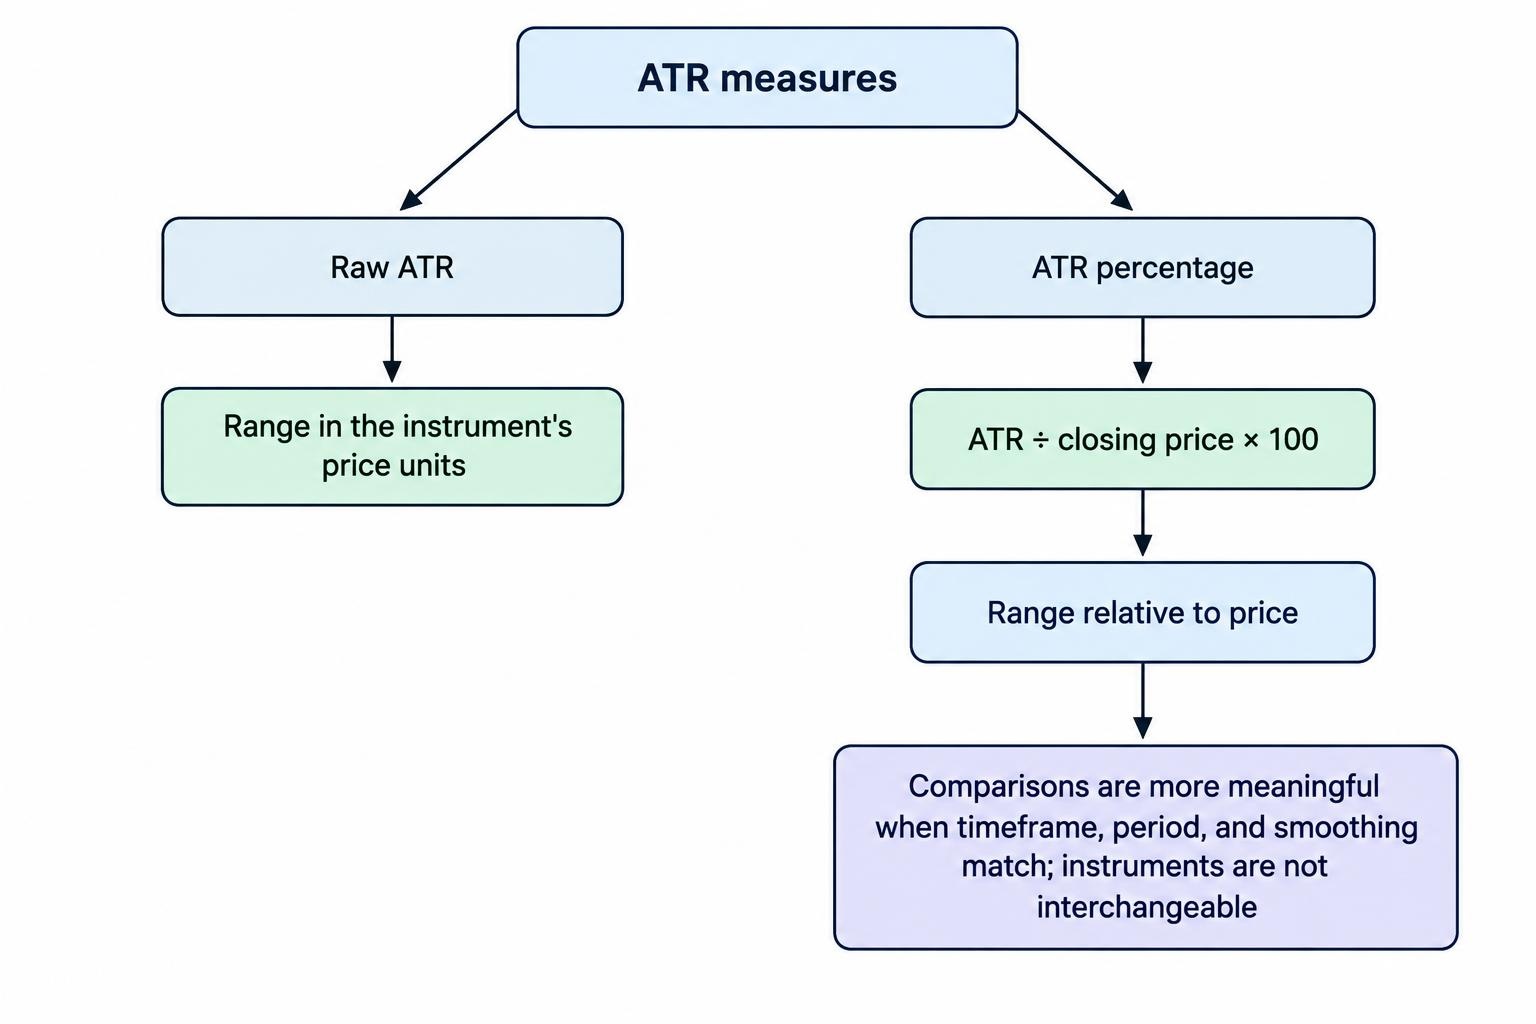
Percentage ATR makes this comparison more meaningful, provided the timeframe, period and smoothing match. It still does not make the two instruments interchangeable. Their price behaviour, trading sessions and contract terms may differ.
Why ATR Does Not Choose a Binary Option’s Expiry
ATR measures historical ranges over chart bars. A binary option’s expiry determines when its outcome is assessed. There is no automatic conversion between the two.
If ATR on a five minute chart is eight pips, that does not mean price will travel eight pips during the next five minutes. Nor does it imply an eight pip move from the current price in either direction. A candle’s high and low can form in either order, with its close almost anywhere between them.
Multiplying that ATR by three does not produce a reliable fifteen minute range forecast. Movement across consecutive bars can overlap or reverse. A range measure is not a clock.
The distinction matters when researching binary option expiry times. A directional idea can look reasonable on a chart and still fail at the selected settlement time. ATR cannot fix that timing mismatch by itself.
Use ATR to describe conditions at the proposed entry, then test the chosen expiry separately. Treat rules such as “use a longer expiry when ATR rises” as hypotheses, not established improvements.
Strike distance expressed in ATR units
Suppose AUD/USD trades at 0.6520, and its five minute ATR is 0.0008, or eight pips. A hypothetical contract pays if the settlement price is above 0.6526. The strike is six pips away, equal to 0.75 ATR.
That ratio gives a consistent description of distance:
Strike distance in ATR units = Absolute price distance ÷ ATR
It does not tell you the probability of finishing above the strike. ATR is not a standard deviation, and 0.75 ATR is not a probability score. The calculation also says nothing about whether price reaches the strike before expiry and then retreats.
Using ATR Around Support, Resistance and Breakouts
ATR can help frame a chart question without answering it prematurely. Suppose price moves two pips above a resistance level. That move is proportionally larger when ATR is three pips than when ATR is twelve pips.
A paper study might compare breaks measured in raw pips with breaks measured as a fraction of ATR. The purpose is to test whether a consistent measure of distance improves the rule, not to assume that any chosen multiple confirms a breakout.
The support and resistance guide addresses how chart levels are identified. Keep those level rules fixed when evaluating an ATR filter. Moving the level after seeing the result makes the comparison meaningless.
One research trap deserves attention: the breakout candle itself may push ATR higher. A rising ATR reading after that candle is partly a mathematical consequence of its larger range. It is not independent evidence that another large candle will follow.
Decide beforehand whether the rule uses ATR from before the breakout or after its close. Both can be studied, but they represent different entry conditions.
ATR Does Not Repair an Unfavourable Payout
Volatility and profitability are different questions. Even a well defined ATR filter must produce results that clear the contract’s payout hurdle.
Consider a hypothetical $20 stake with an 80% net profit payout on a win. A winning outcome earns $16; a losing outcome loses $20. Assuming no fees, refunds or ties, the break even win rate is:
Break even win rate = 1 ÷ (1 + 0.80) = approximately 55.56%
A busier chart does not prove that this threshold has been exceeded. Neither does a high win rate establish profitability unless the payout and losses are included. The guide to probability and expected value develops that calculation further.
For a fixed payout contract held to settlement, ATR does not reduce the stake lost on an unsuccessful outcome. Do not copy an ATR based stop distance from another instrument and assume it creates equivalent protection in a binary contract.
How to Test an ATR Filter Without Fooling Yourself
Begin with a complete paper rule that works without ATR. Define the entry condition, strike selection, expiry and settlement treatment. Then add one volatility condition and compare the results. Changing everything at once leaves no clear explanation for any difference.
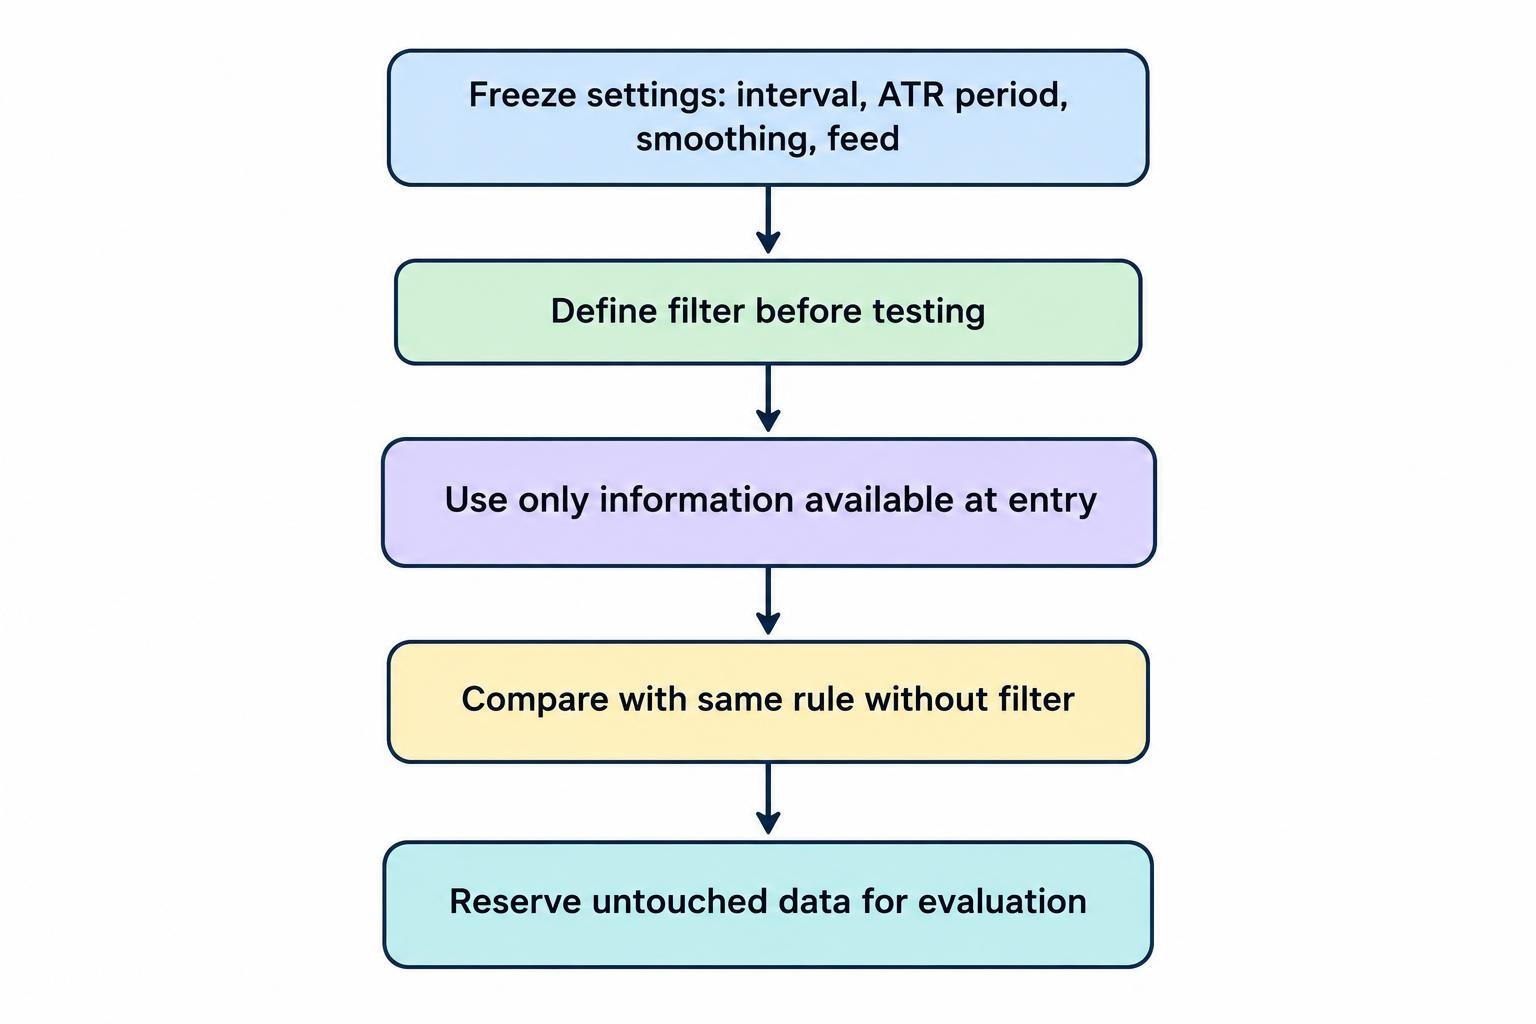
A compact test process is:
- Freeze the settings. Record the chart interval, ATR period, smoothing and data feed.
- Define the filter before testing. State exactly which ATR readings permit or reject a setup.
- Use information available at entry. Exclude later candle values from earlier decisions.
- Keep a baseline. Compare filtered results with the same rule without the filter.
- Reserve untouched data. Evaluate the finished rule on observations not used to choose its settings.
Record rejected setups as well as accepted ones. Otherwise, a filter that removes profitable opportunities can look helpful simply because those missing outcomes never enter the journal.
Track net results at the assumed payout, sample size and losing sequences, not just winning percentage. A filter that leaves only a handful of trades provides little basis for a confident claim.
The broader binary options backtesting guide covers test design. For ATR research, pay particular attention to incomplete candles and thresholds chosen after inspecting the results. A tidy historical chart can hide a very untidy decision process.
Where ATR Helps—and Where It Stops
ATR is useful for describing recent movement, comparing a price distance with recent ranges, and creating repeatable volatility categories for research. Its value comes from consistency, not from a supposedly perfect setting.
Its boundaries are just as clear. Historical ranges cannot anticipate an unexpected announcement. A low reading does not rule out a sudden jump, and a high reading does not require another large move. ATR also cannot verify a contract’s settlement feed or resolve differences between that feed and an analysis chart.
Read the number alongside its timeframe, settings and price context. Then ask a separate question: has the proposed rule shown a repeatable advantage after payouts and losses? ATR can help organise that investigation. It cannot supply the answer on its own.
This article was last updated on: October 22, 2026