News trading strategies use economic releases, central bank decisions and other announcements to study how prices respond to new information. In binary options, the task is narrower than predicting the market’s general direction: the settlement price must satisfy the contract’s condition at expiry. A correct reading of the news can still produce a losing contract.
For Australian readers, the regulatory position comes first. ASIC’s ban on issuing and distributing binary options to retail clients took effect on 3 May 2021 and extends until 1 October 2031. The ASIC announcement extending the binary options ban sets out that restriction. The approaches below are educational frameworks for historical analysis and paper trading, not a recommendation to open or fund an account.
What a news trading strategy actually tests
A useful strategy separates three questions: what was expected before the announcement, what changed when it arrived, and what price behaviour followed. The headline alone answers none of them completely. An interest rate increase could disappoint a market expecting a larger increase. Strong employment growth could arrive alongside weaker wages and downward revisions.
Historical interdealer foreign exchange data show rapid exchange rate responses to the unexpected part of economic releases. Trading activity can also increase when the headline matches expectations. These findings appear in Federal Reserve research on announcement effects in foreign exchange markets. They establish neither a profitable binary options strategy nor a reliable waiting period after a release.
The distinction matters. “Prices move around news” is an observation. “This entry rule wins often enough at this payout” is a hypothesis that needs testing. A large candle is not a permission slip.
Prepare an event plan before studying entries
Start with one event category and one underlying market. Combining inflation releases, employment reports and central bank speeches in a single test makes it harder to identify what the rules are measuring. An inflation surprise and an unexpected policy statement need not create the same price pattern.
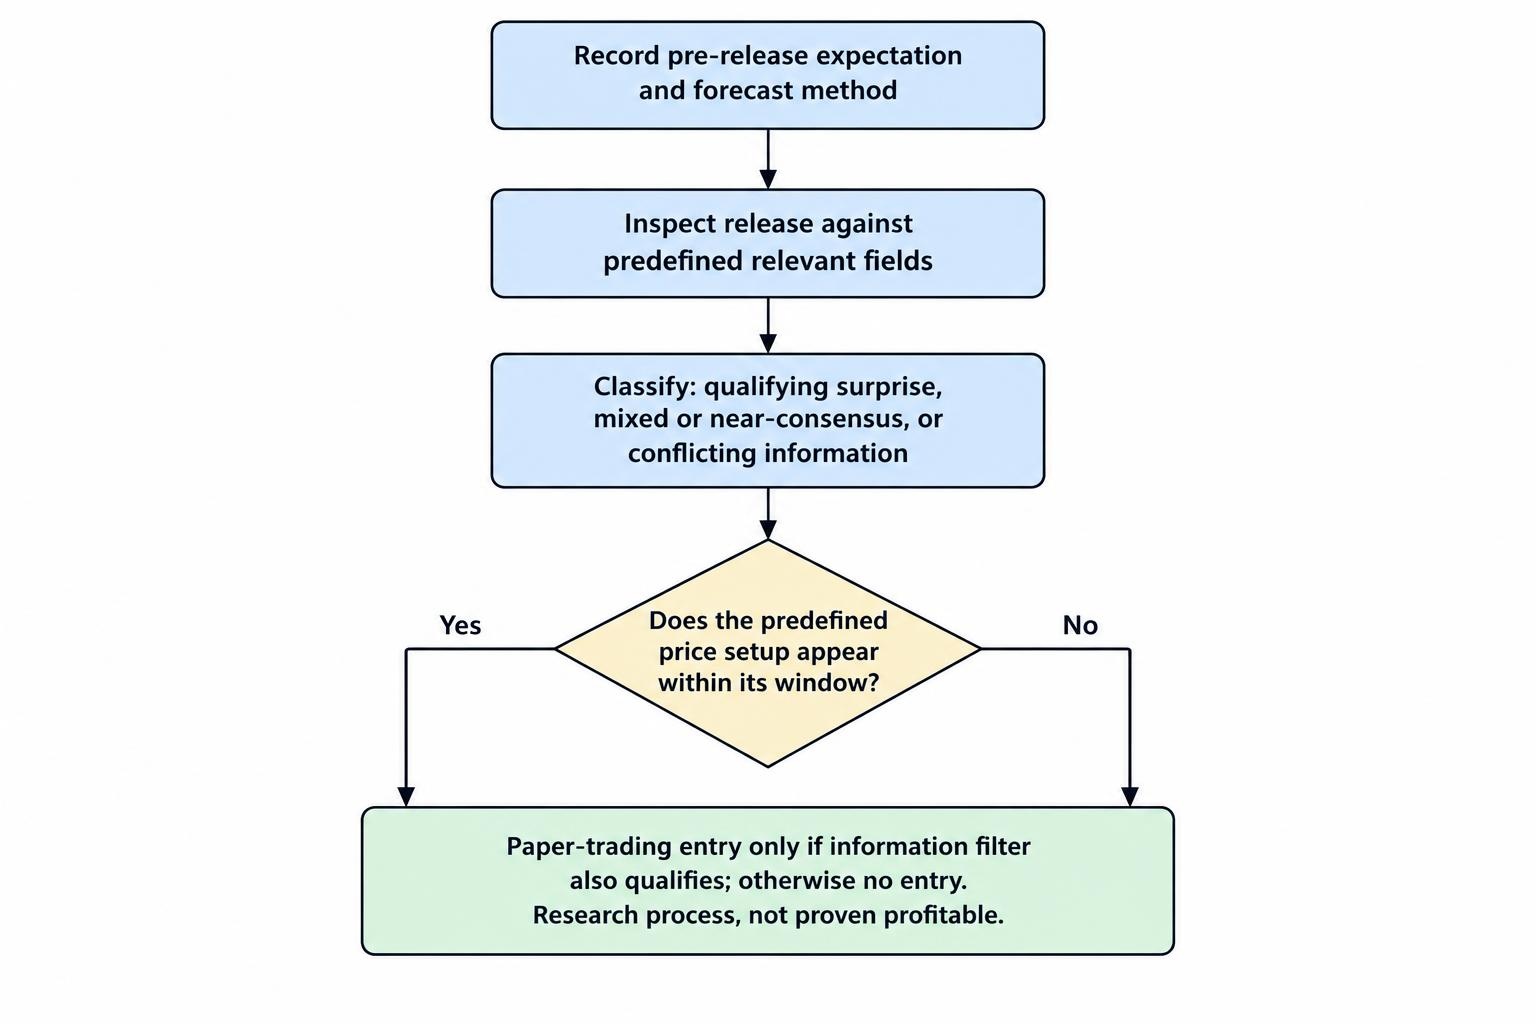
Use an economic calendar to organise the research, then verify the announcement with its issuing institution. Record the scheduled time, the forecast available beforehand, the previous reading, the chosen market and the exact observation window. Save the forecast before publication rather than reconstructing it afterwards.
The forecast also needs a definition. A survey median, the latest analyst forecast and expectations implied by market prices are different inputs. Pick one method and preserve it throughout the test. Otherwise, the meaning of “surprise” can change from event to event without appearing in the results.
Verify release times and time zones
The Bureau of Labor Statistics release schedule lists publication dates and states that its calendar times are Eastern Time. Check the relevant entry rather than assuming every employment or inflation report follows an unchanging monthly pattern.
For an Australian research log, store the event timestamp in UTC and display the local equivalent separately. Check the conversion for each event date. A saved screenshot showing “8:30” is poor evidence if nobody recorded which time zone it used.
Check the surrounding schedule too. A proposed ten minute observation window should identify any other announcement inside those ten minutes. If another release arrives halfway through, the result no longer isolates the original event cleanly.
Write scenarios, not a single prediction
Prepare three possible outcomes: a clear surprise in one direction, a clear surprise in the other, and a mixed or near-consensus result. Define what would qualify for each category. The mixed category should allow no simulated entry; it should not become a drawer for inconvenient results.
For a hypothetical employment test, a stronger headline might qualify only when wage data and revisions do not contradict it. This is a proposed filter, not an established advantage. Its value comes from applying it consistently and checking the results, including every event it excludes.
Read the release beyond its headline
Employment reports illustrate why the first number is not the whole event. BLS initially revises its monthly establishment survey estimates twice, in the following two months, to include further responses. Annual benchmarking can produce further changes. The BLS explanation of payroll estimates and revisions describes that process.
Suppose a fictional release reports 210,000 new jobs against a forecast of 170,000, but revises the previous two months down by a combined 90,000. The headline beats expectations. The complete release presents a less straightforward picture. A rule based only on the new headline would ignore information published alongside it.
Apply the same discipline to other announcements. For an inflation study, specify whether the rule uses the headline measure, an underlying measure, monthly changes or annual changes. For a central bank study, distinguish the current decision from statements about future policy.
This does not mean reading every table before making an observation. It means choosing the relevant fields beforehand. Adding a new explanatory detail only after a simulated loss turns analysis into storytelling.
Strategy one: post-release continuation
A continuation framework tests whether an initial move persists after a defined confirmation period. It does not try to forecast the announcement or capture its opening jump. The candidate entry comes after the release, once both the information and the price condition are available.
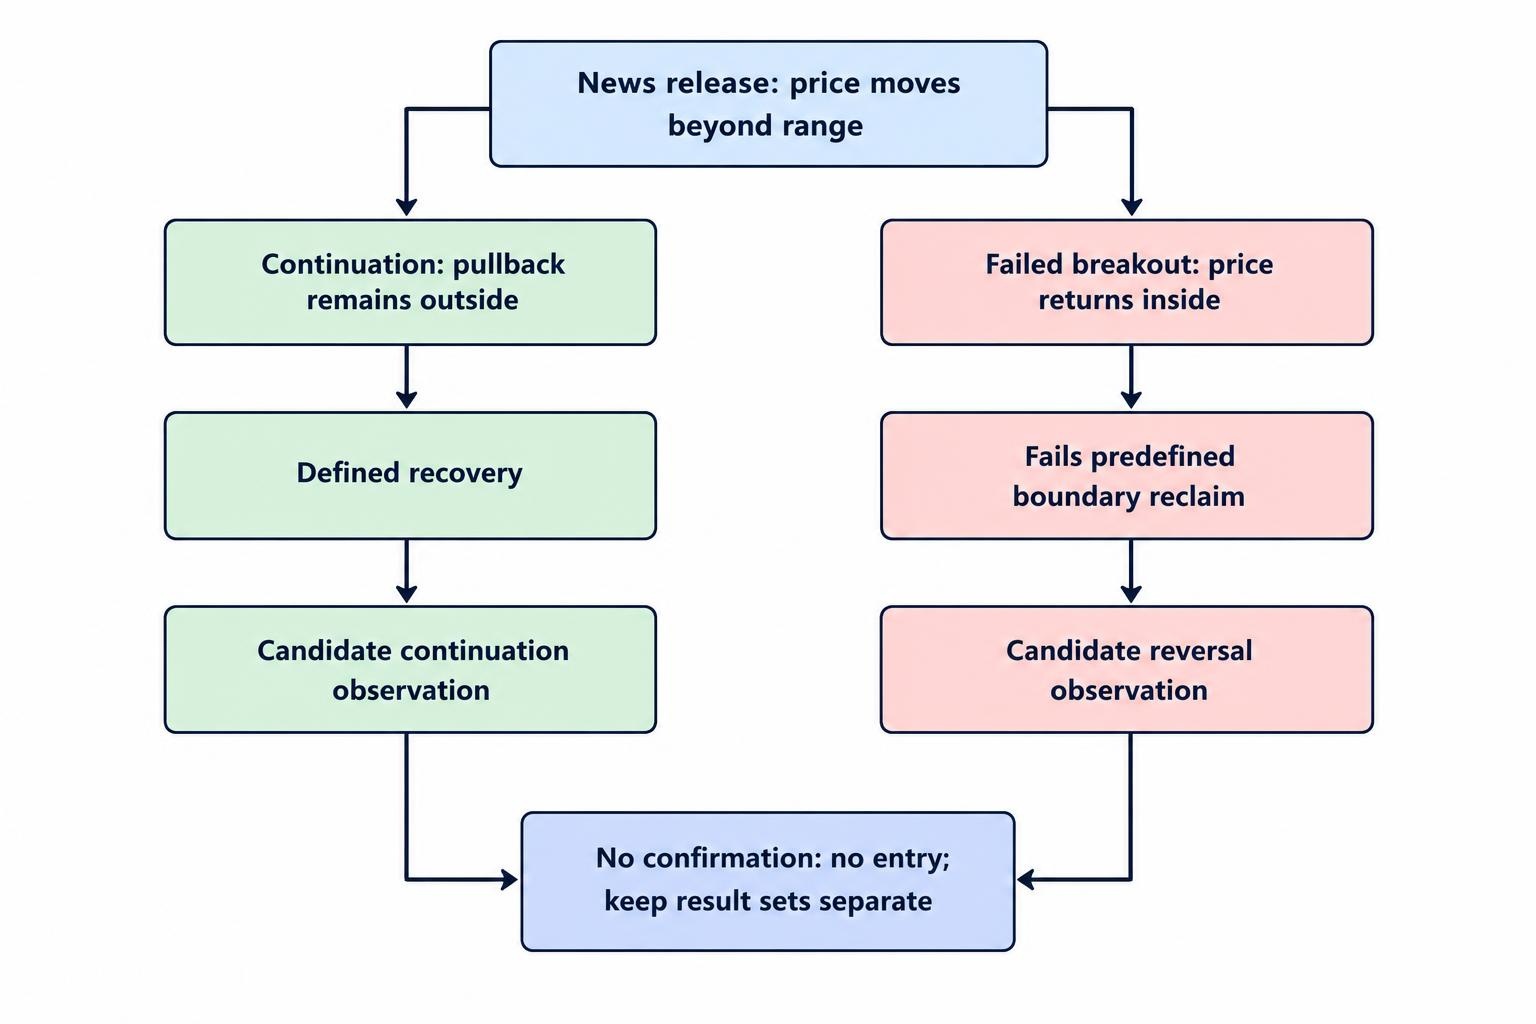
A paper test could require a qualifying surprise, a candle close beyond the range immediately before publication, and a pullback that remains outside that range. The entry would follow a defined recovery from the pullback. These conditions must be measurable: “price looks strong” is not a rule.
Specify the candle interval, how the earlier range is measured and how much time the pullback may take. A five minute range and a thirty minute range describe different setups. The broader mechanics belong in the guide to breakout trading strategies; the news test adds event timing and release interpretation.
The hypothesis fails when the move does not persist through the chosen expiry. It can also become impractical if confirmation arrives so late that the available strike has already moved substantially. Waiting removes some uncertainty, but it changes the price being tested.
Include an expiry for the setup itself. If confirmation has not appeared within the predefined window, record no entry. Otherwise, an event strategy can drift into ordinary trading long after the announcement has stopped being a useful explanation.
Strategy two: a failed news breakout
A failed breakout framework tests a different sequence: price moves beyond an earlier range, returns inside it, then fails to reclaim the broken boundary. The proposed reversal entry follows that failure, not the original spike.
For a hypothetical upward breakout, the test might require a close back below the earlier range high and a later unsuccessful attempt to move above it. Define how many attempts are allowed and what constitutes failure. A brief touch and a completed candle close are different observations.
The weakness is straightforward: the apparent failure can itself fail. Price may pause inside the range before resuming its original direction. Selling every upward spike, or buying every downward spike, is not the same strategy as waiting for a documented rejection.
Keep continuation and reversal results separate. Switching between them after watching several candles makes the combined record difficult to interpret. If the plan permits either setup, define which takes priority and prohibit hindsight from choosing the winner.
Strategy three: separate the decision from later communication
Some announcements unfold in stages. The RBA schedules its monetary policy decision for 2.30 pm and the Governor’s media conference for 3.30 pm, using AEST or AEDT as applicable. The RBA’s media conference arrangements confirm that separation.
A paper study can therefore distinguish a decision-window strategy from a media-conference strategy. An observation starting after the decision but extending into the conference includes another source of information. It should not be labelled a clean test of the decision alone.
For the later window, define what information can trigger the setup. A published statement is easier to timestamp than an interpretation of a spoken answer. If the rule relies on remarks during questions, preserve the relevant timestamp and the wording available at that moment.
This approach is harder to standardise than a numerical surprise. “The tone sounded tougher” leaves too much room for hindsight. Start with a narrow, reproducible classification and allow uncertain cases to remain unclassified rather than forcing every conference into a directional signal.
Match the entry, strike and expiry
News analysis concerns the market; settlement concerns the contract. For a high-low contract, the accepted strike and the settlement condition decide the result. The price before the announcement is context, not necessarily the price against which the position settles.
Record the requested entry time, accepted entry time, accepted strike, expiry timestamp and settlement price. The distinction between requesting and receiving an entry is particularly relevant when testing fast moves. The guide to binary options execution and latency covers why those timestamps should not be treated as interchangeable.
Do not assume a chart candle captures every price needed for settlement. A candle can show its high and low without revealing the order of movements inside it. If the historical data cannot establish the accepted strike or settlement value, mark the result uncertain rather than awarding a simulated win.
Expiry needs a precise definition too. “Five minutes” could mean five minutes after acceptance or a fixed clock time with less than five minutes remaining. Neither a shorter nor a longer expiry is automatically preferable. Each changes the question the strategy is testing.
Worked example: the direction is right, the contract loses
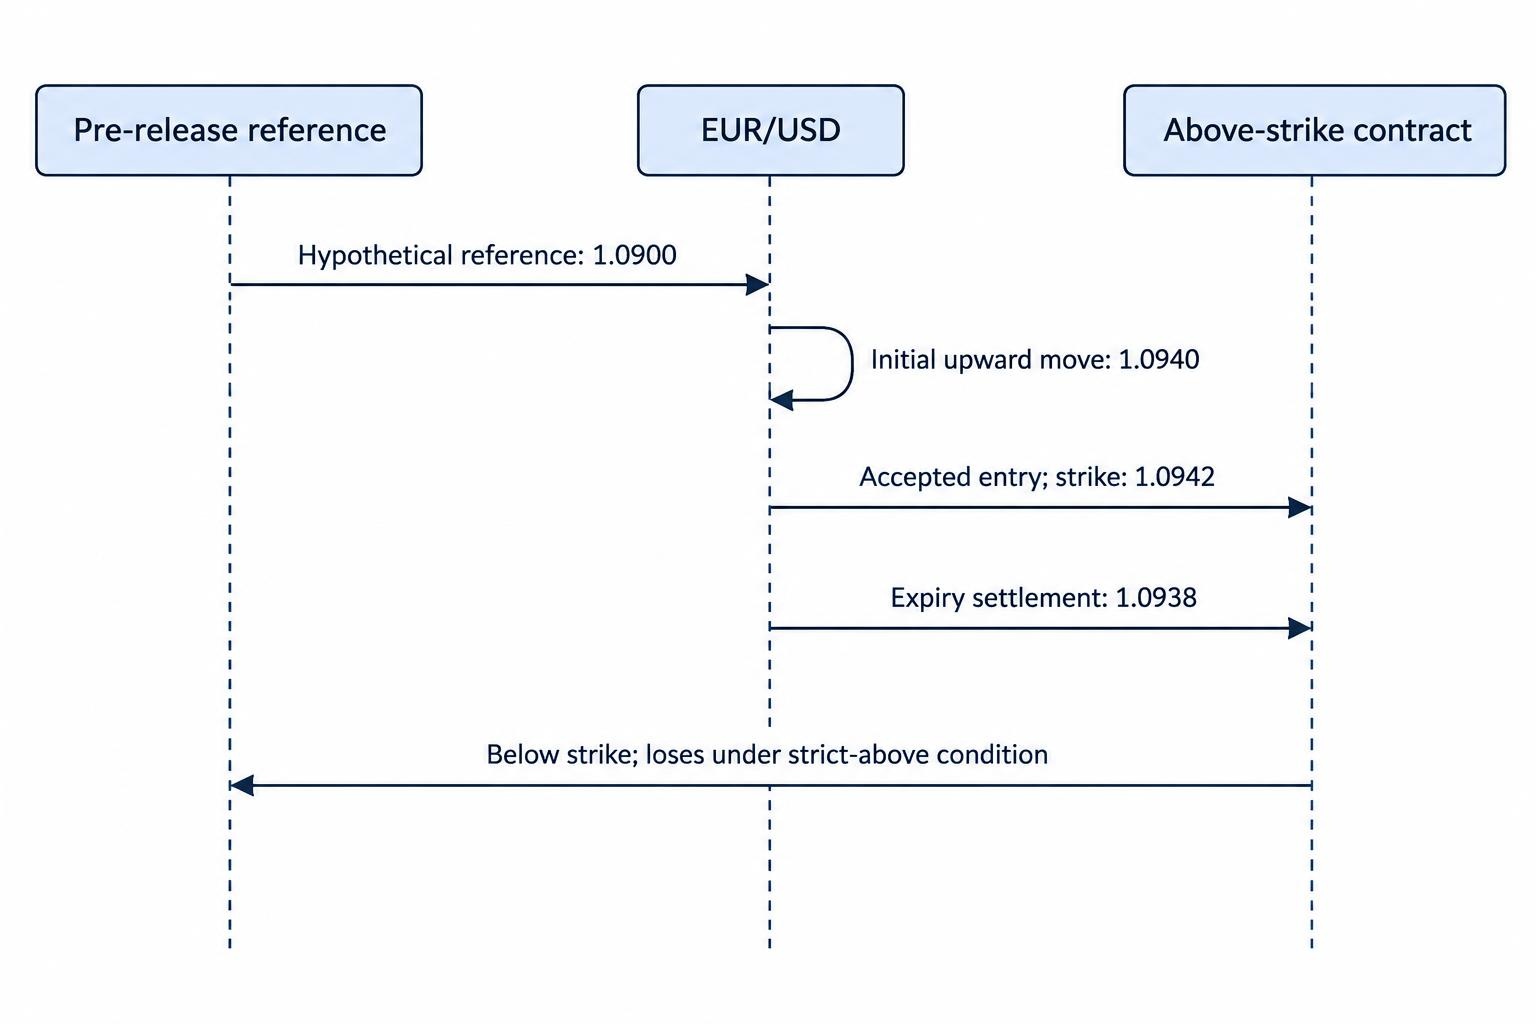
The following prices are hypothetical. Assume an above-strike contract that requires EUR/USD to settle strictly above the accepted strike. Fees are excluded.
| Observation | EUR/USD price | Meaning |
|---|---|---|
| Immediately before the release | 1.0900 | Starting market reference |
| Initial upward move | 1.0940 | Price rises after publication |
| Accepted entry after confirmation | 1.0942 | Contract strike |
| Settlement at expiry | 1.0938 | Below the accepted strike |
EUR/USD finishes well above its level before the release, yet the contract loses because settlement is below 1.0942. The market interpretation and the contract outcome disagree without either calculation being wrong.
This is why measuring the move from the announcement price is not enough. A strategy must measure what happened after its own realistic entry. Research that awards the entire opening jump to a later entry overstates what that entry could have captured.
Check the payout before judging the win rate
Consider a fixed-payout contract with an 80% net profit on a win and a full stake loss on a loss. A $100 winning stake produces $80 profit, with the original $100 returned. A losing stake loses $100.
Ignoring fees and ties, the break-even win rate is 100 ÷ 180, or approximately 55.56%. At a 55% win rate, expected profit per $100 stake is:
(0.55 × $80) − (0.45 × $100) = −$1.
A rule that predicts direction more often than not can therefore still lose money. The full relationship is covered in probability and expected value in binary options. For news research, store the payout alongside each observation rather than applying one favourable payout to the entire history.
Buying both directions is not a free volatility strategy either. With two $100 contracts sharing the same strike and expiry, one win at 80% and one full loss produce a combined $20 loss, assuming no tie. Different strikes or contract terms require their own calculation; the headline promise of “covering both sides” proves nothing.
Backtest news strategies without borrowing future information
Build a chronological event record, not a collection of memorable chart screenshots. It should preserve the original release, the forecast saved beforehand, the classification, the eligible entry and the settlement outcome. Include skipped events and uncertain observations.
Use separate development and evaluation periods. Develop the rules on one set of announcements, then freeze them before examining later events. The guide to backtesting binary options strategies covers the wider testing process; event research also needs careful control over which release version was available at the time.
A later revised economic figure must not replace the number originally published when reconstructing a historical decision. Likewise, a forecast downloaded months later may not represent the forecast visible just before publication. Keep the original snapshots whenever possible.
Separate event counts from contract counts. Twenty simulated entries around one announcement are not twenty independent tests of how the strategy handles different announcements. Report how many distinct releases contributed to the results and whether one unusually strong event supplied most of the profit.
Test reasonable changes without shopping for the best answer. If moving the entry by a few seconds or shifting expiry slightly turns a strong result into a poor one, investigate that sensitivity. The purpose is to find out whether the apparent advantage survives plausible conditions, not to polish a chart until it looks convincing.
When the correct decision is no entry
A complete news strategy needs exclusion rules. A release that is hard to classify, an uncertain timestamp, another announcement inside the observation window or missing settlement data can each justify no simulated position. These are research boundaries, not missed opportunities that need explaining away.
Use a short decision sequence:
- Was the event and its publication time verified?
- Did the release meet the predefined information filter?
- Did the price setup appear before its entry deadline?
- Were the strike, expiry and payout measurable?
- Was the outcome recoverable from adequate data?
If an answer is no, preserve that result in the log. Do not increase the next simulated stake to recover a loss or add extra entries because the first move was missed. That changes the strategy being evaluated.
The strongest news trading research is not the version with the most activity. It is the version with a clear event definition, repeatable rules, realistic contract prices and an honest allowance for uncertainty. Until those conditions are met, a dramatic response to a headline remains a market movement, not evidence of a tradable advantage.
This article was last updated on: October 22, 2026