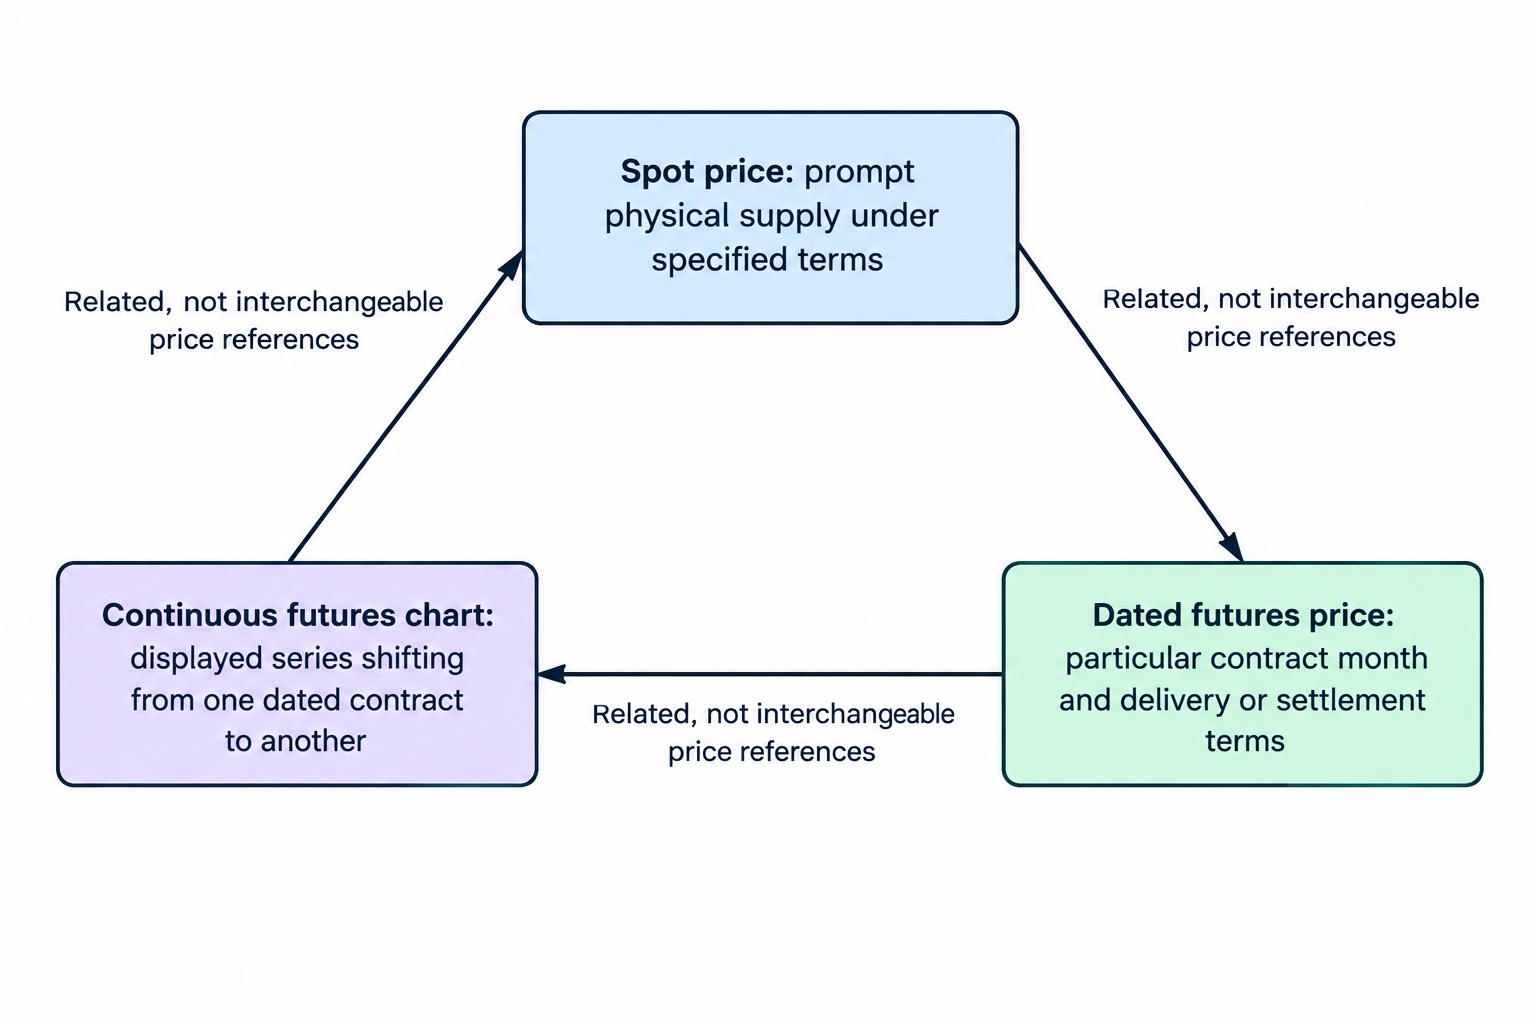
A commodity can have several valid prices at the same time. Spot oil, next month’s oil futures and a continuous oil chart do not necessarily show the same number. The difference matters when analysing price movements, comparing platforms or checking the reference price behind a binary option.
The distinction is straightforward: spot prices concern near term physical supply, futures prices concern delivery or settlement under a dated contract, and rollovers move exposure or a chart’s reference from one futures contract to another. Confusing them can turn a routine contract change into what looks like a sudden market rally.
Australian retail restriction: ASIC’s prohibition on issuing and distributing binary options to retail clients runs until 1 October 2031. The following discussion explains commodity pricing and contract mechanics, not a route around the ASIC binary options product intervention order.
What Is a Commodity Spot Price?
A spot price represents a commodity available for prompt delivery under the terms of its physical market. “Prompt” does not necessarily mean immediate delivery. The relevant delivery period, location, quality and payment arrangements depend on the commodity and transaction.
There is no single price for every barrel of oil or every unit of natural gas. Location and quality matter. Two prices can differ because they describe different physical supplies, rather than because one quotation is wrong.
The EIA’s daily petroleum spot price tables, for example, distinguish WTI at Cushing, Oklahoma, from Brent in Europe. They also separate petroleum products by delivery area. These are published price series, not a promise that a trader can execute at the displayed figure in real time.
For a price comparison, write down the full description rather than just “oil.” Include the benchmark, currency, unit and timestamp. A dollar price per barrel cannot be compared directly with a cents per gallon quotation, even if both appear beneath an energy heading.
How Commodity Futures Prices Differ From Spot Prices
A commodity futures contract has standardised terms and a dated delivery or settlement period. Its quoted price belongs to that contract, not to the commodity in every form and at every location.
Several contract months can trade simultaneously. June oil futures and July oil futures are separate instruments, with separate prices. A change in the June contract does not have to match the change in July.
The front month generally means the nearest contract month still trading. The most actively traded contract may already be a later month as participants move their exposure. Do not assume “nearest” and “most liquid” always describe the same instrument.
Futures also have an end date. Positions can be closed, rolled into a later contract or taken through the applicable settlement process. Physical delivery and cash settlement are different arrangements; the contract terms decide which applies. The mechanics are covered in CME Group’s futures expiration and contract roll lesson.
For analysis, the practical question is therefore more precise than “What is the oil price?” It is “Which oil contract, for which month, at what time?”
Why Spot and Futures Prices Can Be Different
Holding physical commodities can involve financing, storage and insurance costs. Having material available now can also provide a commercial benefit, such as keeping a factory operating. These factors help explain why a futures price can sit above or below the corresponding spot price.
Contango describes futures priced above spot; the term is also commonly used for an upward sloping sequence of futures months. Backwardation describes the opposite relationship. These are comparisons between prices for different dates, not descriptions of a chart rising or falling through time. CME Group’s explanation of contango, backwardation and convergence sets out these relationships.
Consider hypothetical prices of US$75 for spot oil, US$76 for next month and US$77 for the following month. The curve slopes upwards. That does not mean the next price tick must be higher, or that spot oil will reach US$77 on schedule.
All three prices could fall tomorrow while retaining the same upward sloping relationship. Equally, prices could rise across a downward sloping curve. Curve shape and market direction answer different questions.
As delivery approaches, a physically delivered futures contract should converge with the corresponding deliverable spot market. That does not require convergence with every price carrying the same commodity name. Matching delivery terms still matters.
Seasonal Demand Can Change the Shape of the Curve
A futures curve does not have to form a tidy upward or downward line. Demand can differ between delivery seasons, creating rises and dips across the contract months.
US gasoline provides an example: stronger summer consumption can support higher prices for summer delivery and encourage inventory building beforehand. The relationship between seasonal consumption, inventories and futures spreads appears in the EIA’s analysis of petroleum inventories and price relationships.
The analytical lesson is to compare the relevant months. A premium for one delivery season is not automatically a short term directional signal. The market may already be pricing the expected demand.
What Happens During a Commodity Futures Rollover?
A futures rollover replaces exposure to one dated contract with exposure to a later contract. For a long position, that means selling the existing contract and buying the replacement. A short position uses the opposite transactions.
A chart rollover is related but different: the data service changes which contract supplies its displayed price. The chart can switch before the older contract stops trading. Moving the chart’s reference does not mean the older contract has vanished.
The following hypothetical example separates a reference change from an actual market move. All prices are in US dollars per barrel.
| Observation | June futures | July futures | Continuous chart display |
|---|---|---|---|
| Immediately before the switch | 75.00 | 76.20 | 75.00, using June |
| Immediately after the switch | 75.00 | 76.20 | 76.20, using July |
| Later observation | 75.18 | 76.40 | 76.40, using July |
At the switch, neither individual contract changes price. The continuous display nevertheless jumps by US$1.20 because it starts showing July instead of June. Treating that jump as a buying surge would confuse a data construction event with trading activity.
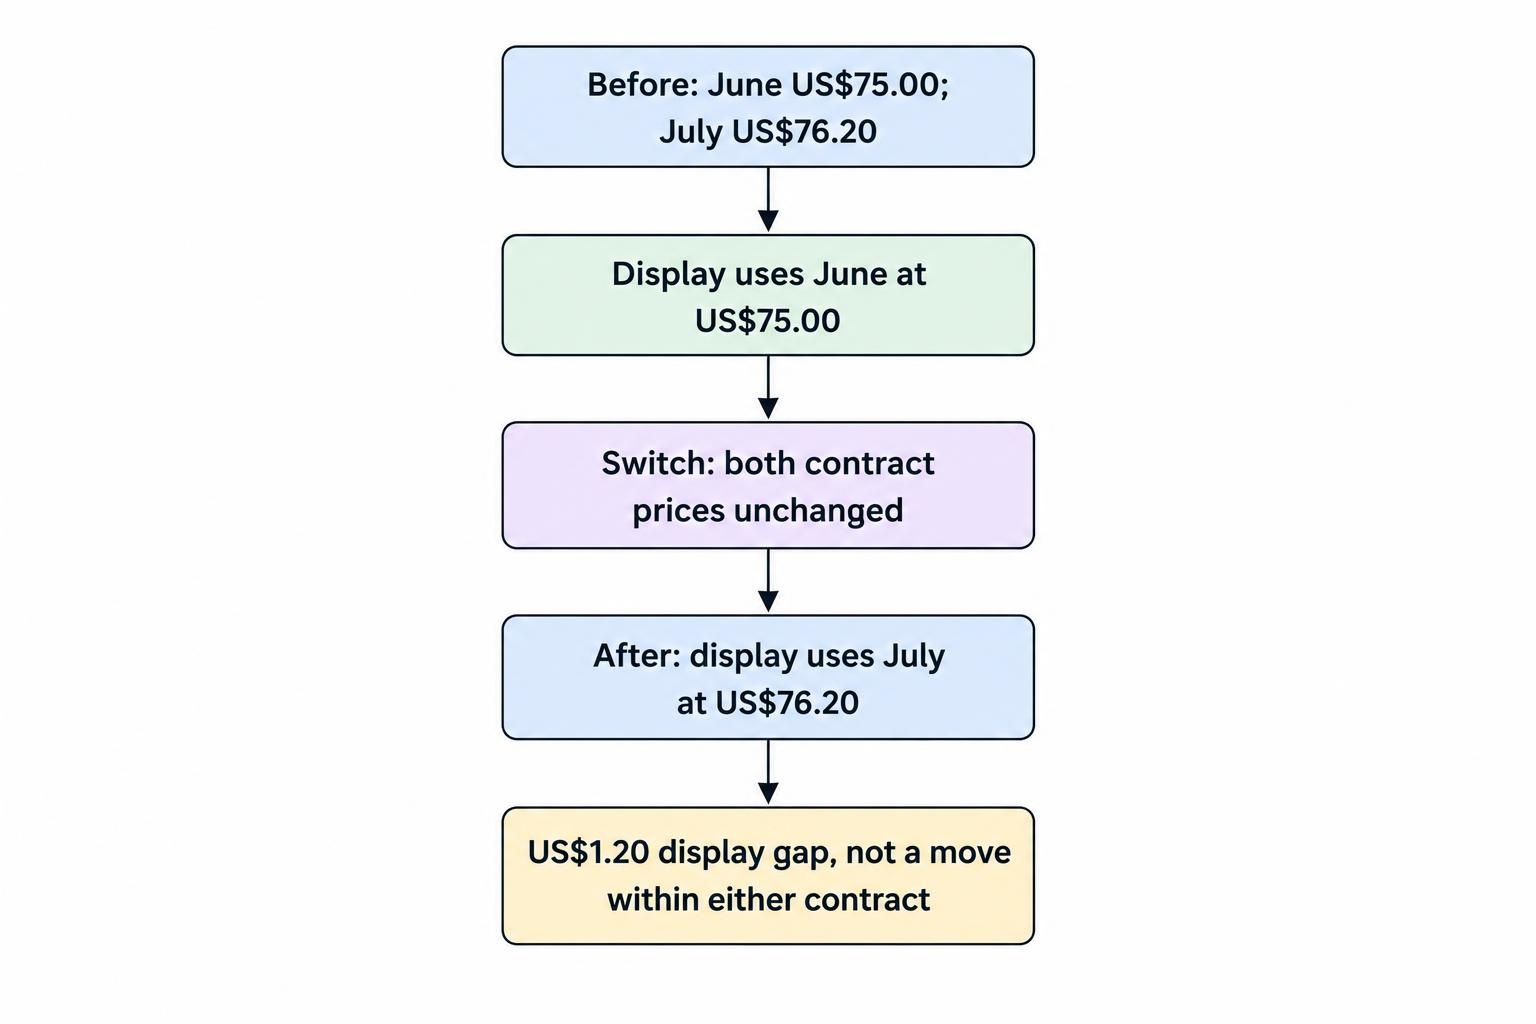
The later move from US$76.20 to US$76.40 is different: it is a price change within the same July contract.
Is the Roll Gap a Fee?
Not by itself. The US$1.20 difference is a spread between two contracts. It should not automatically be recorded as a separate commission or an instant loss caused by pressing a rollover button.
Transaction charges and execution spreads are separate. Futures also use margin rather than requiring payment of the full quoted commodity value as though physical barrels were being purchased.
There can still be an adverse result from holding the replacement contract. If a long position opens at US$76.20 and that contract later falls to US$75.00, it loses US$1.20 per barrel before costs. That loss comes from the replacement contract’s subsequent price movement. The distinction prevents both double counting and the mistaken belief that rolling is economically irrelevant.
Continuous Futures Charts and Back Adjustment
A continuous futures chart joins successive dated contracts into a longer series. It is useful for viewing history without manually opening a new contract each time the reference changes. It is not one unchanging futures contract.
An unadjusted series can retain the gaps between contract prices. A back adjusted series changes earlier observations to reduce or remove those gaps. The chart provider’s method determines how that adjustment works.
TradingView’s documentation on continuous futures back adjustment describes adjusting earlier contracts using the price difference around the switching point. This changes the historical series displayed on the chart, rather than changing the transactions that originally occurred.
That distinction matters when drawing price levels. An old horizontal level on an adjusted chart may not equal the historical executable price in the original dated contract. A smooth chart is easier to inspect, but smoothness is not evidence that every displayed historical price was tradable.
For a historical review, save the contract identifier and adjustment setting alongside the chart. Otherwise, an apparent change in a previous high or low may come from the chart’s construction rather than a correction to market trading data.
Match the Analysis Chart to the Contract’s Reference Price
A commodity label is not enough to establish that two prices are comparable. A chart marked “Gold” might represent a spot quotation, a dated futures contract or a continuous futures series. A product’s settlement terms may reference something else.
The first task is to identify the instrument. Only then compare timestamps, quote types and update frequency. A daily published assessment and a live market quotation should not be expected to match tick for tick.
The guide to price feeds and benchmarks covers the broader distinction between reference data and displayed platform prices. For commodity rollovers, the extra detail is the contract month and the rule for changing it.
Return to the hypothetical oil example. Suppose an external continuous chart has switched to July at US$76.20, while a product still references June at US$75.00. Both displays could be internally consistent. Comparing their headline prices without checking the month creates a false discrepancy.
A stronger comparison uses the same benchmark, dated contract, unit, currency and observation time. Even then, check whether one display shows a last trade and the other uses a different settlement observation.
Binary Option Expiry Is Not Futures Expiry
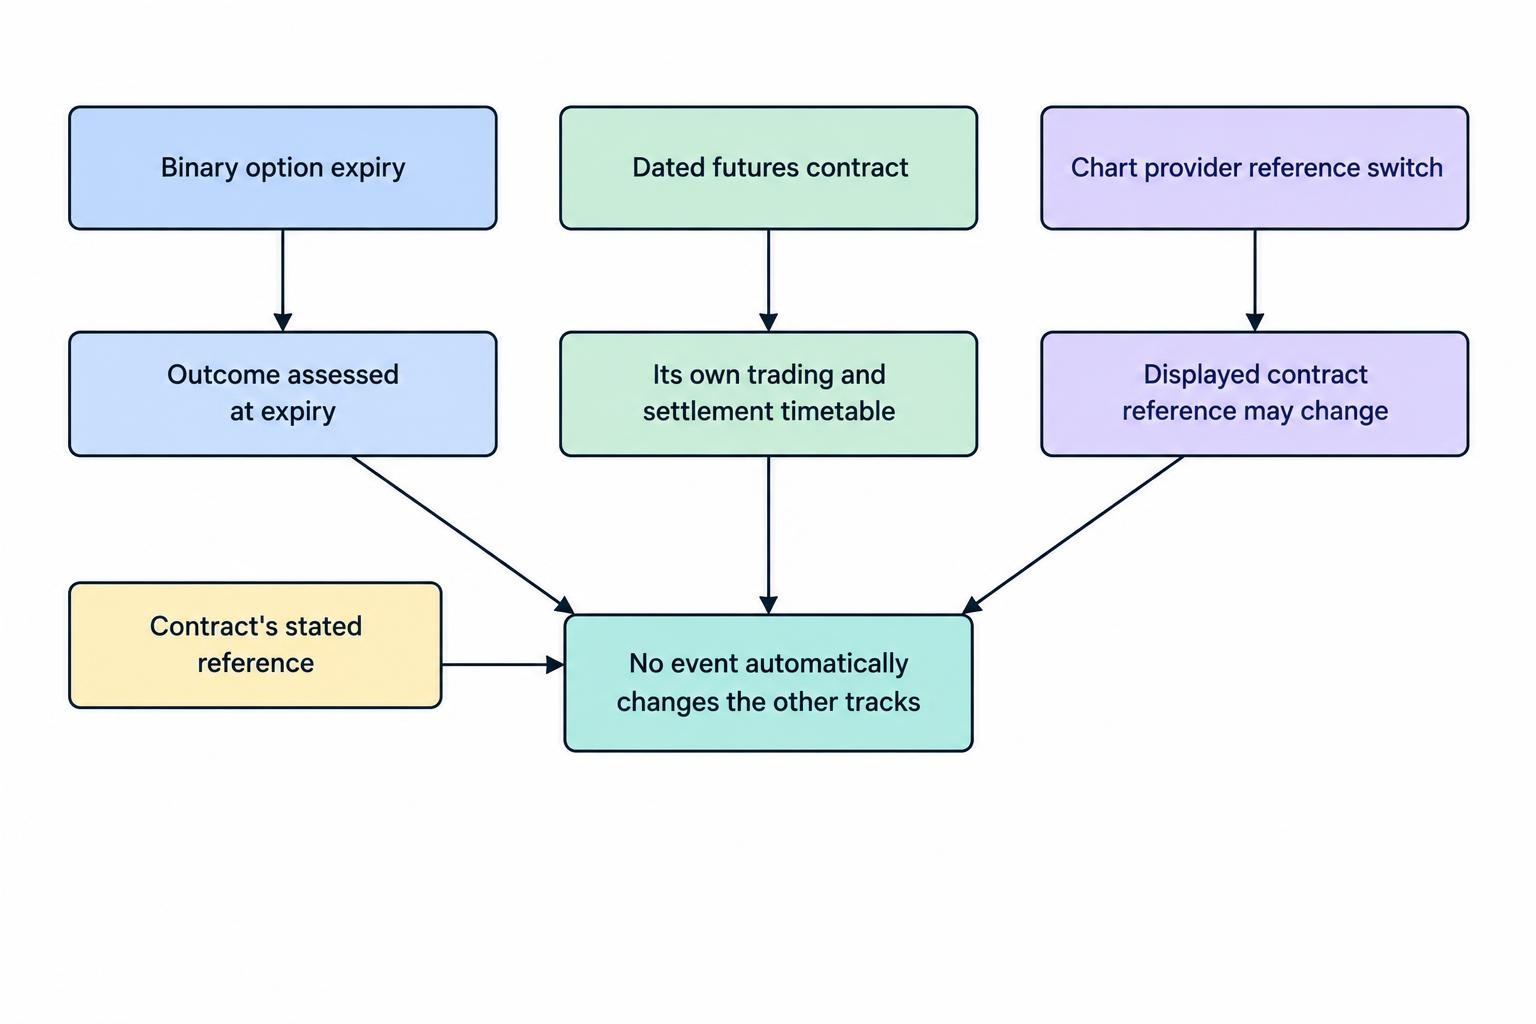
A binary option’s expiry determines when its outcome is assessed. The referenced futures contract has its own trading and settlement timetable. These are separate clocks.
A short duration binary option referencing June futures can expire while June futures continue trading. Its expiry does not roll the underlying futures contract, and a chart provider’s switch to July does not automatically amend the binary option.
Consider a hypothetical higher or lower contract with a strike of US$75.10, expressly settled against June futures. At observation time, June is US$75.04 and July is US$76.24. A July chart is above the strike, but it does not establish a winning result for a contract that references June.
The binary options settlement and ties guide addresses outcome rules. For a commodity contract, those rules must also identify the correct underlying reference. A forecast can be directionally reasonable yet concern the wrong instrument.
Do not assume that an underlying rollover automatically adjusts the strike, preserves the original reference or forces early settlement. Those are possible contractual treatments to investigate, not universal rules.
What to Check Around a Commodity Rollover
Use the contract documentation and chart settings to answer a short set of questions. If the answers are missing, the uncertainty belongs in the analysis rather than being filled with assumptions.
- Reference: Is the price spot, a dated future, a continuous series or a calculated quotation?
- Month: Which futures contract supplies the price now, and which supplies it after the switch?
- Timing: When does the reference change, in which time zone, and is the older contract still trading?
- Chart treatment: Are earlier prices adjusted to remove the gap?
- Open contract treatment: What happens to existing positions, strikes and settlement observations?
Keep a record of the relevant terms, contract identifiers and timestamps when reviewing an outcome. A screenshot showing only the commodity name and a large price number leaves too much unanswered.
For broader market characteristics, the commodity binary options overview places these pricing issues alongside the individual commodity markets. The rule here is narrower: establish what the price represents before interpreting its movement. A rollover gap is a change of reference, not automatically a change in the commodity’s value.
This article was last updated on: October 22, 2026