MACD, short for Moving Average Convergence Divergence, measures the gap between a faster moving average and a slower one. Traders use it to assess momentum, identify changes in trend conditions and compare price movements with the strength behind them.
For binary options analysis, the distinction between direction and timing matters. A bullish MACD signal does not tell you whether a price will finish above a contract’s strike at expiry. This guide covers the calculation, signals, settings and a paper trading framework without treating an indicator crossover as a promise.
Australian retail restriction: ASIC’s ban on issuing and distributing binary options to retail clients took effect on 3 May 2021 and extends until 1 October 2031. The examples below are educational simulations, not instructions to open an account or bypass the ASIC binary options product intervention order.
How MACD Is Calculated
The familiar MACD configuration uses settings of 12, 26 and 9. These numbers refer to calculation periods, not a forecast horizon. In the conventional EMA version, the main line subtracts the 26 period exponential moving average from the 12 period EMA. A nine period EMA of that result creates the signal line.
| Component | Calculation | What it measures |
|---|---|---|
| MACD line | 12 period EMA − 26 period EMA | The gap between faster and slower average prices |
| Signal line | 9 period EMA of the MACD line | A smoothed version of MACD |
| Histogram | MACD line − signal line | The distance between those two lines |
The histogram in this table is the difference between MACD and its signal line. Charting software can offer alternative average types, so check the inputs rather than relying on the indicator’s name. TradingView’s MACD calculation documentation identifies these components and its available calculation settings.
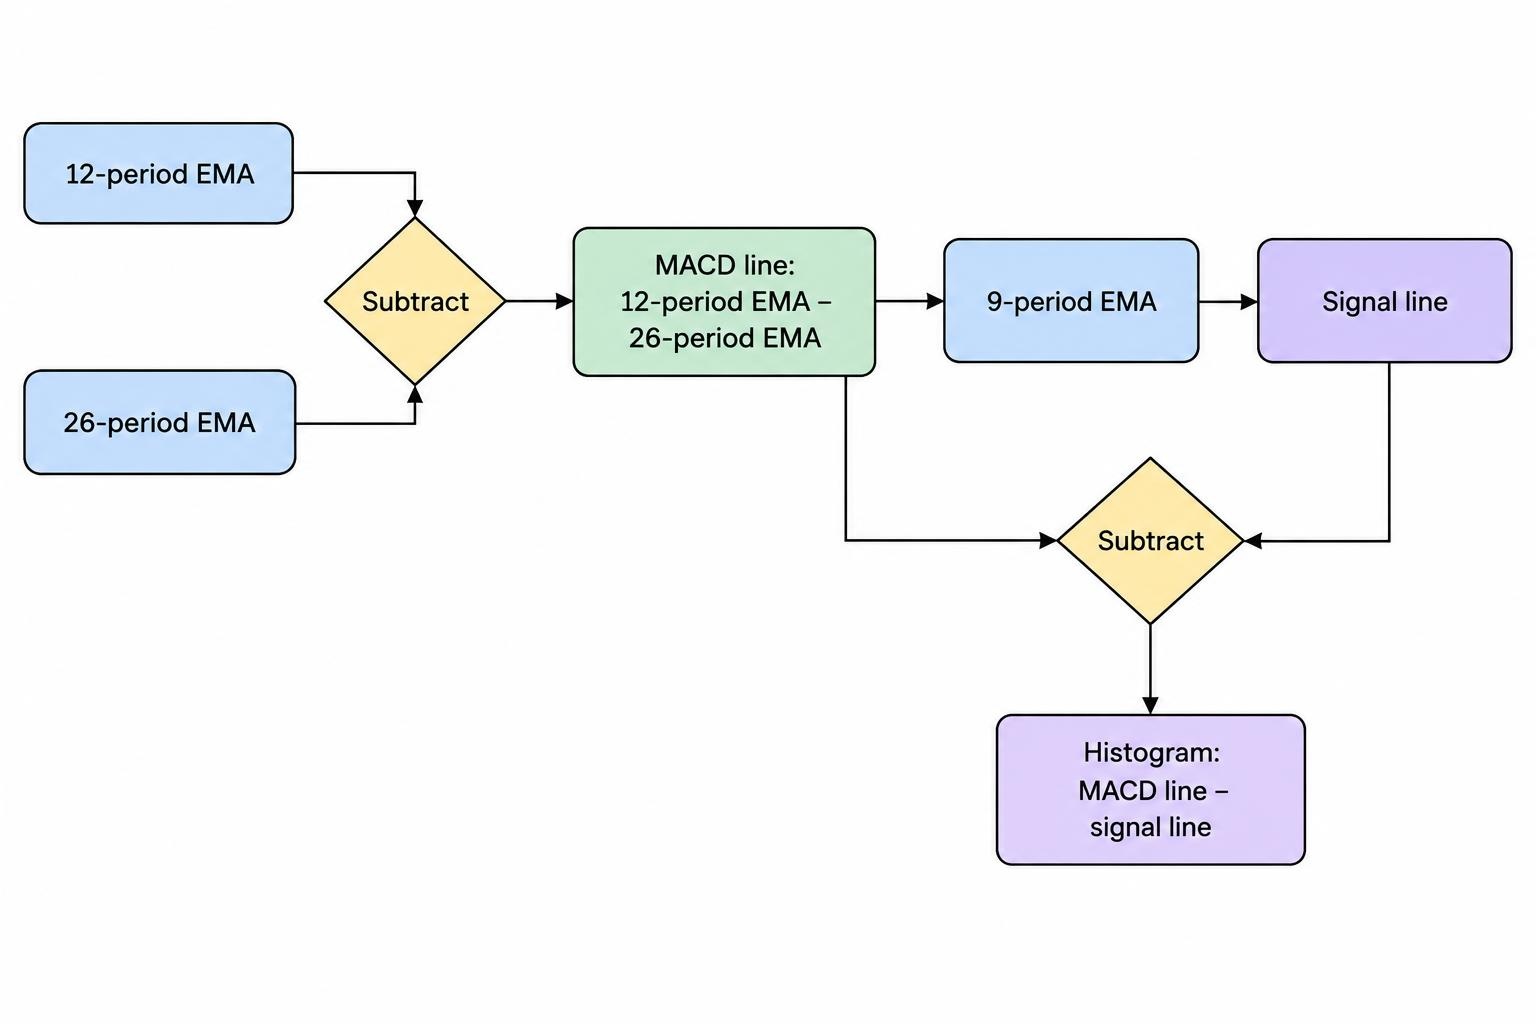
Consider a hypothetical AUD/USD chart. If the faster EMA is 0.66020 and the slower EMA is 0.66010, MACD equals 0.00010. If the signal line equals 0.00006, the histogram equals 0.00004. Those values describe relationships between averages. They are not probabilities of the next price move.
MACD also retains the underlying instrument’s price units. A reading of 5 on an index cannot be compared directly with 0.00010 on a currency pair. Start with the relationship between the lines and their recent history, not the apparent size of the number.
How to Read MACD Signals
Signal line crossovers
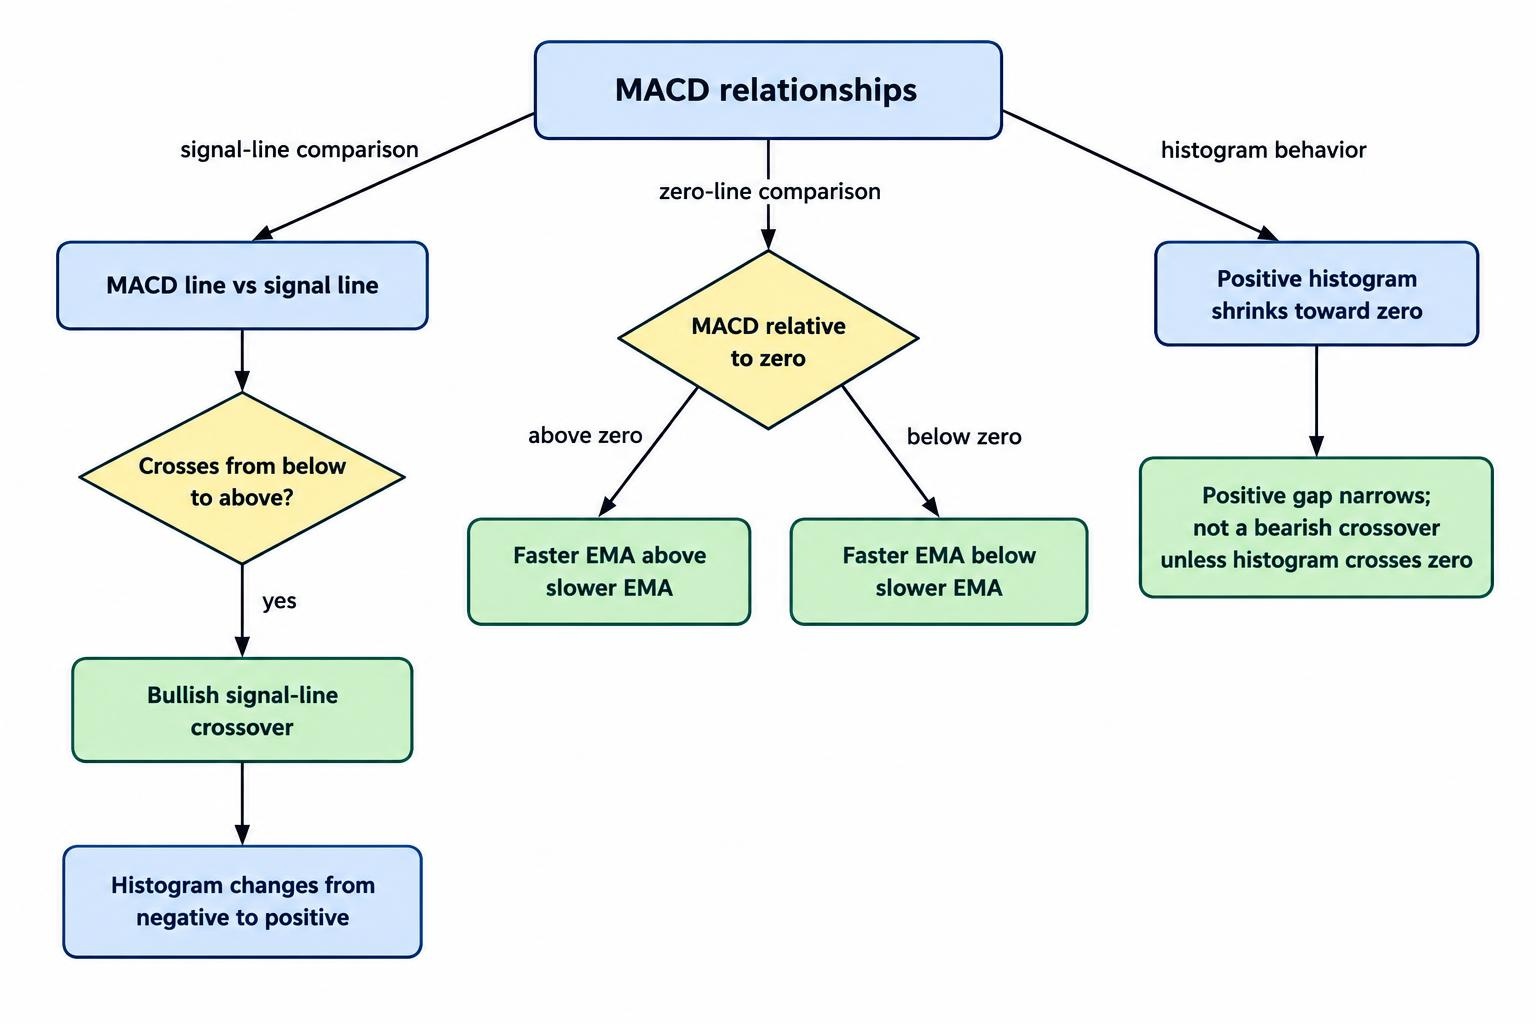
A bullish crossover occurs when MACD moves from below its signal line to above it. A bearish crossover is the reverse. With the difference histogram defined above, a bullish crossover also changes the histogram from negative to positive.
These are two displays of the same event. Requiring both a bullish crossover and a positive histogram does not provide two independent confirmations. The second condition repeats the first in another format.
It also matters where the crossover occurs. MACD can cross above its signal line while both remain below zero. The faster average is still below the slower average, even though MACD has improved relative to its own smoothed value. The underlying moving average calculations help explain why that is not a contradiction.
Zero line crossovers
When MACD crosses above zero, its faster EMA has crossed above its slower EMA. A move below zero means the opposite. This is different from a signal line crossover, which compares MACD with an average of itself.
Suppose MACD rises from −0.00020 to −0.00005. It has moved closer to zero but remains negative. Calling that an established upward trend would go beyond what the calculation shows. A more precise description is that the gap between the averages has narrowed.
Histogram expansion and contraction
A difference histogram rising further above zero shows MACD pulling away above its signal line. Positive bars shrinking towards zero show that gap narrowing. Neither observation guarantees the direction of the next candle.
Suppose the bars decline from 0.00008 to 0.00005 to 0.00002. The histogram remains positive throughout. Treating the first smaller bar as a bearish crossover would confuse weakening separation with an actual change of sign.
Check what the bars represent on your platform. Some implementations plot the main MACD value as bars instead of plotting MACD minus its signal line. The cTrader MACD Histogram documentation, for example, defines its bars as the difference between the fast and slow EMAs. Its zero crossings therefore mean something different from those of the difference histogram above.
Price divergence
Regular bullish divergence describes price making a lower swing low while MACD makes a higher corresponding low. Regular bearish divergence describes price making a higher swing high while MACD makes a lower corresponding high. The observation is a disagreement between price extremes and the indicator, not proof of a reversal.
Divergence can justify examining a trend more closely, but it supplies neither an entry price nor an expiry. The CME Group lesson on MACD and oscillator signals covers divergence as a possible warning of a trend change.
For repeatable research, decide whether you are comparing price with the MACD line or with the difference histogram. Those are separate series and can produce different observations. Keep the choice unchanged throughout the test.
MACD Settings: What Should You Change?
Use 12, 26 and 9 as a documented baseline, not a claim that these settings are best. Changing the inputs changes the question being asked of the price data. Shorter averaging periods place more emphasis on recent observations; longer periods spread that emphasis across more history.
A five minute chart with a 12 period fast average uses five minute observations. It does not use twelve days of data, and the resulting signal does not predict the next twelve candles. Chart timeframe, indicator periods and contract duration are three separate choices.
The average type deserves equal attention. The common signal line described earlier uses an EMA, but MetaTrader 5’s MACD specification uses a nine period simple moving average for its signal line. Matching the numbers alone will not necessarily match crossover times across platforms.
Record the fast period, slow period, signal period, average types, price input and chart interval before comparing results. Otherwise, a supposed disagreement between platforms may be a disagreement between settings.
A faster setting is not a time machine. If you shorten the periods to obtain earlier signals, test the resulting entries and outcomes. Do not assume that reacting sooner means forecasting better.
Give the Signal Price Context
A crossover says nothing directly about how close price is to a previously identified trading level. For research, you might compare otherwise identical signals near prior highs and lows with signals occurring elsewhere. That creates a question you can test rather than another reason to approve a trade after seeing the result.
Mark any relevant support and resistance levels before the signal. Define how you identify them and what “near” means. A level drawn retrospectively around a winning entry cannot serve as evidence that the original decision was sound.
The same discipline applies to market conditions. If a method excludes sideways sessions, define that exclusion before reviewing outcomes. “The market looked messy” is too flexible to audit, especially after a losing streak.
Why Binary Options Expiry Changes the Analysis
MACD describes relationships within price history. A fixed expiry contract asks a different question: does its settlement condition hold at the required time? A price can move in the anticipated direction, reverse briefly, and produce a losing settlement.
That distinction prevents a common testing error. Measuring whether price rises at any point after a bullish signal is not equivalent to measuring whether it finishes above the entry strike at expiry. The former gives the prediction an open window. The latter checks a defined moment.
Keep the chart interval and binary options expiry time separate in your records. A five minute chart does not automatically justify a five minute contract. Nor does using a longer expiry automatically improve the result.
If you compare several durations, treat each as a separate test. Choosing whichever expiry would have won after examining the price path gives the method information it would not have possessed when the signal appeared.
A MACD Paper Trading Framework
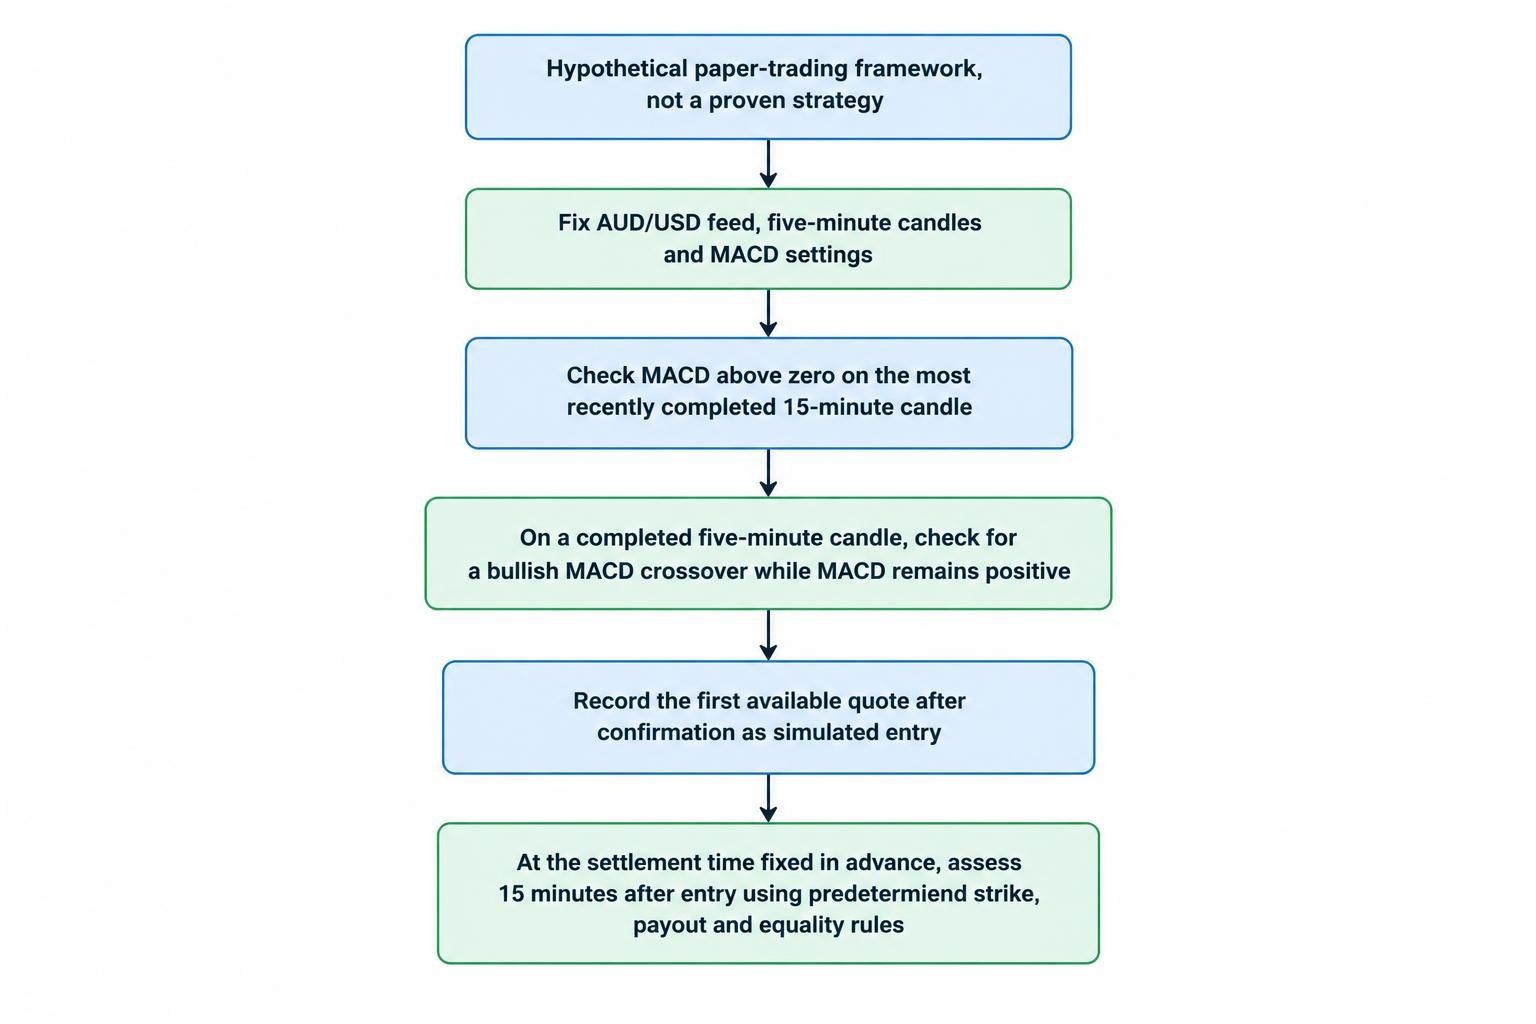
The following framework illustrates how to turn a chart observation into a repeatable exercise. It has not been presented as a tested or profitable strategy. Its purpose is to remove ambiguity from the rules.
- Fix the data: Use one named AUD/USD feed, ordinary five minute candles and recorded MACD calculation settings.
- Define context: Require MACD to be above zero on the most recently completed fifteen minute candle.
- Define the trigger: On a completed five minute candle, require MACD to cross above its signal line while MACD itself remains positive.
- Record the simulated entry: Use the first available recorded quote after confirmation, not a favourable price from earlier in the signal candle.
- Fix the outcome rule: Assess settlement fifteen minutes after the simulated entry, using predetermined strike, payout and equality rules.
Use only one simulated position at a time for this exercise. That restriction keeps repeated signals from creating overlapping observations that are harder to interpret. Record signals skipped because another position was open, rather than quietly deleting them.
A bearish version would reverse the directional conditions. Keep its results separate initially. Combining the two immediately can hide whether one side accounts for most of the gains or losses.
Any extra filter needs a written rule. If you exclude scheduled announcements, identify the calendar and exclusion window before testing. If you add price levels, record them before the crossover. Every discretionary adjustment makes the exercise harder to reproduce.
Worked Example: A Bullish Signal That Still Loses
Assume the framework produces a bullish signal when a five minute candle closes at 10:00. The latest completed fifteen minute candle meets the context rule. A simulated entry is recorded at 10:00:02, with an AUD/USD strike of 0.66030 and settlement fifteen minutes later.
By 10:10, the reference price reaches 0.66060. The anticipated upward movement has occurred, but the exercise does not allow an early exit. At 10:15:02, the stipulated settlement price is 0.66028. Under an above-strike contract with no refund for this outcome, the simulated position loses.
Price might return to 0.66070 a few minutes later. That would not change the recorded result. The test concerns the agreed settlement time, not whether the chart eventually makes the prediction look sensible.
Now change only the settlement price to 0.66034. The simulated position wins despite finishing just above the strike. Under the assumed fixed payout, a narrow winning margin pays the same as a much larger one.
Neither outcome establishes whether MACD works. It demonstrates why your journal needs the entry quote, settlement time and settlement price. A screenshot showing a crossover followed by an upward move cannot answer the contract’s actual question.
Measure Payouts, Not Just Winning Signals
Suppose each simulated position risks A$100 and pays A$80 net profit when successful. A win returns A$180 including the stake; a loss returns nothing. Ignore fees and refunded outcomes for this example.
Across 100 positions, 55 wins produce A$4,400 in profit from winning positions. The 45 losses cost A$4,500. The combined result is a loss of A$100, despite winning more often than losing.
The break-even win rate is the stake divided by the stake plus net winning profit. Here that is 100 ÷ 180, or approximately 55.56%. A lower payout raises the required rate. The relationship between payout and probability and expected value matters more than whether a chart signal looks convincing.
Do not translate a positive MACD reading into a success probability. There is no calculation in MACD that turns its value into a calibrated chance of winning a particular contract. That probability would require separate evidence from observations matching the proposed rules.
Testing Errors That Can Make MACD Look Better
Using an unfinished candle
MACD values can change while the current candle develops. A crossover visible halfway through the candle may disappear before it closes. Historical charts usually show the completed calculation, which can make the decision look cleaner than it appeared at the time.
TradingView’s documentation on repainting and live bar calculations distinguishes changing values on an open bar from more misleading behaviour, such as placing signals into the past. For a close-confirmed exercise, record the signal only after the required candle has finished.
This applies to the context chart too. A completed five minute candle does not make the current fifteen minute candle complete. Use the last finished candle from each interval when that is what the rules require.
Recognising divergence too early
A swing low needs a definition. If your rule requires three later candles to confirm it, you cannot act on that confirmed swing until those candles exist. Placing the entry back on the low introduces information from the future.
Record both the location of the price extreme and the time when the rule could recognise it. For a short expiry exercise, that delay can change the entire result.
Mixing analysis and settlement prices
If the chart feed differs from the stipulated settlement feed, a chart screenshot cannot establish the contract outcome. Keep the two roles separate: one produces the indicator, the other determines settlement.
Where the required settlement data is unavailable, label the result as an estimate or leave it unresolved. Guessing the missing quote adds certainty that the evidence does not support.
How to Evaluate a MACD Method
Write the rules before reviewing the evaluation period. Use earlier observations to develop the method, then examine later observations without changing those rules. This separates designing the exercise from judging its results.
A useful record includes settings, signal time, entry time, direction, strike, expiry, payout, settlement outcome and skipped signals. Follow a consistent binary options backtesting process so that a change in results can be traced to a change in rules or conditions.
Assess net simulated returns alongside win rate. Examine losing sequences, differences between sessions and whether a small group of unusually favourable observations accounts for the result. A profitable total alone does not explain how it arose.
Then test nearby parameter values without repeatedly redesigning the method around the evaluation data. If a small settings change reverses the result, investigate that sensitivity rather than advertising one successful combination.
Where MACD Fits in Technical Analysis
MACD provides a compact way to describe average price separation and changes in that separation. Its useful role in a research process is to supply an observable condition, not to settle every question about direction, timing and risk.
Use the broader technical analysis framework to keep indicator readings, price context and test rules distinct. Adding more indicators is not automatically better, particularly when they repeat the same information in different forms.
The practical standard is straightforward: know what your platform calculates, wait for the confirmation your rules require, and measure outcomes at the correct time. If the records do not demonstrate a positive result after realistic payout assumptions, a convincing MACD chart does not fill the gap.
This article was last updated on: October 22, 2026