Binary options trading strategies combine a market forecast with an entry rule, a strike price and an expiry time. The difficult part is not finding a chart pattern. It is showing that the pattern predicts the contract’s settlement outcome often enough to overcome the payout structure.
Trend following, breakouts, range trading and momentum all provide ideas to test. None should be treated as a proven route to profit simply because its rules sound sensible. A useful strategy must survive realistic testing, unfavourable payouts and the occasions when its market assumptions stop working.
Australian retail restriction: ASIC’s prohibition on issuing and distributing binary options to retail clients took effect on 3 May 2021 and extends until 1 October 2031. Its review found that 74–77% of active retail clients lost money during the 13 months before the ban. The ASIC announcement extending the binary options ban sets out the restriction and evidence. The strategies below are educational frameworks for analysis and paper trading, not instructions to bypass that restriction.
What a binary options strategy must specify
“Buy when the market looks strong” is an opinion, not a strategy. A testable method describes what must happen before an entry, which contract would be selected and how the result would be measured.
At minimum, write down these rules before reviewing results:
- Market and session: the asset, trading hours and conditions included in the test.
- Setup and trigger: the qualifying market pattern and the exact event that produces an entry.
- Contract: the direction, strike, expiry, settlement feed and treatment of ties.
- Economics: the minimum acceptable payout, assumed costs and simulated stake.
- Exclusions: conditions that cancel an otherwise valid signal.
This article concentrates on fixed stake, high-low contracts held to expiry. Touch contracts, range contracts and contracts bought at variable prices need different outcome models. Do not transfer a backtest between contract types without changing the calculations.
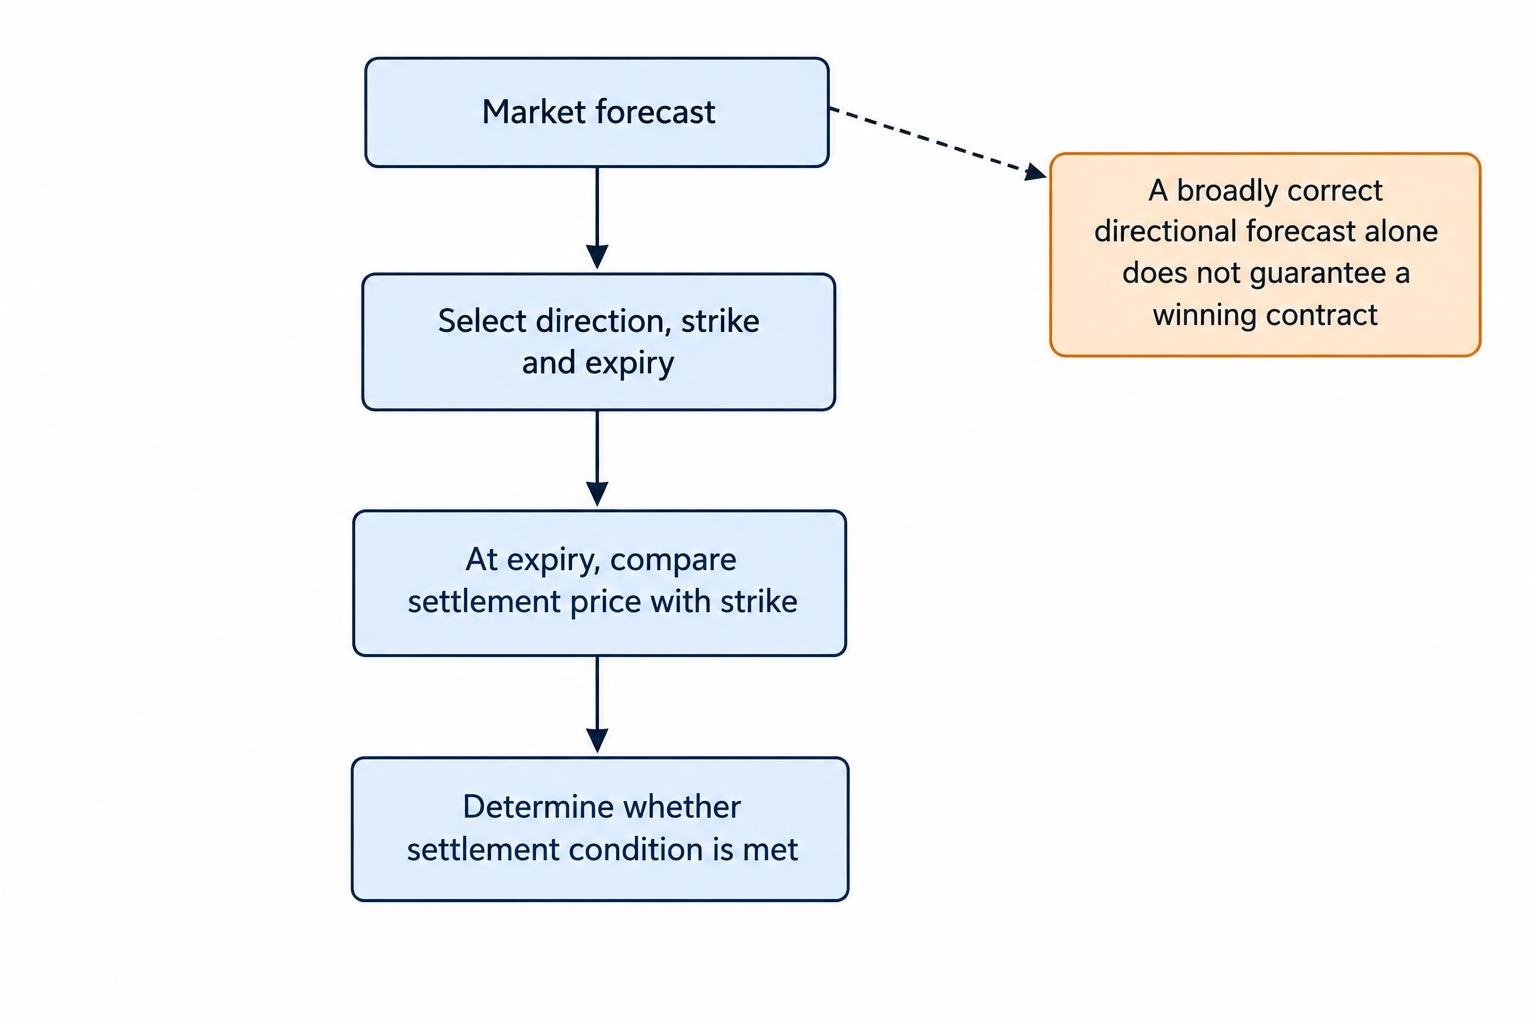
Keep the forecast separate from the result. An upward forecast can be broadly correct while an above-strike contract still loses at its chosen expiry. Binary options strategies must predict the relevant settlement condition, not just the direction visible on a chart afterwards.
Main binary options strategy approaches
| Approach | Hypothesis to test | Main failure to examine |
|---|---|---|
| Trend following | An established direction continues through the chosen expiry. | Entry arrives late or a pullback lasts beyond expiry. |
| Breakout trading | Price continues after crossing a predefined boundary. | The breakout reverses before settlement. |
| Range trading | Price moves away from a range boundary. | The range breaks instead of holding. |
| Mean reversion | An unusually stretched price moves back towards a reference value. | The apparent stretch becomes a sustained directional move. |
| Momentum trading | Recent acceleration persists over the forecast period. | Entry follows the move rather than anticipating its continuation. |
Trend following and momentum
A trend strategy starts by defining direction. Possible rules include successive higher highs and higher lows, or price remaining above a rising moving average. These definitions are not interchangeable: each produces different signals and must be tested separately.
A pullback entry then looks for the established direction to resume after a temporary move against it. Momentum methods instead focus on the strength or acceleration of recent movement. Both need an answer to the same question: what evidence suggests continuation over this contract’s remaining life?
The main trap is hindsight. A chart may show an obvious upward trend, yet a contract entered during a brief correction could expire below its strike. The trend trading strategies guide develops the entry and market condition rules without treating trend direction as a timing signal by itself.
Breakout trading
A breakout method marks a boundary before price crosses it. That boundary might be the previous session’s high, a consolidation range or another mechanically defined level. Drawing the line after seeing the move invalidates the exercise.
Two possible entry models are an immediate crossing and a completed candle closing beyond the boundary. Immediate entry responds sooner but can include temporary breaches. Waiting for a close changes both the entry price and the time available before expiry.
Neither version is automatically superior. Compare them as separate hypotheses, including rejected or late entries. A large breakout candle does not help a contract purchased after most of that movement has already occurred.
Range trading and mean reversion
Range trading assumes that a previously identified boundary will hold. Mean reversion assumes that price will move back towards a reference value, such as an average. A market can move sideways without returning neatly to an average, so the two approaches should not be treated as identical.
An oscillator reading alone does not establish either condition. An “overbought” reading is not a promise that the next candle will fall. Define the range, rejection signal and conditions that invalidate the setup before testing an entry.
The range trading strategies guide covers boundary selection in more detail. For this approach, skipped trades deserve attention: a rule that avoids a developing breakout may matter more than another indicator added to the entry.
News trading
A news strategy needs more than a forecast of the announcement. It needs a rule linking the released information to a price response over a stated interval.
Separate the release time, the first price response and the simulated entry time. A test that assumes entry at the price immediately before an announcement, despite using the announcement’s contents, uses information that was not yet available.
For an initial paper study, treating scheduled announcements as exclusion periods is simpler than building a news reaction model. If news trading is the subject of the test, record the information available at each timestamp and avoid filling gaps with hindsight.
Match expiry to the hypothesis
A chart timeframe controls how price observations are grouped. It does not determine the correct contract expiry. A five-minute candle can support several different forecast horizons, each requiring its own evidence.
Suppose a hypothetical setup anticipates continuation over 20 minutes. Testing it only against a 60-second settlement asks a different question. Equally, extending expiry because an early result would have lost changes the strategy after the fact.
Specify whether expiry means a fixed duration from entry or a fixed clock time. A contract settling at 10:15 has a different remaining life when entered at 10:01 than at 10:14. The binary options expiry times guide explains that distinction.
For short expiries, include plausible entry delays and small price differences in the simulation. If a slight timing adjustment reverses the apparent advantage, treat the result as fragile rather than explaining the difference away.
Judge the payout before the win rate
A strategy’s win rate means little without its winning profit and losing stake. The following examples assume a fixed stake, full loss on unsuccessful contracts, no ties and no fees.
If a successful contract returns the stake plus an 80% profit, the break-even calculation is:
Break-even win rate = 1 ÷ (1 + 0.80) = 55.56%.
Winning half the time loses money under those assumptions. Even a 55% win rate produces an expected loss: with an A$100 stake, 55% × A$80 minus 45% × A$100 equals minus A$1 per contract.
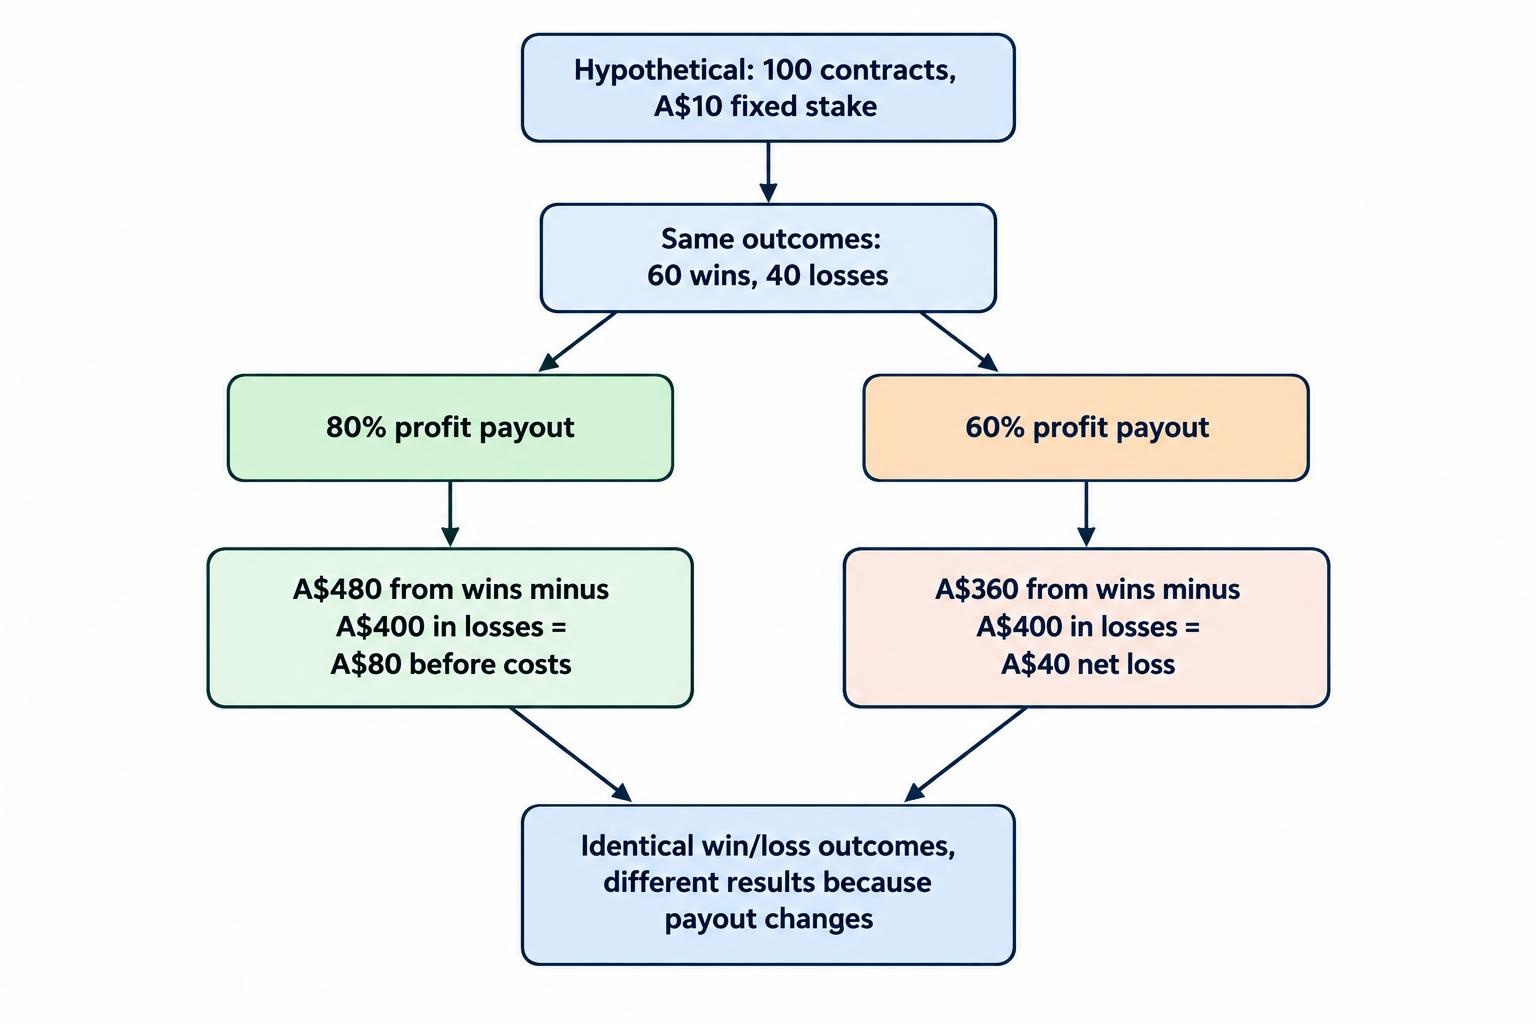
Consider another hypothetical sample of 100 contracts with A$10 stakes and 60 wins. At an 80% profit payout, winning contracts generate A$480 and losing contracts cost A$400, leaving A$80 before costs. At a 60% profit payout, the same outcomes produce A$360 against A$400 of losses: a net loss of A$40.
The chart signals did not change. The economics did. Use probability and expected value calculations to assess the complete payoff, including any fees, refunds or tie rules.
A higher advertised payout is not automatically better either. A different strike may carry a different probability of success. Compare expected returns for the actual contract rather than choosing the largest percentage on display.
Test the strategy without rewriting its history
Start with rules and suitable data
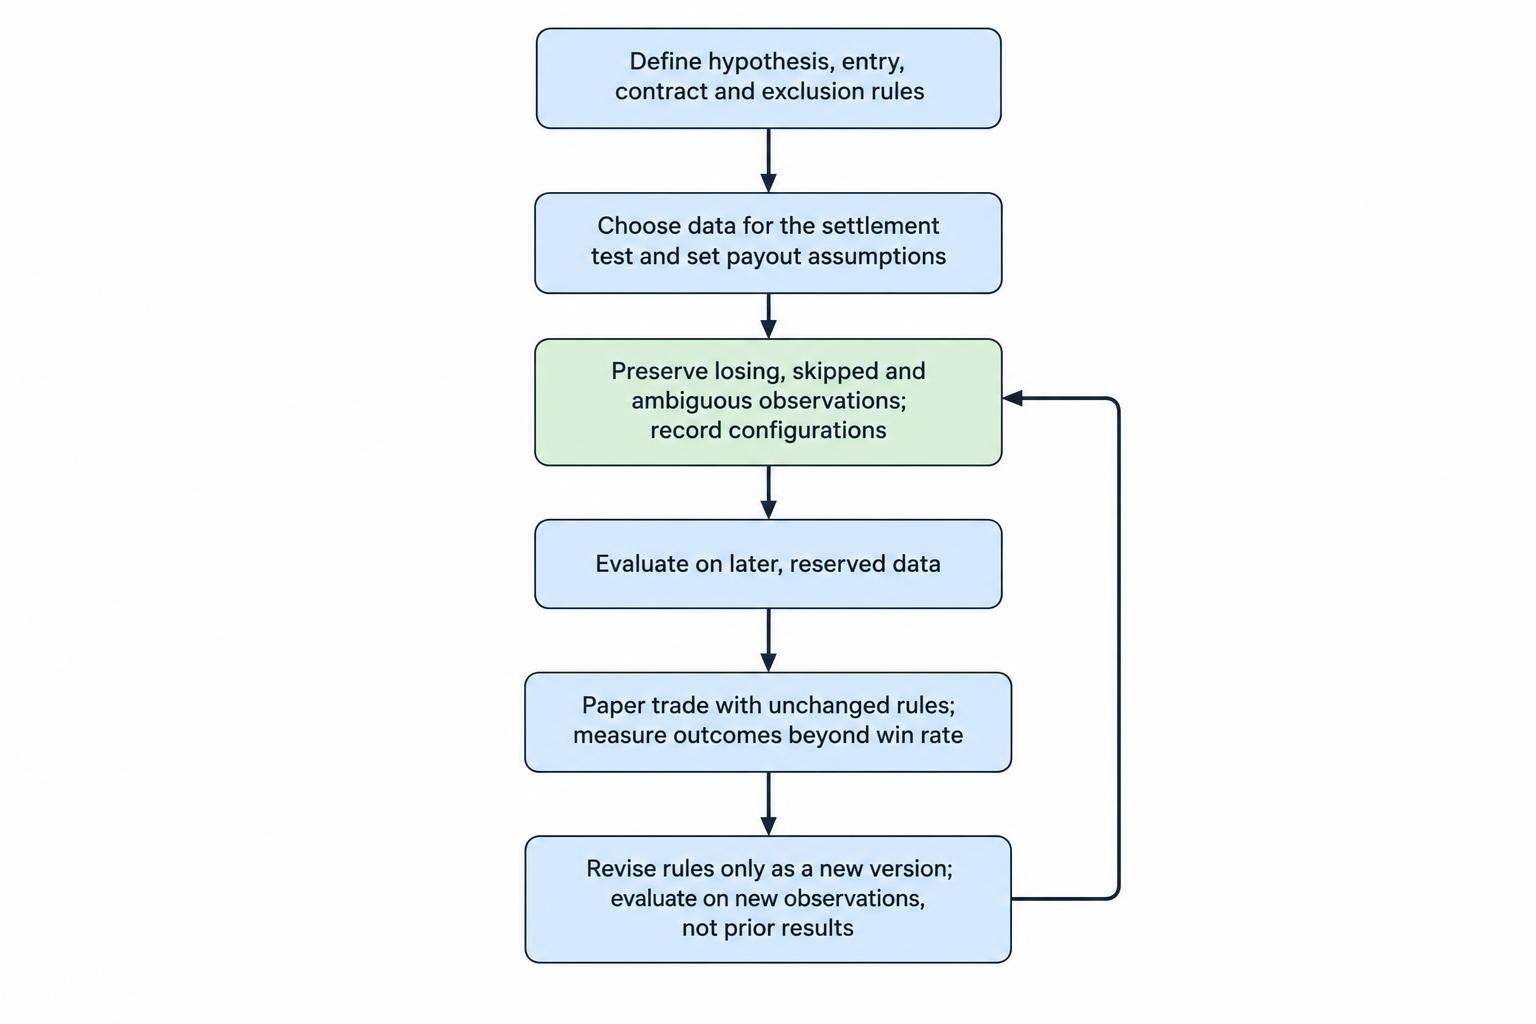
Write the rules before measuring performance. Preserve losing signals, skipped entries and ambiguous observations. If a rule requires judgement, record that judgement before revealing the outcome.
The data must support the proposed settlement test. A candle showing its open, high, low and close does not reveal every price within that interval. It cannot establish an exact entry or settlement price at an arbitrary second.
A test also needs payout assumptions. Historical charts without historical contract terms can test a directional hypothesis, but they cannot establish the returns of contracts that were actually available. The binary options backtesting guide addresses these data and modelling requirements.
Control the temptation to optimise
Trying many indicator settings and keeping only the winner can select historical noise rather than a repeatable relationship. Research on the probability of backtest overfitting examines how repeated strategy selection can produce impressive historical results that disappoint outside the selection sample.
Keep a record of every configuration tested. Reserve later data for evaluation, avoid repeatedly redesigning the rules around it and examine more than one market period. An untouched test period helps, but does not erase the effects of a long search through alternative strategies.
Measure more than accuracy
Record net simulated return, average payout, the number of observations, losing streaks and drawdown alongside win rate. Group results by market condition and session to see whether one brief period accounts for most of the apparent success.
Do not treat overlapping entries as fully independent evidence. Ten contracts opened during one price move may represent repeated exposure to the same event, not ten separate demonstrations of forecasting skill.
Then observe the unchanged rules on new data through paper trading. This checks whether the signals can be identified without hindsight. It does not prove that a live platform would provide matching prices, terms or execution.
Separate risk controls from forecasting skill
Stake sizing changes the size and sequence of gains and losses. It does not turn a negative expected return into a positive one.
Martingale illustrates the distinction. Doubling a hypothetical A$10 stake after each loss produces stakes of A$10, A$20, A$40, A$80 and A$160. Those five losses total A$310. At an 80% profit payout, the next A$320 stake would earn A$256 if successful, which would still leave the sequence A$54 behind.
Increasing stakes to chase recovery therefore introduces another risk without improving the entry signal. For analysis, constant simulated stakes make it easier to see whether a forecasting rule has merit.
Use binary options risk management principles to assess combined exposure, drawdown and stopping rules. Distinguish a rule that cancels an entry from an actual exit: deciding that a forecast is wrong does not mean an existing contract can be closed.
Reject strategy claims that cannot be checked
A screenshot of winning trades is not a complete record. A useful performance claim needs dated entries, contract terms, losing outcomes, stake changes and an explanation of how the sample was selected.
Ask whether signals were recorded before entry, whether historical indicators changed later and whether the quoted payout was available at the relevant time. An advertised “90% accuracy” figure cannot answer those questions on its own.
Platform conduct is a separate issue from strategy performance. The joint SEC and CFTC binary options fraud alert documents complaints involving withheld funds, identity theft and software manipulation. A chart method cannot protect against a counterparty that does not honour its obligations.
A practical paper trading study
Begin with one market, one session and one hypothesis. For example, a study could examine whether a mechanically defined upward trend continues after a pullback. Choose the trend definition, trigger and expiry before collecting outcomes. Treat the chosen settings as research inputs, not recommended parameters.
For each qualifying observation, record the signal time, simulated entry quote, strike, settlement time, assumed payout and result. Mark uncertain prices as uncertain rather than quietly awarding the trade a win.
Review the records in scheduled batches. Changing the rules after every loss makes it difficult to identify what was tested. If a revision is justified, give it a new version number and evaluate it on new observations.
The most useful strategy is not the one with the most indicators or the tidiest chart examples. It is a clearly defined hypothesis that can be rejected when the evidence fails. For Australian retail readers, that evaluation belongs in paper research, not an offshore workaround.
This article was last updated on: October 22, 2026