An 80% binary options payout requires a win rate above 55.56% to produce a profit before costs, assuming every losing trade forfeits the full stake. Winning half the time is not enough: the profit from each winner is smaller than the amount lost on each loser.
This payout and break-even study uses transparent calculations to compare payout rates, trading costs, refunds and changing contract terms. It is a mathematical analysis, not a survey of current broker offers or evidence that any strategy can achieve the required accuracy.
For Australian readers, ASIC’s prohibition on issuing and distributing binary options to retail clients remains in force until 1 October 2031. The calculations below are educational, not a recommendation to trade or use an offshore provider. See the ASIC announcement extending the binary options ban.
Study Method and Payout Definitions
The baseline model uses a fixed stake and two possible outcomes. A winning contract returns the original stake plus a stated profit; a losing contract returns nothing. Later sections adjust this model for fees, loss refunds and ties.
Unless stated otherwise, the calculations assume:
- An equal stake on every contract.
- A fixed profit payout agreed when the contract is accepted.
- No fees, refunds, ties or early closures.
- Settlement and payment exactly as the contract promises.
All dollar examples use Australian dollars. The payout percentages are selected calculation inputs, not verified current offers, historical averages or broker rankings.
Profit payout versus total return
Here, an “80% payout” means an $80 profit on a successful $100 stake. The total amount returned is $180: the original $100 plus $80 profit. A losing contract produces a $100 loss.
This distinction matters. Entering 1.80 as the profit payout in the formula would count the returned stake as profit and produce a false break-even figure. The correct input is 0.80.
The guide to binary options payouts covers payout terminology separately. This study focuses on what those payments imply for profitability.
The model also has a boundary: it covers contracts expressed as a profit percentage of the stake. Contracts purchased at a quoted price and settled for a fixed cash amount require converting those cash flows into the actual potential profit and loss before applying the calculations.
The Binary Options Break-Even Formula
Let S represent the stake, r the profit payout expressed as a decimal, and p the probability of winning. The expected net result per contract is:
Expected net result = S × [p × r − (1 − p)]
The first term represents the probability weighted profit from winning. The second represents the probability weighted loss. Setting the result to zero gives:
Break-even win probability = 1 ÷ (1 + r)
For an 80% profit payout, the calculation is 1 ÷ 1.80 = 0.555555…, or approximately 55.56%. A positive expected return requires a win probability above that threshold, before costs.
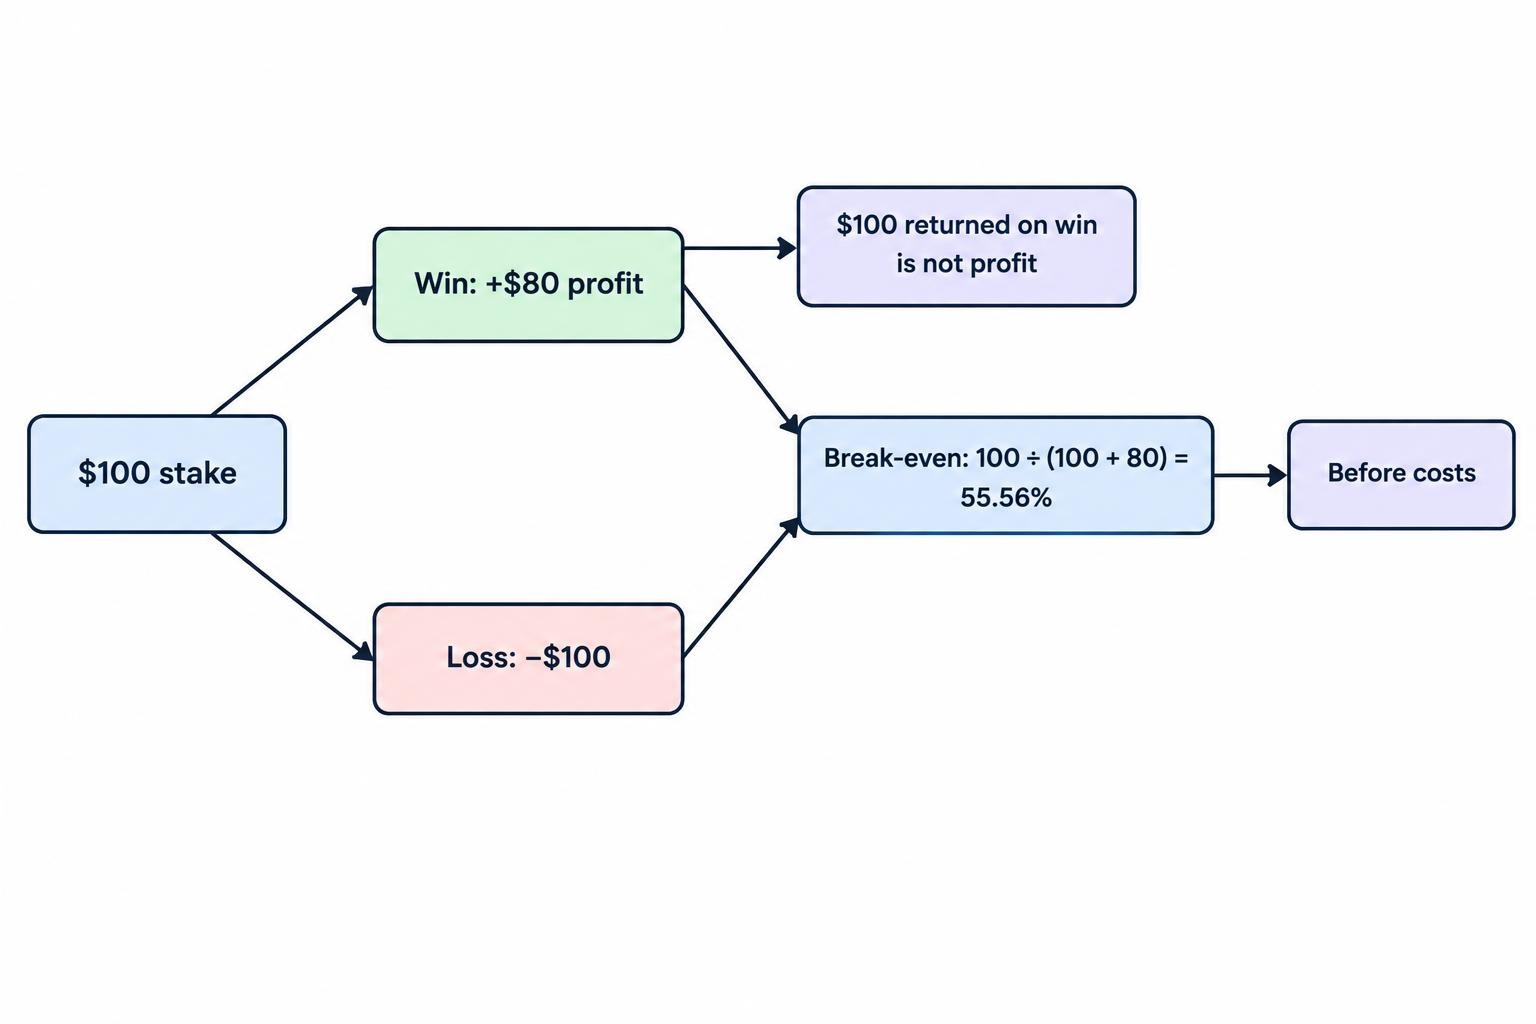
The same equation applies to a completed record with equal stakes and an unchanged payout: substitute the observed win rate for p to calculate its average result. That describes the record, not necessarily the probability of winning future contracts.
The payout imbalance is also demonstrated in the joint CFTC and SEC investor alert: a 50% chance of winning can still produce a negative expected return when a losing contract costs more than a winner earns.
Results Across Different Payout Rates
The table applies the baseline formula to selected profit payouts. The final column assumes a genuine 50% win probability and a $100 stake.
| Profit payout on a winner | Break-even win rate | Expected net result per $100 stake at 50% accuracy |
|---|---|---|
| 50% | 66.67% | −$25.00 |
| 60% | 62.50% | −$20.00 |
| 70% | 58.82% | −$15.00 |
| 75% | 57.14% | −$12.50 |
| 80% | 55.56% | −$10.00 |
| 85% | 54.05% | −$7.50 |
| 90% | 52.63% | −$5.00 |
| 95% | 51.28% | −$2.50 |
| 100% | 50.00% | $0.00 |
Thresholds are rounded to two decimal places. Use the unrounded value when checking a result very close to break-even.
A higher payout lowers the required accuracy, with everything else unchanged. It does not establish that the contract is better value: the probability of satisfying its settlement condition may also differ. The 50% assumption is a comparison benchmark, not a claim that every binary outcome has equal odds.
At a 100% profit payout, a genuine 50% win probability produces zero expected profit before costs. That is mathematical fairness under the assumptions, not a safety assessment.
Worked Example: Winning More Often Than Losing
Consider 100 contracts with a $100 stake and an 80% profit payout. If 55 contracts win and 45 lose, winning trades generate $4,400 profit while losing trades cost $4,500. The net result is a $100 loss, despite more wins than losses.
With 56 winners and 44 losers, the result becomes $4,480 minus $4,400, or an $80 profit before costs. Across this 100 contract record, one additional winner changes the result by $180: it replaces a $100 loss with an $80 gain.
The return should also use the correct denominator. In the 55 winner example, total stakes are $10,000, so the $100 loss equals 1% of turnover. It does not automatically equal 1% of the account balance, because the same money may have been reused across contracts.
The distinction between an expected result and a realised result is developed in probability and expected value in binary options. Neither a profitable batch nor a losing batch, by itself, identifies the true win probability.
Why Changing Payouts Can Distort a Track Record
A win rate without payout information is an incomplete performance measure. With equal $100 stakes, 55 wins out of 100 produce a $450 profit at a fixed 90% payout, but a $650 loss at a fixed 70% payout.
Changing payouts within the same record creates another problem: an ordinary average of all quoted payouts may not reproduce the actual result.
Consider 50 contracts paying 90%, of which 20 win, followed by 50 contracts paying 60%, of which 35 win. There are 55 winners and 45 losers in total. Winning profits equal $1,800 plus $2,100; losses equal $4,500. The net result is −$600.
The average payout across all 100 contracts is 75%. Applying that average to all 55 winners would suggest a $375 loss instead. The shortcut understates the loss because more winners occurred in the lower payout group.
For a completed record without refunds, calculate:
Net result = total profits from winning contracts − total stakes lost − total costs
Use each accepted payout and actual stake. When stakes also vary, a count based win rate becomes even less informative: ten small winners can be outweighed by one large loser.
How Fees, Refunds and Ties Change Break-Even
Fees raise the required win rate
If every contract incurs a cost equal to a fraction c of the stake, the baseline threshold becomes:
Break-even win probability = (1 + c) ÷ (1 + r)
At an 80% payout with a $1 cost per $100 contract, c equals 0.01. Break-even rises from 55.56% to approximately 56.11%.
That small charge can reverse a narrow profit. The earlier 56 winner example earned $80 before costs. Charging $1 on each of its 100 contracts turns it into a $20 loss.
This model assumes the charge applies to every contract, regardless of outcome. Withdrawal fees, currency conversion charges and subscription costs need treatment that matches when they are incurred. A fuller account assessment belongs in total trading cost examples; do not quietly drop those expenses from a performance calculation.
Loss refunds reduce the amount at risk
Suppose a losing contract refunds 10% of its stake. The net loss on a $100 loser becomes $90, rather than $100. Let b represent the refunded fraction. Including a per-contract cost fraction c gives:
Break-even win probability = (1 − b + c) ÷ (1 + r − b)
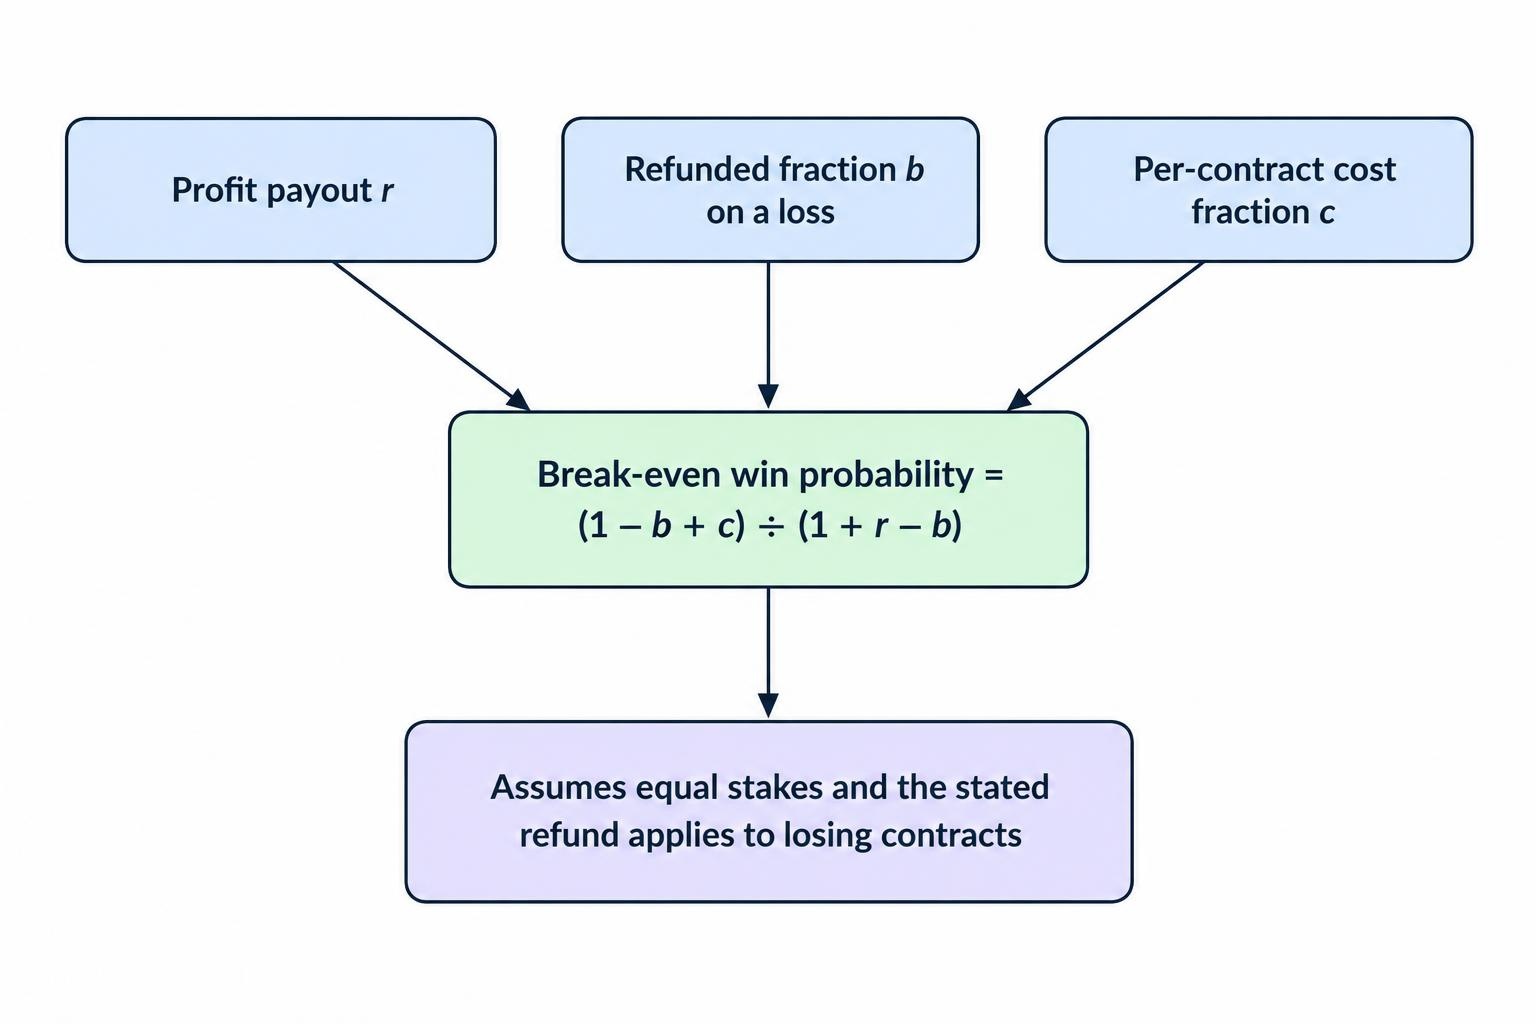
With an 80% profit payout, a 10% loss refund and no fees, break-even is 0.90 ÷ 1.70, or approximately 52.94%.
A refund is not automatically a better deal if the winning payout also falls. At a 70% profit payout with the same 10% refund, break-even becomes 56.25%—higher than the 55.56% required by an 80% payout without a refund.
Ties need separate treatment
If a tie returns the entire stake without a charge, it contributes zero net profit. The baseline threshold then applies to decided contracts: wins divided by wins plus losses, excluding refunded ties.
If ties count as losses, include them among losing outcomes. If a refunded tie still attracts a fee, it is not costless. A performance record should show ties separately rather than hide them inside an unexplained accuracy figure. See binary options settlement and tie rules for the contract distinctions.
A Profitable Sample Does Not Establish a Reliable Edge
Suppose a record contains 60 wins from 100 equal stake contracts at an 80% payout. It earns $800 before costs. Its observed accuracy is 60%, above the 55.56% threshold.
There is still uncertainty about the underlying win probability. Using the NIST Wilson confidence interval method, the calculated two-sided 95% interval for 60 wins in 100 trials is approximately 50.20% to 69.06%. That interval includes probabilities below break-even.
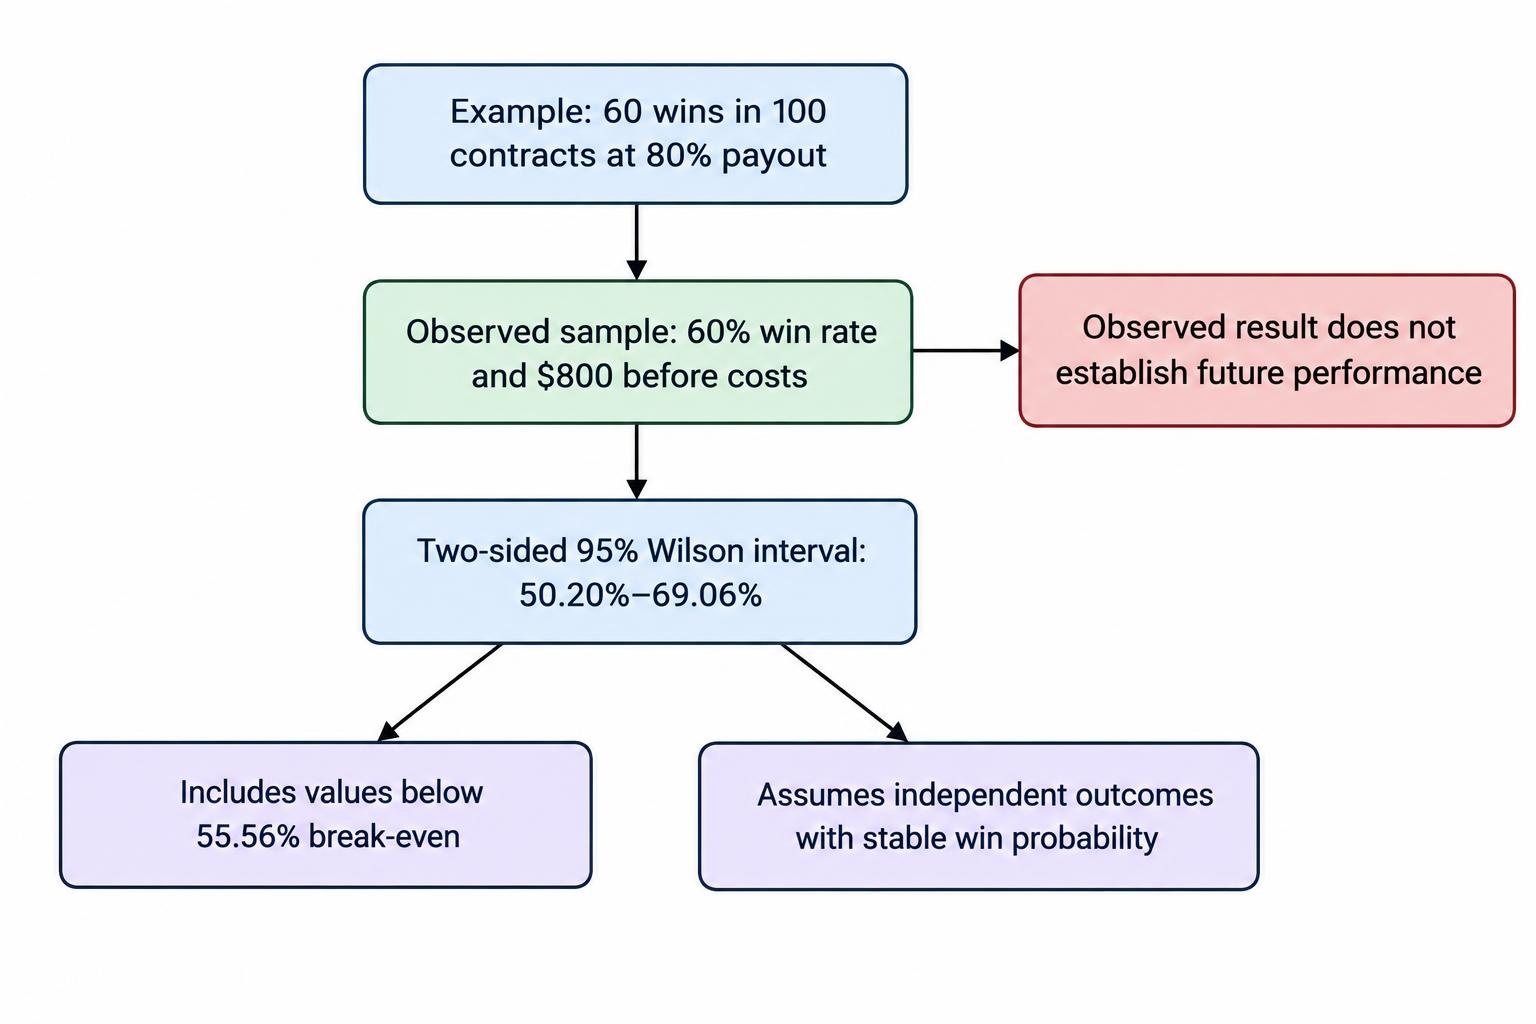
This calculation assumes independent outcomes with a stable win probability. Overlapping contracts on the same market may violate independence. Selecting only the best period, changing rules after seeing results or testing many strategies and reporting one winner also weakens the interpretation.
A useful evaluation therefore preserves a complete record and tests unchanged rules on later observations. Record accepted payouts, stakes, outcomes, refunds and costs—not just green ticks. The separate guide to evaluating trading signal track records covers the evidence needed to assess performance claims.
What This Study Can and Cannot Establish
The calculations establish the accuracy required by stated cash flows. They do not estimate achievable trading accuracy, prove that a signal works or measure the chance of receiving a withdrawal.
More trading also does not repair negative expected value. Under the baseline assumptions, a $100 contract with an 80% payout and a 50% win probability loses $10 in expectation. One hundred such contracts have a combined expected loss of $1,000, although the realised result can differ. ASIC’s 2021 public notice supporting its intervention order discusses modelling in which repeated trading increased expected losses and the likelihood of finishing at a loss.
The model also assumes the provider honours the contract. That assumption cannot be established through payout arithmetic. The CFTC warning on off-exchange binary options identifies complaints involving denied withdrawals, hidden fees and misleading return claims. A displayed profit is not the same as money received.
The practical test is therefore stricter than “does the win rate look good?” Check the actual payout, calculate net results after all costs, allow for uncertainty and examine whether the record is complete. At an 80% profit payout, 55.56% is the mathematical starting point—not proof of a profitable strategy.
This article was last updated on: October 22, 2026