Signal repainting and latency create different problems in binary options analysis. Repainting can make a historical chart show a signal that was absent, provisional or elsewhere when the market was live. Latency means information reaches the user, or an order reaches a platform, after the event that prompted it. A signal can suffer from either problem without suffering from both.
For Australian readers, this is an educational assessment, not a route to live trading. ASIC’s binary options product intervention order bans the issue and distribution of binary options to retail clients until 1 October 2031. The checks below can be performed through paper observation and records analysis without depositing money.
What Signal Repainting Actually Changes
The useful question is not simply whether an indicator “repaints”. Ask what changes, when it changes, and whether the displayed history matches what a user could have acted on.
An indicator using an unfinished candle can change as prices move. A provisional upward signal might disappear before that candle closes. That behaviour is not automatically deceptive, but presenting the surviving historical signals as a complete record of live alerts would be misleading.
Higher timeframe inputs create another trap. A signal on a one minute chart may depend on an unfinished fifteen minute candle. Closing the one minute candle does not confirm the fifteen minute input. A separate problem, lookahead bias, occurs when historical calculations use information that was not yet available. These distinctions are covered in TradingView’s technical documentation on repainting.
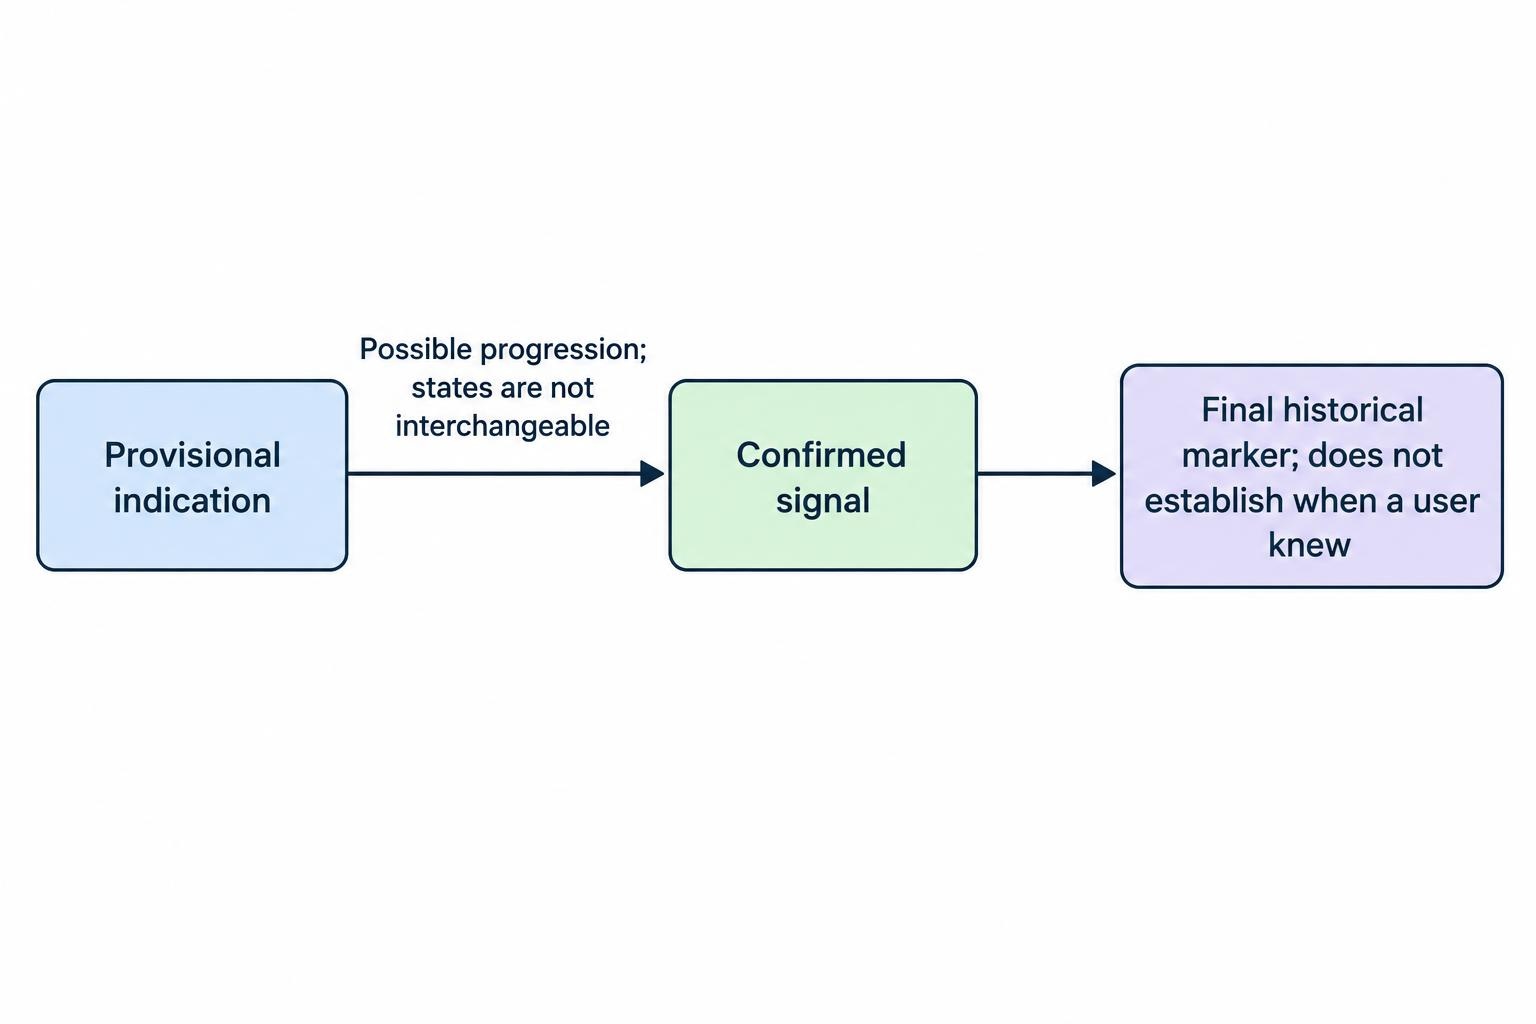
For an audit, separate three states: the first provisional indication, the confirmed signal, and the final historical marker. Treating those as interchangeable makes timing comparisons unreliable before delivery speed even enters the discussion.
Moving Markers and Retrospective Turning Points
Some indicators revise previously plotted turning points rather than just updating the current candle. ZigZag is a clear example: its latest segment and earlier plotted values can change as new prices arrive. MetaTrader’s ZigZag documentation identifies this behaviour and distinguishes historical analysis from forecasting.
Consider a hypothetical tool that marks a low at 10:00 but needs two later candles to recognise it. If recognition occurs at 10:02, the actionable time is 10:02, even if the marker sits beneath the 10:00 candle.
The marker’s position answers “where was the turning point?” It does not necessarily answer “when did the user know?” A performance record that assigns an entry to 10:00 would need evidence that the signal actually existed then. A neatly positioned arrow cannot supply that evidence on its own.
Why Waiting for Candle Close Is Not a Complete Fix
Waiting for candle close can avoid alerts based on conditions that disappear before the candle finishes. However, “once per bar” and “once per bar close” are not equivalent settings. On TradingView, the former can trigger on the first qualifying call during the candle; the latter requires the closing update. The platform also stores a snapshot of the script, inputs, symbol and timeframe when an alert is created. Later chart changes do not update that running alert; see the TradingView alert timing and configuration documentation.
This gives an audit two separate jobs: confirm when the signal becomes valid, then confirm which configuration generated the notification. Otherwise, a chart using revised settings may be compared with alerts still running older settings.
Waiting also changes the decision time. Suppose a condition first appears twenty seconds into a one minute candle but requires its close for confirmation. The next forty seconds are part of the signal’s design, not a delivery fault. A fair paper test must begin at confirmation, rather than borrowing the earlier provisional price.
Where Signal Latency Enters the Chain
Measure latency between named events. “The signal was five seconds late” means little unless the starting and ending timestamps are clear.
For an audit, separate the chain into these stages:
| Stage | What to record | Question it answers |
|---|---|---|
| Signal recognition | Time the required condition becomes valid | When could the signal first exist? |
| Alert generation | Time the system creates the alert | Was processing or confirmation required? |
| Message receipt | Time the notification reaches the device | How long did delivery take? |
| User response | Time the user records a decision | How much delay followed receipt? |
| Contract acceptance | Acceptance time in an existing transaction record | When did the platform accept the contract? |
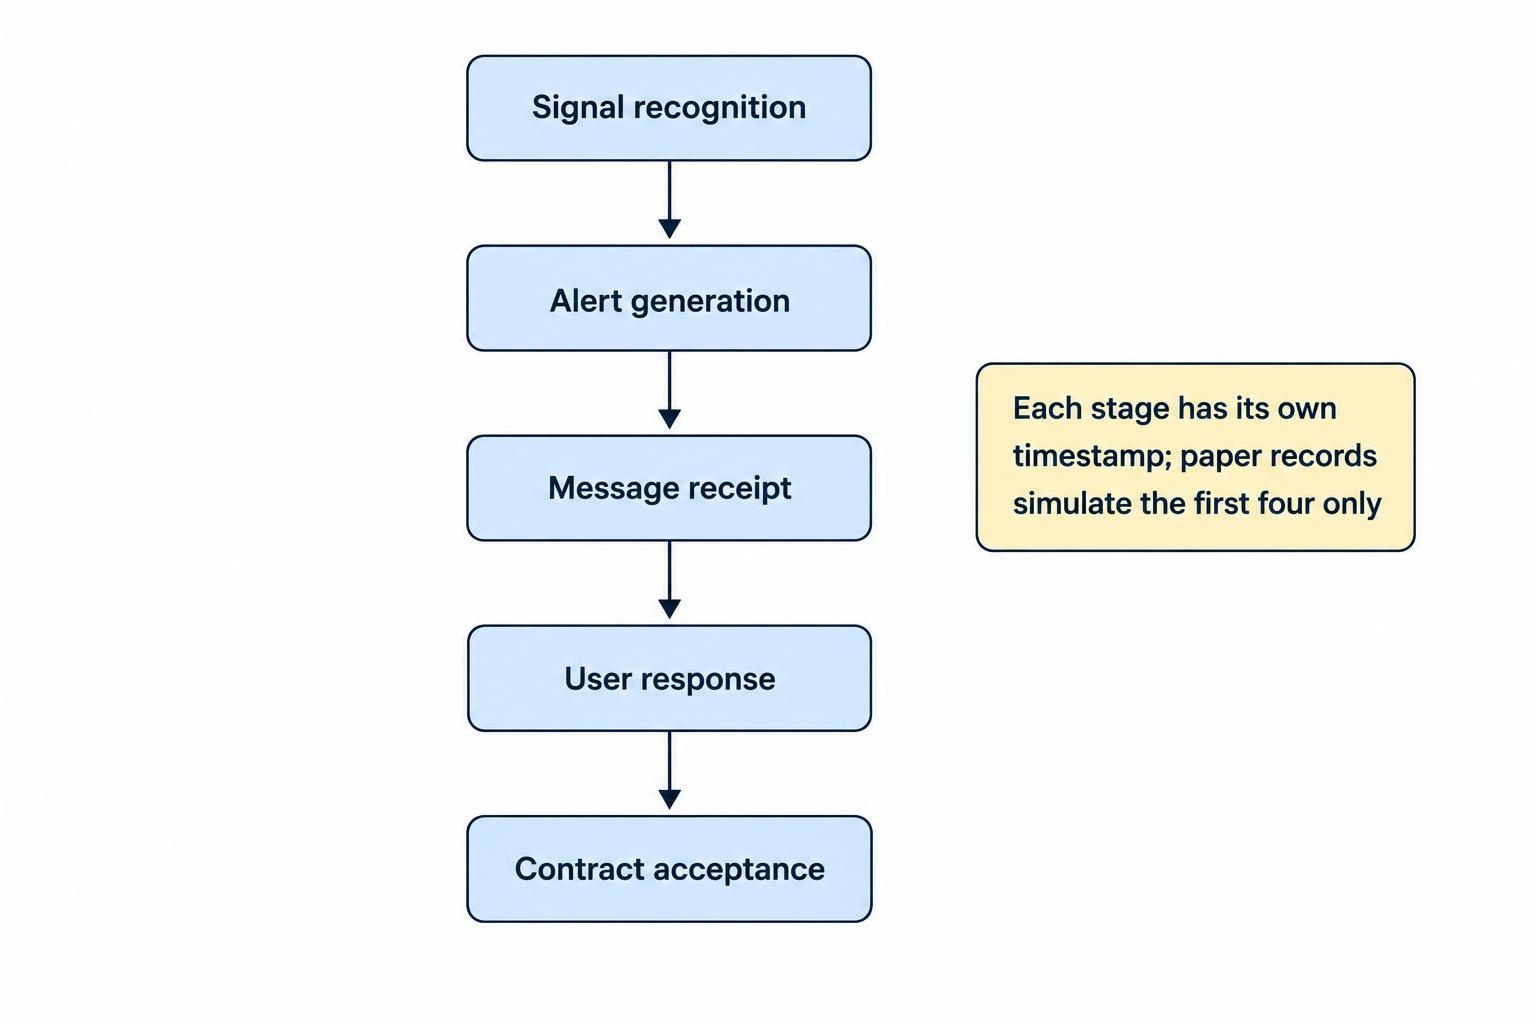
For paper observation, record the first four stages and label the entry as simulated. Do not describe an assumed acceptance time as an executed transaction. The distinction between a submitted instruction and an accepted contract belongs to binary options execution and latency, rather than the indicator’s signal logic.
Use timestamps with seconds where available and identify the timezone. For comparisons across systems, document clock offsets too. A device clock running several seconds ahead can make a prompt message look late. Keep generation time, receipt time and the candle’s timestamp in separate fields.
A Hypothetical Eight Second Delay
Suppose a confirmed upward signal is generated at 12:00:00 UTC. The notification arrives at 12:00:04, and the observer records a paper entry at 12:00:08.
If the hypothetical contract expires at the fixed time of 12:01:00, only fifty two seconds remain at that entry. Scoring the result from the price at 12:00:00 would evaluate a different entry from the one the observer recorded.
If the contract instead runs for sixty seconds from acceptance, an assumed acceptance at 12:00:08 moves expiry to 12:01:08. Now both the entry and settlement times differ from a test using the original signal timestamp.
Neither example proves that delay always worsens the result. Price could move favourably or unfavourably during those eight seconds. The point is that the original test no longer represents the delayed entry. Do not apply a convenient universal adjustment, such as subtracting a fixed percentage from the advertised win rate. Recalculate each hypothetical outcome using its actual recorded timing and stated contract rules.
Check Price Feeds Before Blaming Delivery Speed
Before calling a discrepancy “latency”, establish that both records refer to the same instrument and comparable prices. An AUD/USD signal is not fully identified by the pair name alone. Record the chart’s data provider, symbol, timeframe and price convention, then compare them with the contract’s stated pricing and settlement terms.
The price feeds and benchmarks guide covers that comparison in more detail. Here, the practical rule is simple: do not measure a timing problem using unidentified prices.
Suppose a historical screenshot uses one feed while the paper observer records another. A different result does not, by itself, establish that either system was slow. Equally, matching timestamps do not establish matching prices.
Preserve these disagreements as separate audit categories. “Different feed”, “message arrived late” and “signal disappeared” describe different failures. Combining them into one column labelled “bad signal” removes the evidence needed to diagnose anything.
Why a Reloaded Chart Is Not a Live Record
A completed candle does not necessarily preserve the sequence of price changes that occurred inside it. That can matter when a calculation responds to the order of those changes. Sierra Chart documents a case where its Zig Zag reversal location can differ between live updating and full recalculation because the completed bars do not reveal how the movement unfolded; see its Zig Zag recalculation notes.
For that reason, a screenshot taken after reloading is not a substitute for a record captured when an alert arrived. It shows the recalculated chart, not necessarily the earlier display.
Keep both versions. The useful comparison is between the original notification, the contemporaneous chart and the later reconstruction. A mismatch is something to investigate, not automatic proof of fraud.
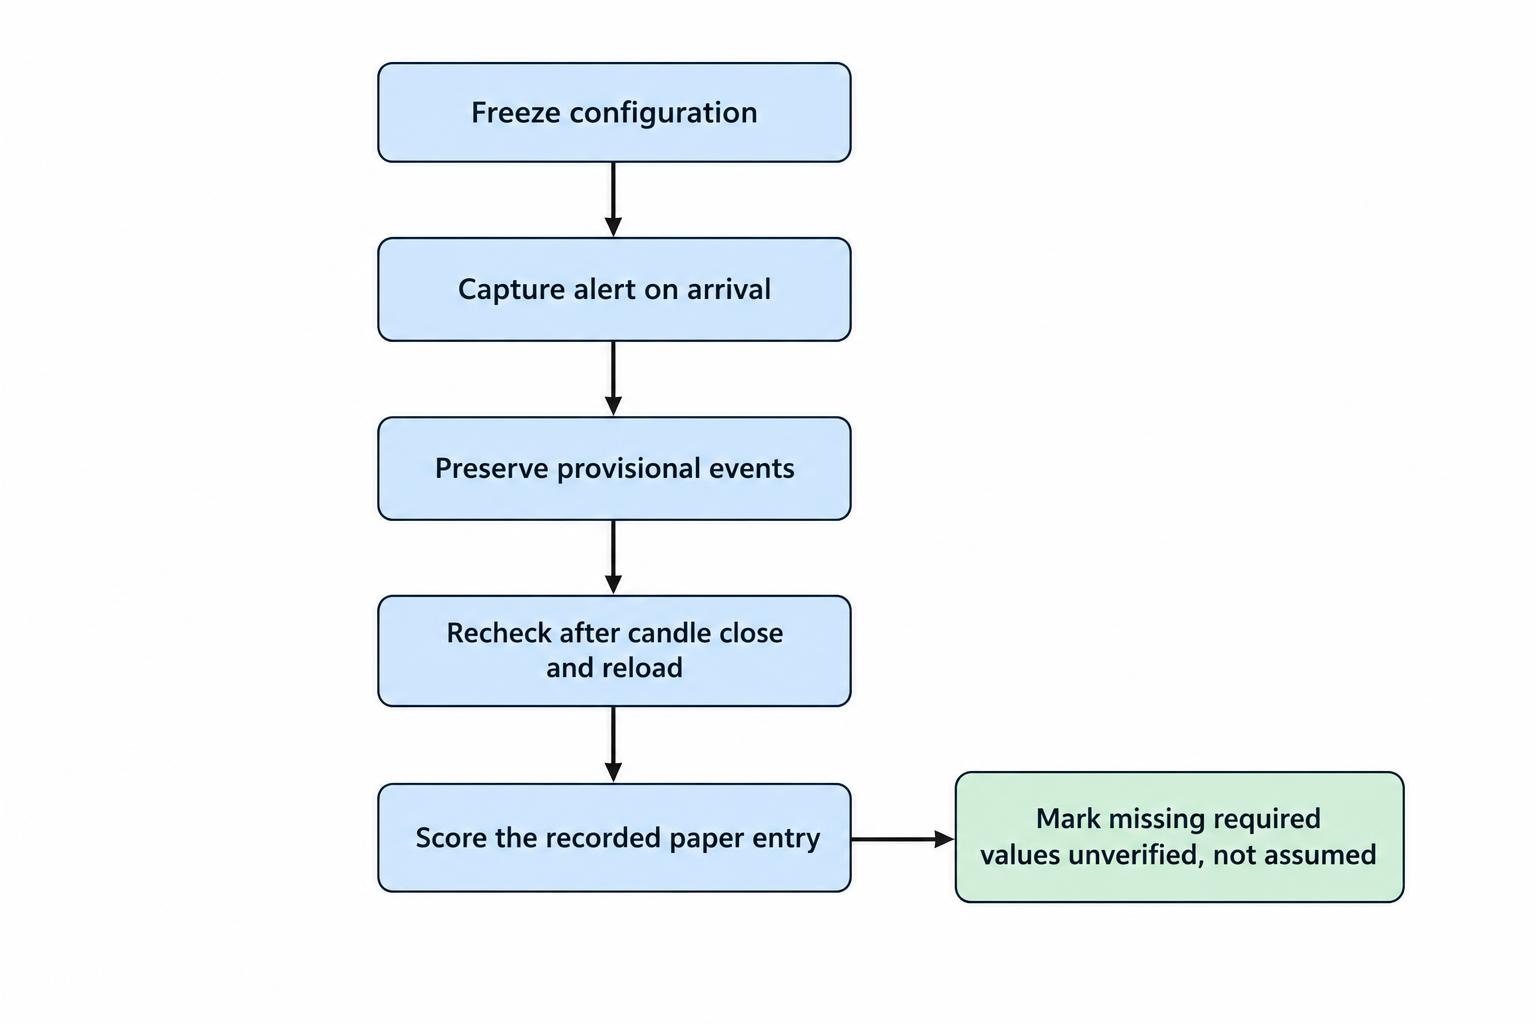
How to Audit Repainting and Latency Without Funding an Account
Use a paper observation period with rules written before collection starts. The purpose is to establish whether the signal record survives contact with real time, not to demonstrate profitability. A broader forward testing process can then assess performance without treating reconstructed arrows as live evidence.
- Freeze the configuration. Record the indicator version, inputs, symbol, feed, timeframe and alert settings. Save changes under a new test label instead of mixing them into the original sample. If the provider changes its rules midway through the test, preserve both versions.
- Capture each alert on arrival. Save the original message and its receipt time. Record any generation timestamp separately. Capture enough of the chart to identify the candle and settings, without exposing account details or personal information.
- Preserve provisional events. If an indication appears and later disappears, keep the original observation. Label it provisional, cancelled or confirmed under the rules set beforehand. Do not erase it simply because the final chart looks different.
- Recheck the same period. Compare the live record with the chart after candle close and after reloading. Note moved markers, deleted signals and newly appearing historical markers. Check whether settings or input data changed before assigning a cause.
- Score only the recorded paper entry. Use the observation’s timestamp, price assumption, expiry rule and tie treatment. Where a required value is missing, mark the result unverified rather than filling the gap with a favourable assumption.
Track delivery delay separately from confirmation delay. Report more than an average: the longest observed delays and the proportion arriving after the test’s entry cutoff also matter. Define that cutoff before seeing the outcomes.
Retain every alert in the delivery audit, including duplicates, cancellations and messages received too late. If the performance rules exclude stale messages, show those exclusions separately. Otherwise, a provider can appear accurate simply because the difficult observations vanished from the denominator.
A short clean run does not establish a lasting edge. It does establish something narrower and useful: whether the tool behaved consistently during the recorded period, under the recorded settings.
Distinguish Technical Behaviour From Misleading Claims
A provisional marker that disappears under a disclosed rule is different from a seller deleting losing recommendations while advertising an untouched record. Ask for clear definitions, original timestamps and a history of revisions. “Non repainting” should describe observable behaviour, not serve as a substitute for evidence.
Platform misconduct is a separate concern. The joint SEC and CFTC investor alert on binary options fraud records complaints alleging software manipulation, including distorted prices and expiry countdowns extended until winning trades became losses. Those are allegations of manipulation, not ordinary indicator recalculation.
Do not diagnose such conduct from a single mismatched candle. Preserve original records and compare the published contract terms with what happened. Conversely, do not accept “latency” as a catchall explanation for changed expiry terms or missing transaction records.
For a signal seller, refusal to distinguish generation time from receipt time leaves a basic claim unverified. A historical chart full of winning arrows does not repair that gap.
Judge the Record, Not the Label
A usable signal record needs an honest decision time, a reproducible configuration and an entry assumption that reflects when the information became available. Stable historical markers alone do not establish any of those.
Once repainting and timing have been checked, assess payouts, exclusions, sample size and complete results through a separate trading signal track record review. Passing a technical audit does not make a signal profitable or remove binary options risk. It means the evidence is coherent enough to examine, rather than being a better looking version of the past.
This article was last updated on: October 22, 2026