Backtesting binary options strategies means applying fixed trading rules to historical data, then calculating how the resulting contracts would have settled. A useful test must reproduce more than market direction. It needs an entry time, strike price, expiry, settlement rule and payout assumption for every simulated trade.
The purpose is to challenge a strategy, not produce an attractive win rate. A test should reveal whether an apparent advantage survives realistic contract terms, unseen data and less favourable assumptions.
For Australian readers, this is an educational research exercise. ASIC’s binary options product intervention order bans their issue and distribution to retail clients until 1 October 2031. A profitable simulation does not change that restriction.
Test the Contract, Not Just the Direction
A binary options backtest asks whether a defined contract condition was satisfied. “The price rose after the signal” is not enough. It must have risen above the relevant strike by the correct settlement time, under the stated pricing rules.
Start by turning the chosen binary options strategy into instructions that another person could reproduce without making judgement calls. Replace phrases such as “strong momentum” or “near support” with measurable conditions. Specify which completed bars supply the inputs and when the signal becomes available.
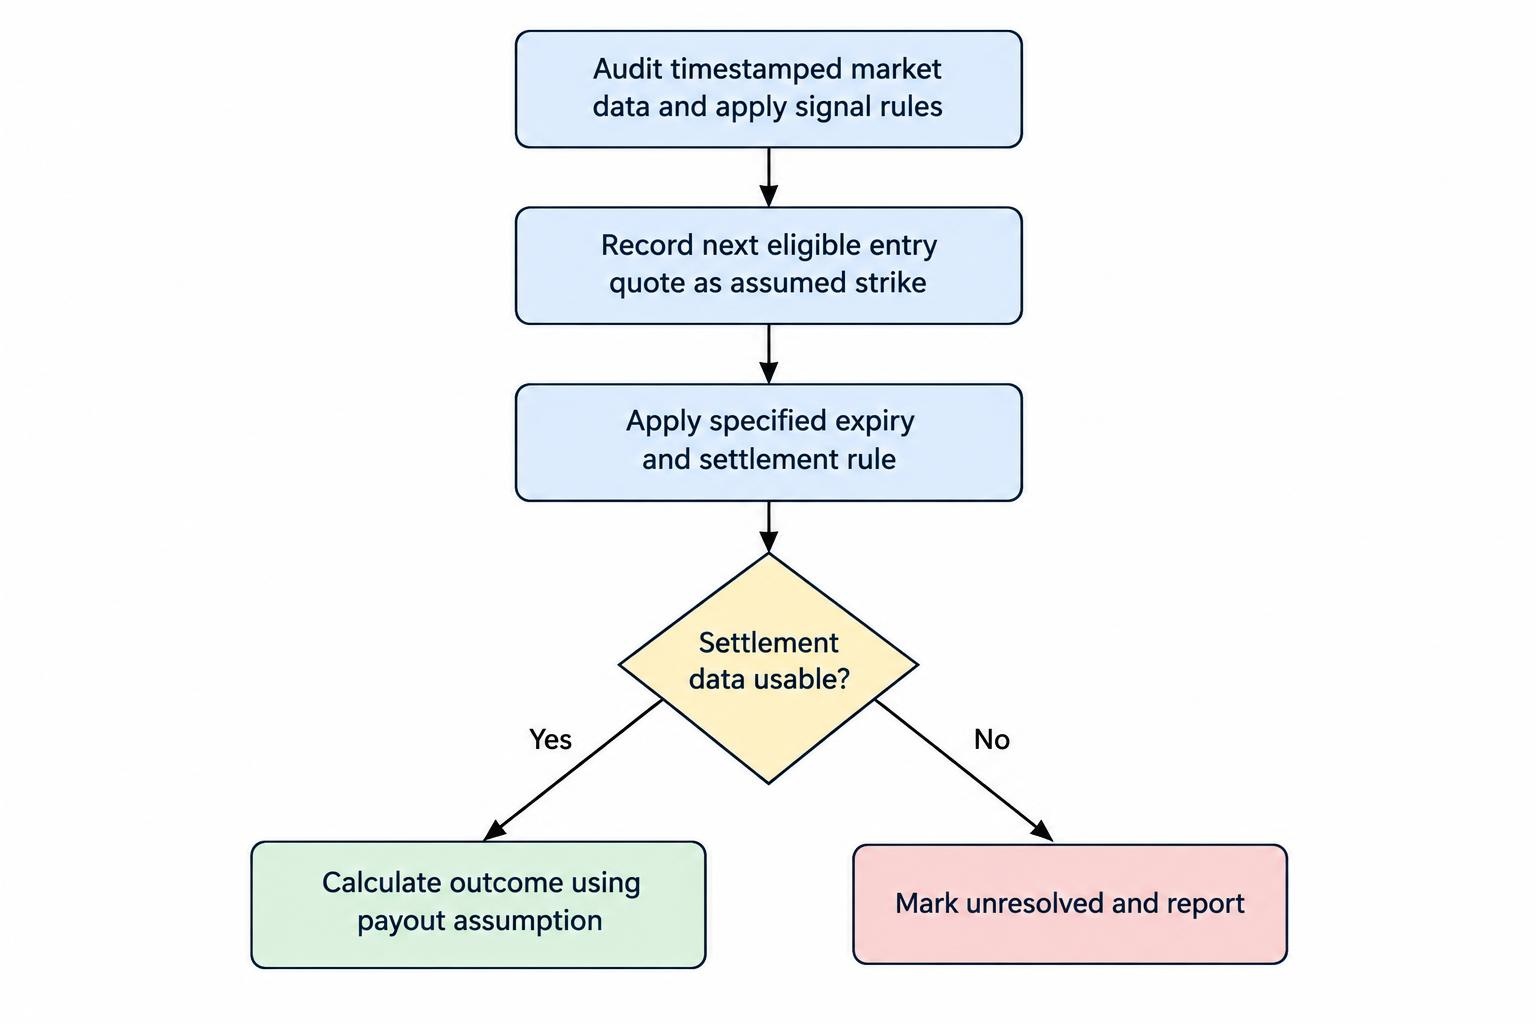
For an illustrative high-low test, the specification might require a completed five-minute candle to cross above a 20-period moving average. The simulation then records the next eligible entry quote, uses that quote as the assumed strike, and evaluates settlement five minutes after the simulated acceptance time. This describes a research model, not a recommended strategy.
Define whether expiry runs from acceptance or falls at a fixed clock time. Those arrangements produce different holding periods. Also decide whether another signal can create a position before the first contract expires, how equal settlement prices are treated, and what happens when no eligible quote is available.
If any of those details remain discretionary, the test is not finished being designed.
Choose Data That Can Answer the Question
The required data resolution follows from the contract. Five-minute candles cannot establish an exact settlement price 60 seconds after an entry made halfway through a candle. Tick data or sufficiently detailed timestamped quotes may be needed to reconstruct that event.
Even detailed data needs an identity. Record the instrument, provider, time zone and price type: bid, ask, midpoint, last trade or another benchmark. Check whether timestamps identify the opening or closing boundary of each bar. A five-minute mismatch can turn an otherwise careful test into a different experiment.
Distinguish an underlying-market study from a contract-level reconstruction. Historical exchange or forex data can test a directional hypothesis. It cannot establish what an unrelated platform would have quoted or used for settlement. Where that distinction matters, review price feeds and settlement benchmarks before interpreting the results.
Charting software also makes assumptions. TradingView’s historical broker emulator can infer price movement within a bar from its open, high, low and close rather than reconstruct every actual update. Its strategy documentation on historical execution assumptions makes that distinction explicit. A conventional strategy report therefore needs separate binary settlement accounting; profit from buying and selling the underlying is not binary options profit.
Audit missing periods and duplicated timestamps before running the strategy. Do not carry an old quote forward through a gap and treat it as a genuine settlement observation. Mark the contract unresolved, report the exclusion, and assess whether unresolved trades could change the result.
Remove Information That Was Not Available Yet
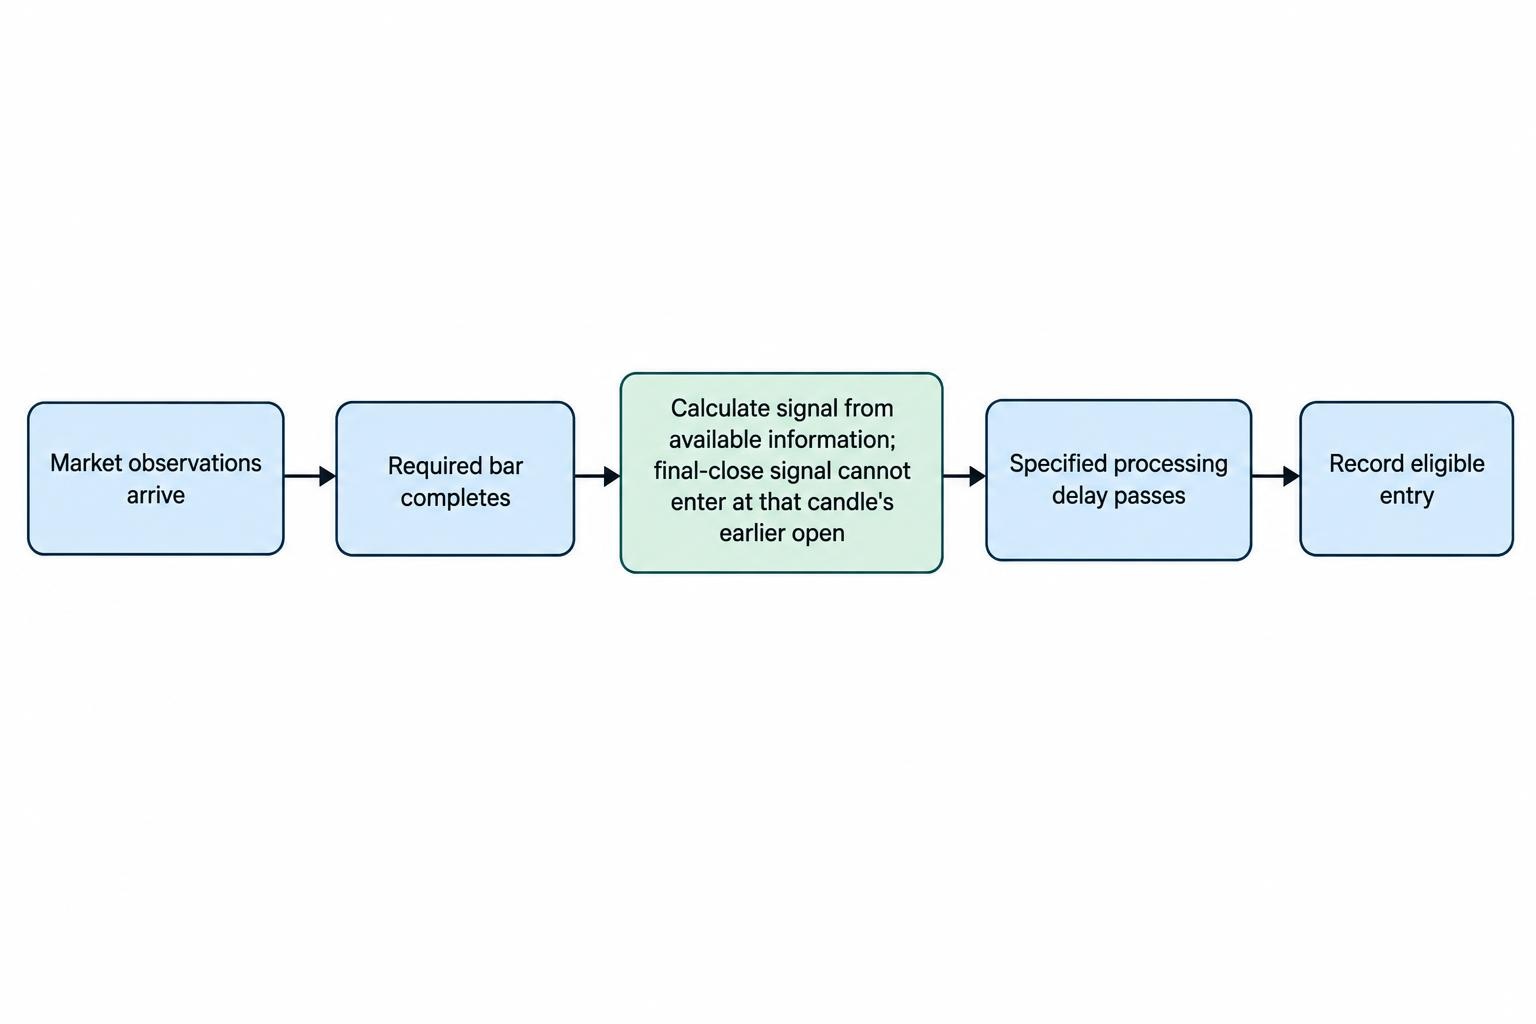
Look-ahead bias occurs when a simulated decision uses information that became available later. A common example is entering at a candle’s opening price using a signal calculated from that same candle’s final close. Another is using the completed hourly indicator value during the first few minutes of the hour.
Make the sequence explicit: observations arrive, the signal is calculated, any assumed processing delay passes, and an eligible contract is recorded. If the signal requires a completed candle, the model cannot treat that candle’s earlier prices as available entry opportunities.
Repainting creates a related problem. Historical signals may differ from what appeared while the market was updating, including when indicators use unconfirmed higher-timeframe values. TradingView’s documentation on repainting and future data leakage shows why a convincing historical chart may not reproduce the same signals in real time.
For manual testing, reveal the chart one bar at a time and record each decision before advancing. For automated testing, check selected signals against the inputs available at their timestamps. Both methods need an audit trail; automation only makes mistakes faster when the timing logic is wrong.
Calculate Returns Using Binary Payouts
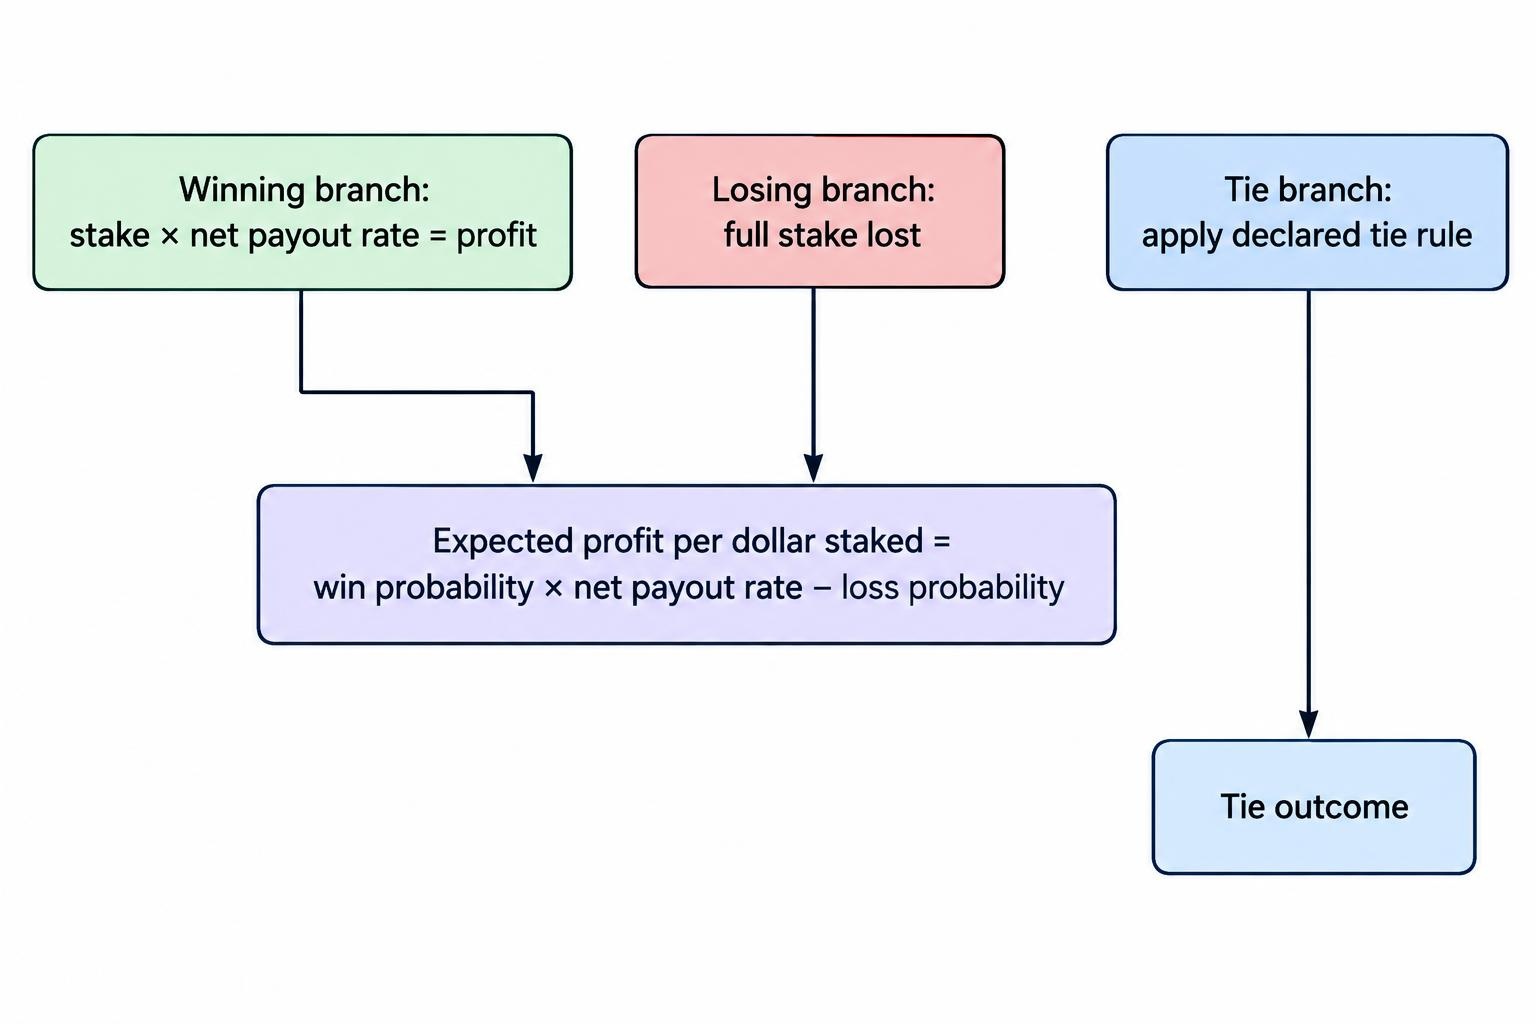
Win rate is an incomplete result. In a simplified contract that loses the entire stake when unsuccessful, an 80% net winning payout means a A$100 stake earns A$80 profit on a win and loses A$100 on a loss. The returned stake is not additional profit.
With no ties, refunds or other costs, expected profit per dollar staked is:
Expected profit = (win probability × net payout rate) − loss probability.
The corresponding break-even win rate is 1 ÷ (1 + net payout rate). At an 80% payout, that is approximately 55.56%. The probability and expected value guide covers the broader mathematics; the backtest must apply those economics to each simulated contract.
Consider a hypothetical sample of 1,000 trades, each staking A$100, with 560 wins and 440 losses. Holding the outcomes unchanged shows how much the assumed payout matters.
| Net payout on a win | Break-even win rate | Sample profit before other costs |
|---|---|---|
| 80% | 55.56% | A$800 |
| 75% | 57.14% | −A$2,000 |
| 70% | 58.82% | −A$4,800 |
These are arithmetic scenarios, not measured trading results. The 80% case earns just A$0.80 per trade before other costs. An assumed A$1 charge on every trade would turn its A$800 profit into a A$200 loss.
Where historical payouts are available, use the payout offered for each eligible contract. Otherwise, label the payout as an assumption and test several values. A price history with an assumed payout remains a conditional simulation, not a verified account history.
Account for ties separately. A refunded stake produces no trading profit, while a tie classified as a loss changes the result. Do not choose whichever treatment improves the backtest.
Separate Strategy Development From Evaluation
Trying many indicator settings and retaining the best result creates selection bias. The winner may fit historical noise rather than a repeatable pattern. Research in The Probability of Backtest Overfitting examines how repeated strategy trials can produce misleading historical performance, including why an ordinary holdout test does not account for every part of the selection process.
Keep a record of every material variant attempted: indicator periods, entry filters, trading sessions, expiry lengths and payout thresholds. Reporting only the final winner hides how much searching preceded it.
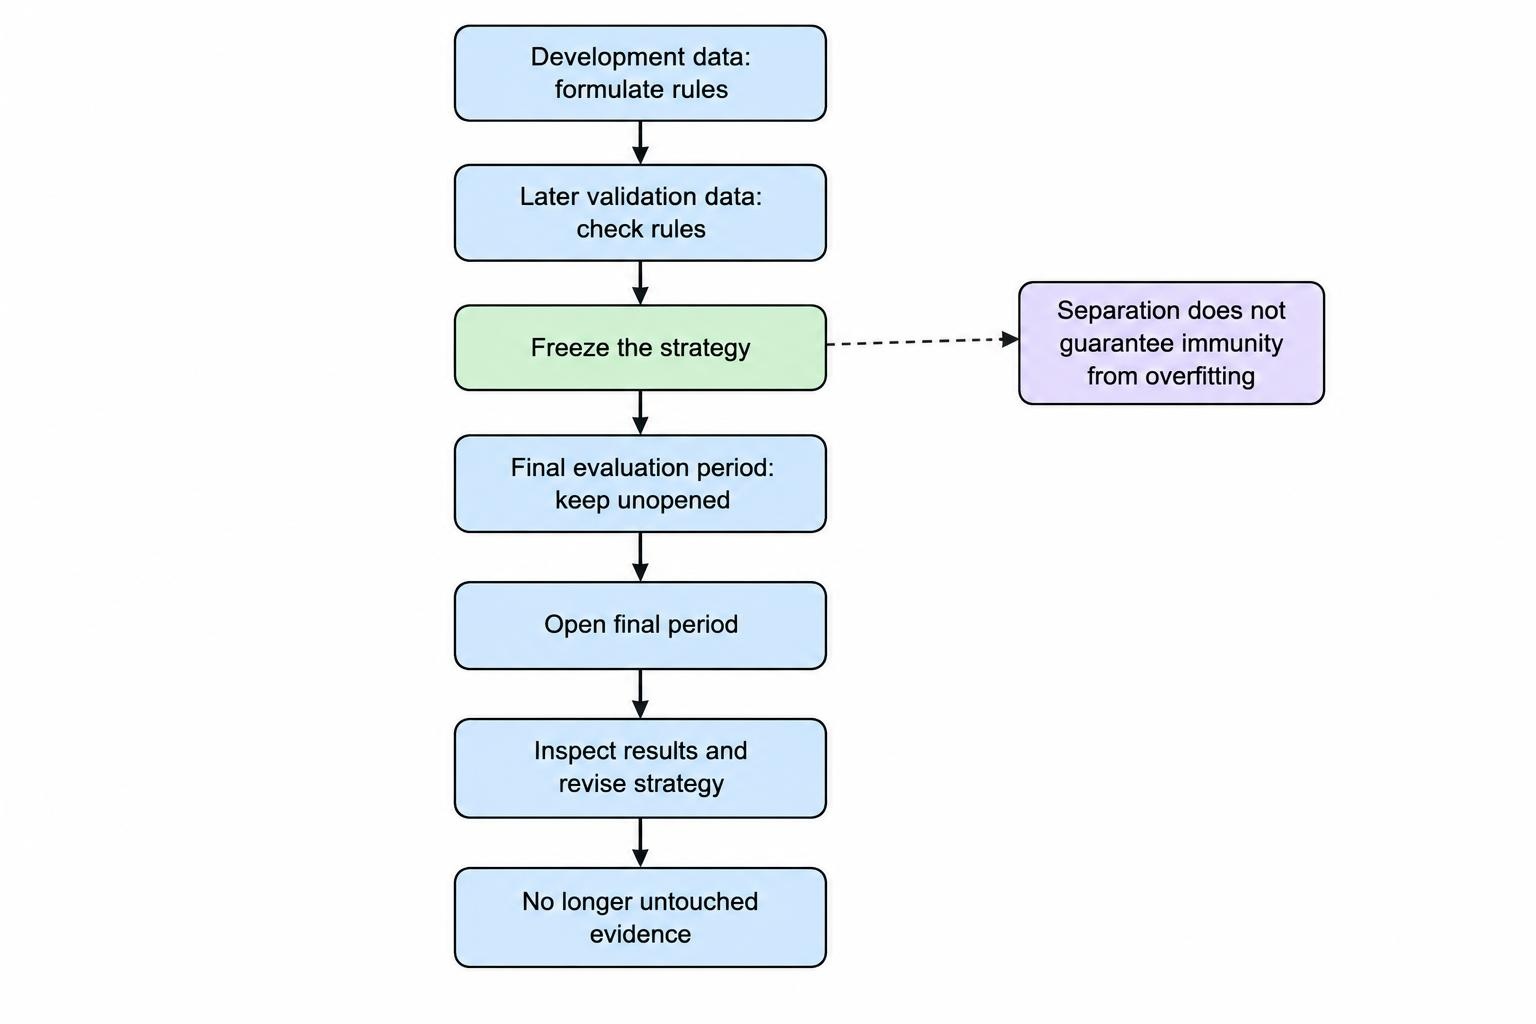
A practical starting structure is a chronological development period, a later validation period, and a final untouched evaluation period. Use development data to formulate the rules. Use validation data to check whether the approach deserves further investigation. Freeze the specification before opening the final period.
That separation is a discipline, not proof against overfitting. If the final period disappoints and you revise the strategy after inspecting it, that period is no longer untouched evidence.
Walk-forward testing can add another check. Select settings using an earlier window, evaluate them on the next window, then move forward and repeat the same procedure. Combine only the evaluation windows when reporting performance. Do not allow training outcomes that settle after an evaluation window begins to leak across the boundary.
Also inspect nearby settings. If a 20-period average appears profitable but 19 and 21 produce sharply different results, investigate the sensitivity. A narrow historical sweet spot needs more scrutiny than a pattern that survives modest changes.
Ask Whether the Sample Supports the Claim
There is no universal number of trades that makes a binary options backtest reliable. The required evidence depends on the size of the claimed advantage, outcome dependence, market coverage and how many variants were tried.
Using the hypothetical 560 wins from 1,000 trades, a calculated 95% Wilson confidence interval is approximately 52.9% to 59.0%, assuming independent outcomes with a stable win probability. That interval includes the 55.56% break-even threshold for an 80% payout. The calculation follows the NIST method for confidence intervals on proportions; it does not establish a profitable future strategy.
The assumptions deserve as much attention as the interval. Ten overlapping contracts opened during one price move should not automatically be treated as ten independent pieces of evidence. Nor does a long sample from one narrow market condition establish performance elsewhere.
Report the calendar coverage alongside the trade count. Examine separate periods and sessions, and keep genuinely untouched observations distinct from data used to choose the rules. Do not stop collecting results simply because the running win rate has reached a favourable number.
Stress the Assumptions and Measure Drawdown
Start with a fixed stake so that changing position sizes does not obscure the strategy’s contract-level results. Report net profit, profit per trade, return on total stakes, maximum drawdown and the longest losing sequence. Include the number of rejected, unresolved and excluded signals.
Drawdown measures the decline from a previous simulated equity peak. Preserve the original trade order when calculating it. A list of outcomes sorted into winners and losers cannot show the experience of following the rules through time.
If positions overlap, track committed stakes as well as realised results. Do not let the simulation open contracts using money already committed elsewhere. For fixed-stake tests, show whether the assumed starting balance could support the full sequence without additional funding.
Then rerun the model under declared adverse assumptions. Reduce payouts, delay entry, enforce a lower concurrency cap, and examine how uncertain settlement observations affect the result. For a quote-based strike, delayed acceptance should use the later eligible strike; it should not retain an earlier price that would no longer have been available.
Keep these stress tests separate from the base case. Their role is to show fragility, not manufacture a preferred outcome. If a small adjustment removes the entire apparent advantage, report that plainly.
Useful breakdowns include performance by month, session, direction and payout band. Treat patterns found during this inspection as new hypotheses. Removing an inconvenient month after seeing its losses is another strategy revision, not an objective cleaning step.
Keep a Reproducible Research Record
A backtest should be repeatable from its saved inputs and rules. Retain the original data alongside a dated strategy specification, and document every cleaning or exclusion decision.
The trade log should include:
- Signal time, simulated acceptance time and exact expiry timestamp.
- Direction, strike, settlement observation and price-feed identity.
- Stake, net payout, tie treatment and calculated profit or loss.
- Strategy version, data-quality flags and reasons for skipped signals.
Manually reconcile a selection of wins, losses, ties, overlapping entries and missing-data cases. Check that reported totals match the individual rows. Save unfavourable runs as well as successful ones; otherwise the research history becomes a highlight reel.
The next research stage is forward testing binary options strategies, recording signals as new data arrives without placing real-money contracts. This tests whether the frozen rules produce the expected decisions without hindsight.
A sound backtest can justify further investigation or reject a weak idea. It cannot establish lawful product access, confirm a provider’s payment behaviour or promise future returns. Its most useful result may be finding a flaw before any money is put at risk.
This article was last updated on: October 22, 2026