Mean reversion strategies look for prices that have moved away from a chosen average, then test whether they tend to move back toward it. In binary options, that idea has an extra hurdle: the movement must put the settlement price on the correct side of the strike at expiry. A rebound that arrives later does not rescue an expired contract.
Australian retail restriction: ASIC’s prohibition on issuing and distributing binary options to retail clients remains in force until 1 October 2031. The ASIC announcement extending the binary options ban sets out the restriction and the product risks behind it. The methods below are educational examples for historical analysis and paper trading, not a recommendation to fund an account.
What Mean Reversion Actually Predicts
A mean reversion hypothesis says that an unusually large deviation from a reference level may be followed by movement back toward that level. The reference might be a moving average, the centre of a trading range or another measure defined before the signal occurs.
That is not the same as saying every falling market must recover. Nor does an asset become cheap simply because it has fallen. New information can change the price buyers and sellers are willing to accept, leaving the old average behind.
There is research evidence for return reversal in particular settings. The Federal Reserve Bank of New York staff paper Decomposing Short-Term Return Reversal examines monthly stock return strategies and separates different drivers of reversal. Those findings do not establish an advantage for minute-long binary contracts. Applying results from one market and holding period to another requires fresh testing.
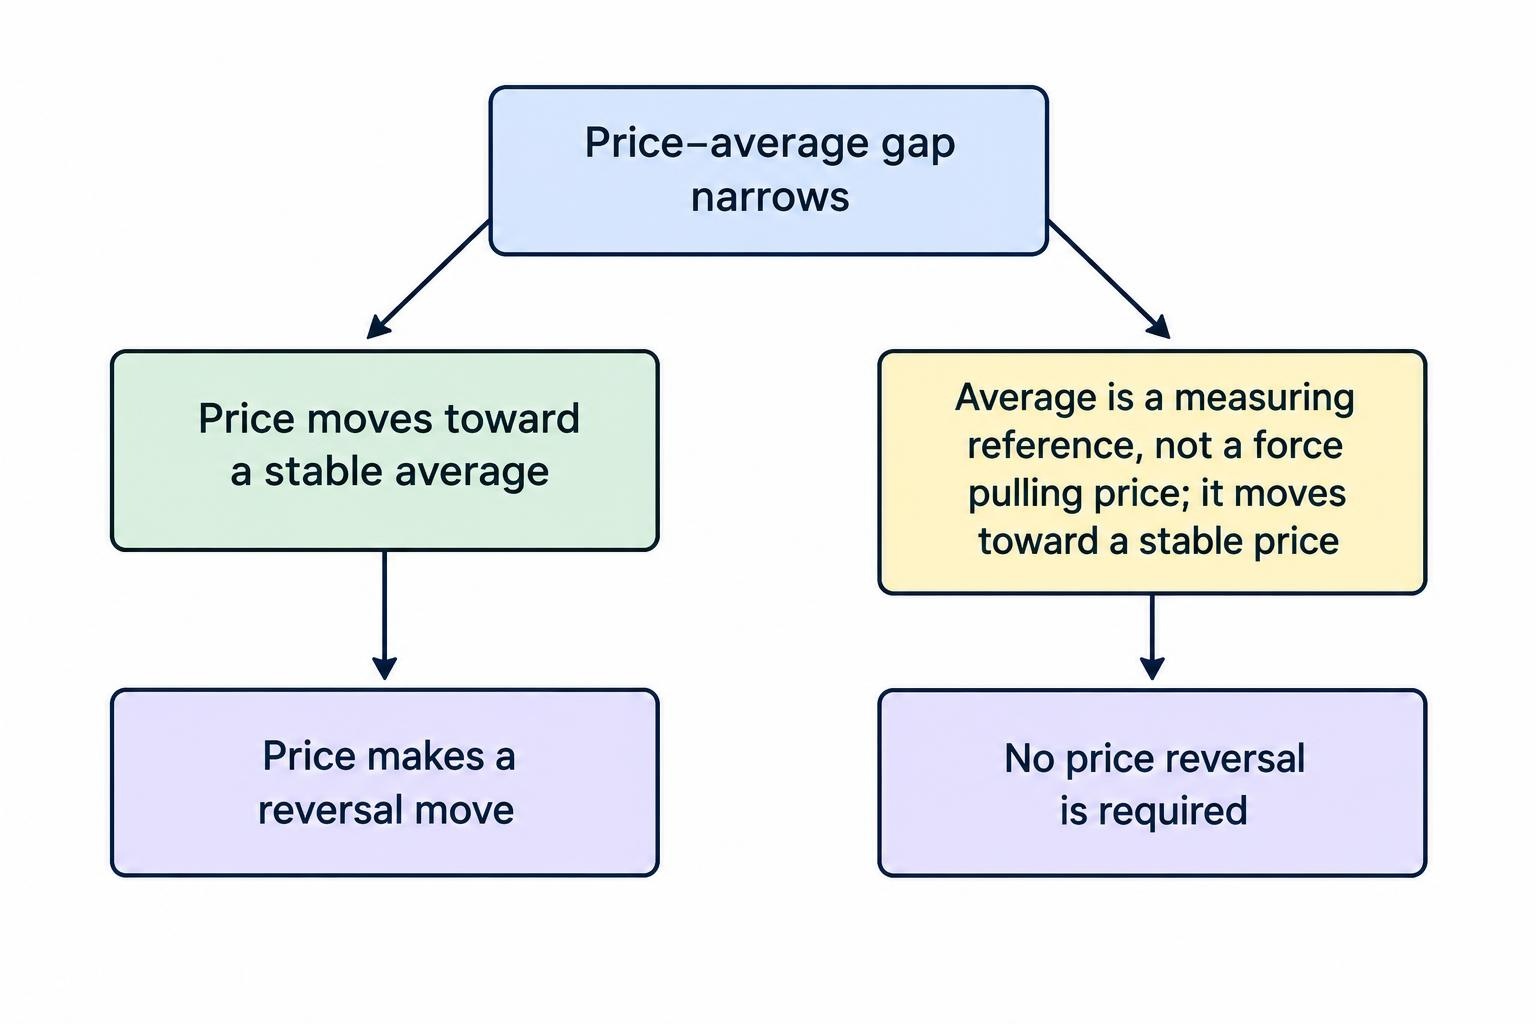
There is another distinction worth keeping: a gap can narrow because price returns to its average, or because the average moves toward price. Only the first necessarily supplies the directional movement a reversal trade needs. The average is a measuring tool, not a magnet.
Start With Market Conditions, Not an Indicator
A useful research question is whether the market has recently rejected price extremes or continued through them. A relatively flat reference average, repeated returns through the middle of a range and failed attempts to extend beyond its edges can help define a candidate environment for testing.
Use rules rather than impressions. “The chart looks sideways” is difficult to reproduce. “The chosen average has changed by less than a stated amount over the previous ten completed candles” is measurable. The threshold still needs testing; writing it down does not make it profitable.
Mean reversion and range trading strategies overlap, but they are not identical. Range trading centres on established boundaries. Mean reversion centres on distance from a reference, which may move over time.
Define conditions that suspend the hypothesis too. These might include an accelerating average, repeated closes beyond the same boundary or a scheduled announcement during the proposed holding period. For a paper test, exclusions must be known at the time. Removing every losing trade that happened near “unexpected volatility” after seeing the result is hindsight, not filtering.
Choose a Reference Mean You Can Reproduce
A simple moving average is an accessible starting point. A 20-period average on a five-minute chart uses 20 candles; the same setting on a one-hour chart represents a different time horizon. The number alone does not describe the strategy.
Record the price field, candle interval, lookback and calculation method. A test based on closing prices should not switch to candle lows whenever they produce a more attractive signal. Decide whether the reference updates throughout the observation period or remains fixed at its signal-time value for measuring the subsequent response.
Distance also needs context. A ten-point deviation may be unusual during a quiet session and ordinary during a fast one. Scaling distance by a recent volatility measure allows comparisons across conditions, although the measurement still cannot tell you whether the next move will reverse.
Three Mean Reversion Setups to Investigate
The following are rule templates, not tested recommendations. Each needs a defined market, data source, entry timestamp, strike, expiry and payout assumption before its results mean much.
1. Bollinger Band Re-entry
Bollinger Bands measure price relative to a moving average and bands based on recent standard deviation. Their familiar default uses 20 periods and bands two standard deviations from the average.
A band touch alone is not a reversal signal. Price can continue along an outer band during a trend. John Bollinger’s official rules explicitly distinguish band touches from buy or sell instructions and warn against treating closes outside the bands as automatic reversal signals.
A hypothetical re-entry rule could require a candle to close below the lower band, followed by a completed candle closing back inside it. The paper trade would then test an upward outcome from the next available entry price. Reverse those conditions for a downward hypothesis after an upper-band excursion.
Waiting for re-entry changes the trade-off. It avoids acting on the first touch, but it may leave less rebound available after entry. Test the confirmation rule against a simpler alternative rather than assuming that another condition improves results.
2. Distance From a Moving Average
This approach defines a stretch directly. One possible measurement is the difference between the latest close and the selected moving average, divided by the standard deviation of prices over a stated window.
Suppose a research rule flags a downward deviation greater than two standard deviations while the average remains relatively flat. A separate trigger might require the next completed candle to close above the previous candle’s close. The first condition identifies the stretch; the second defines when the paper entry becomes eligible.
The threshold is a research choice, not a probability statement. A reading of minus two does not establish a particular chance of recovery. Keep the calculation consistent and reject any setup where its denominator is zero or the price history is inadequate.
Test neighbouring thresholds as well. If a tiny adjustment turns an impressive result into a poor one, the apparent advantage deserves more scrutiny, not a larger stake.
3. RSI Recovery With a Price Condition
A third template uses Relative Strength Index signals to describe stretched recent momentum. An illustrative upward setup might require RSI to fall below 30, recover above 30 on a completed candle, and coincide with a predefined downward price deviation from the reference mean.
The reverse template might use a move above 70 followed by a return below it. These familiar thresholds are starting points for research, not universal instructions. An extreme reading can persist, and a recovery through a threshold does not establish the settlement direction.
RSI and moving-average distance both use price history. Their agreement is not two independent votes. Test whether the RSI condition improves the full sample after accounting for the trades it removes, including profitable ones. Extra filters can make a chart look tidier without improving its economics.
Match the Hypothesis to the Expiry
For a conventional position, a trader may have discretion over the exit. An expiry-settled high-low binary contract asks a narrower question: where is the settlement price relative to the strike at the stated time?
A strategy therefore needs a joint entry-and-expiry rule. “Enter after confirmation” is incomplete if the holding period is chosen afterwards. Define whether the test uses a fixed clock expiry or a duration measured from acceptance. The distinction matters when an entry occurs partway through a candle.
The guide to binary options expiry times covers those timing mechanics. For mean reversion research, measure how often price finishes beyond the actual entry strike at each preselected horizon, rather than how often it eventually touches the average.
Longer is not automatically better. More time may allow a reversal to develop, but it also permits other price movements before settlement. Selecting whichever expiry would have won each historical trade produces an answer that was unavailable at entry.
Worked Example: A Rebound That Still Loses
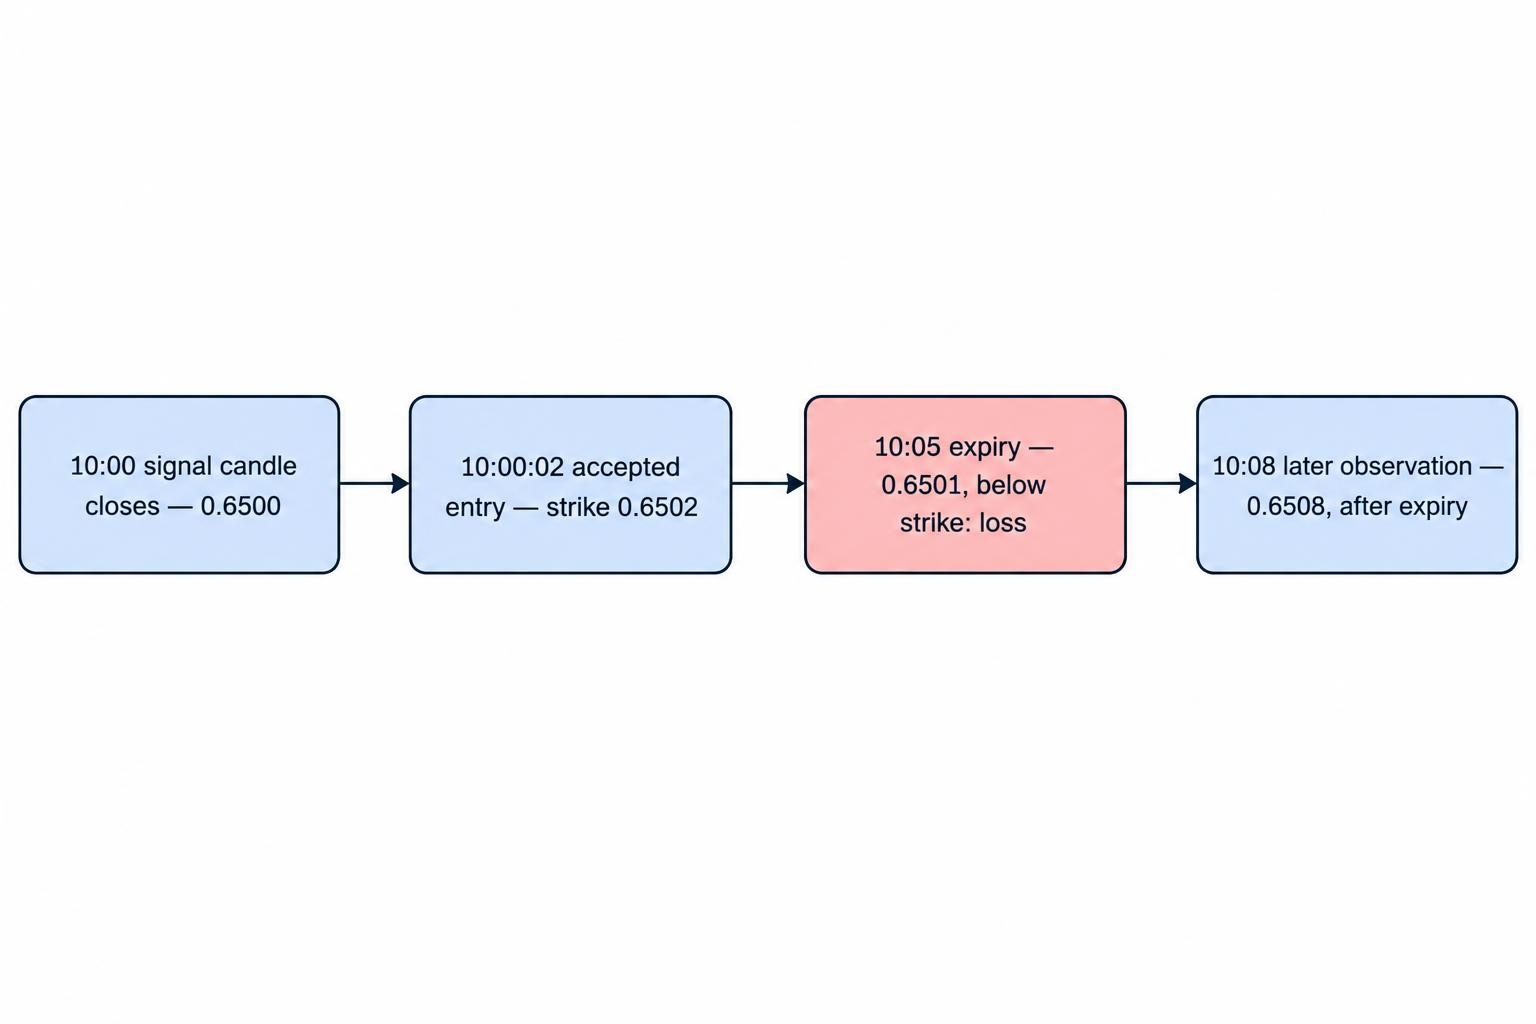
Consider a hypothetical AUD/USD paper trade. At the signal, the recorded moving average is 0.6510 and price has recovered from a lower-band excursion. Assume the contract wins only if settlement is strictly above its accepted strike, with no refund for a losing outcome.
| Event | Time | Price | Meaning |
|---|---|---|---|
| Confirmation candle closes | 10:00:00 | 0.6500 | The research rule produces an upward signal. |
| Hypothetical entry is accepted | 10:00:02 | 0.6502 | This becomes the contract’s strike. |
| Fixed clock expiry | 10:05:00 | 0.6501 | The contract loses because settlement is below the strike. |
| Later observation | 10:08:00 | 0.6508 | The recovery continues after the contract has expired. |
Price rose from the signal candle’s close and later moved closer to the recorded mean. Neither fact makes the contract a winner. Scoring this example from the signal close rather than the accepted strike would also change the apparent outcome. That small difference is exactly why entry assumptions belong in the test.
A High Win Rate Can Still Lose Money
A reversal pattern needs to clear the payout hurdle, not just win more often than it loses. Consider a simplified contract where a win returns the stake plus 80% net profit, while a loss forfeits the whole stake.
Break-even win rate = 1 ÷ (1 + net profit rate).
At an 80% net profit rate, the break-even win rate is approximately 55.56%, before other costs. Across 100 hypothetical trades with a $10 stake, 55 wins produce $440 profit while 45 losses cost $450. The result is a $10 loss despite winning most trades.
The calculation changes with fees, refunds, tie treatment and varying payouts. Evaluate each observation using the terms available at entry. The fuller probability and expected value framework helps separate a plausible chart pattern from a favourable payoff proposition.
Do not treat an observed win rate as the true future probability. A short run of results can sit above break-even by chance, and conditions that generated those observations may not persist.
Test the Rules Without Rewriting History
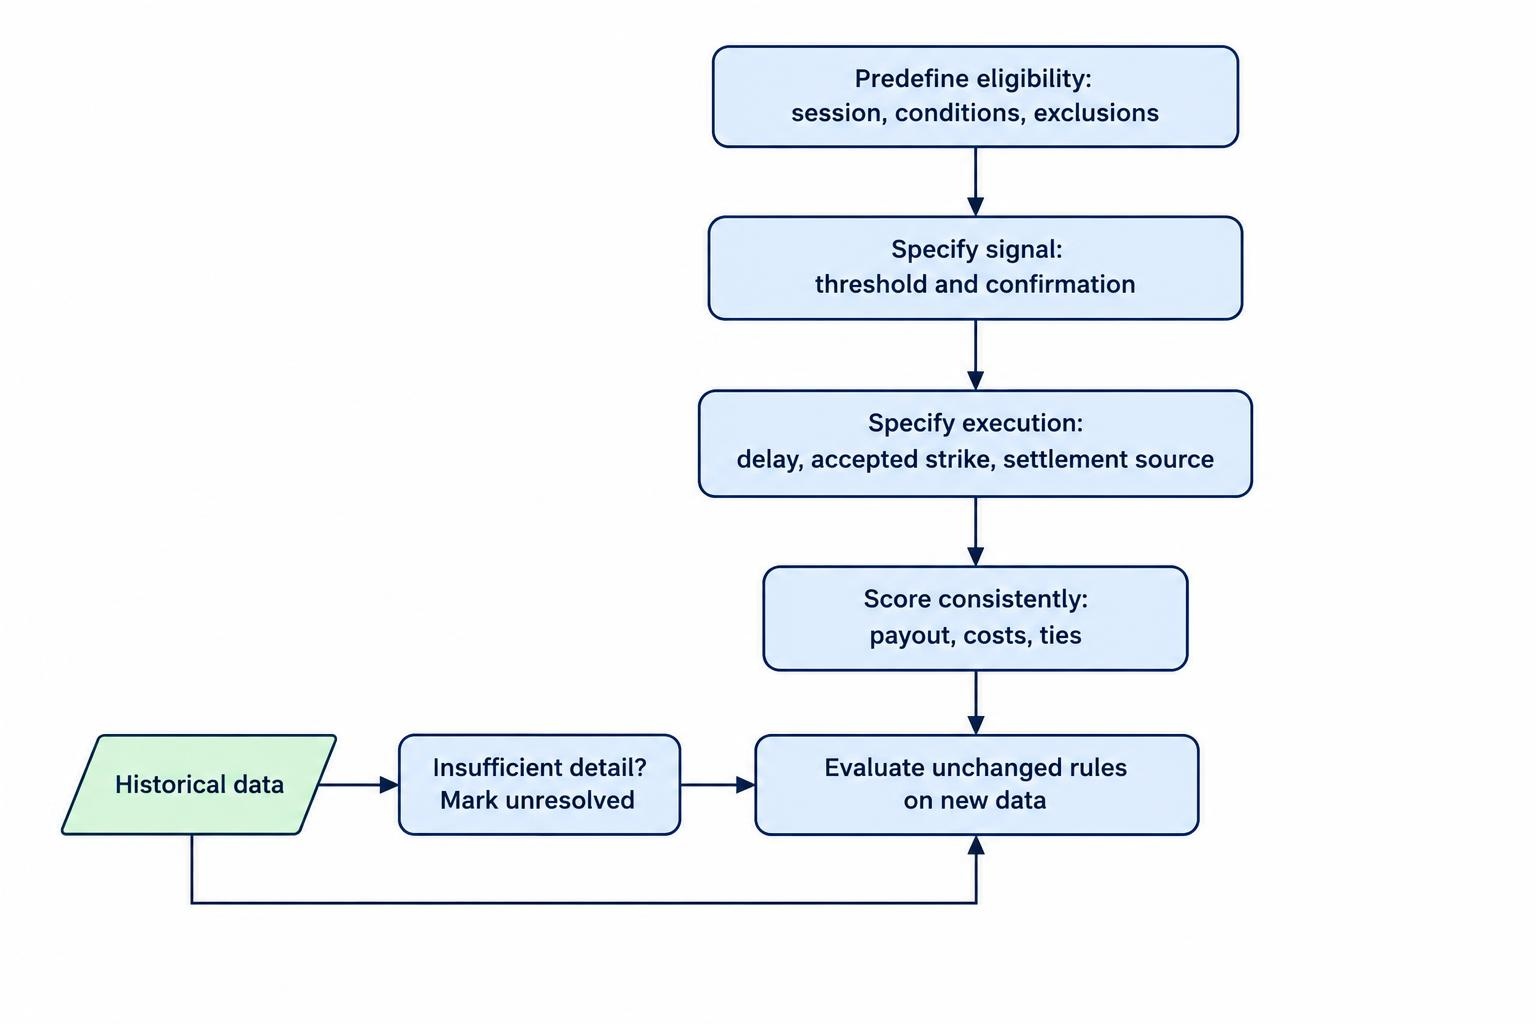
Begin with a written specification that another person could apply without asking what a “good-looking rejection” means. Keep the first version narrow enough to inspect: one market, one reference calculation, one trigger and one expiry rule.
- Define eligibility: set the session, market-condition filter and announcement exclusions.
- Define the signal: state the deviation threshold and confirmation using only available data.
- Define execution: record the assumed delay, accepted strike and settlement source.
- Define scoring: apply the payout, costs and tie rules consistently.
Historical candles may not contain enough detail to reconstruct the intended trade. A candle’s high and low show extremes, not the sequence of prices within it. If the rule depends on intrabar events or a precise settlement timestamp, use suitably detailed data or mark the result unresolved.
Keep a development period separate from later evaluation, and record every parameter variation tried. Repeatedly testing combinations increases the chance of selecting past noise. The research paper The Probability of Backtest Overfitting examines this problem, including why apparently strong historical selections can disappoint outside their development sample.
Follow a structured binary options backtesting process, then observe unchanged rules on new data without money at risk. Report performance by period and market condition, alongside trade count, payouts, losing streaks and drawdown. Several overlapping signals from one price move should not be presented as fully independent evidence.
Control Exposure and Check What the Test Cannot Prove
For paper comparisons, constant stakes make it easier to see whether the signal itself contributes anything. Increasing stakes after losses mixes the entry hypothesis with a separate staking system. It can also conceal how quickly cumulative exposure grows.
Mean reversion does not mean a losing trade makes the next trade “due.” Martingale staking in binary options addresses that escalation problem. A repeated loss may instead indicate that the same market condition is continuing to defeat the reversal rule.
Set a maximum number of simultaneous observations and a session exposure cap before testing. Multiple upward contracts on the same asset may all depend on one rebound; counting them separately does not spread the underlying risk.
Strategy analysis also cannot establish platform integrity. The joint SEC and CFTC investor alert on binary options fraud documents complaints involving software manipulation, including altered expiry countdowns. A favourable chart backtest does not address those operational risks.
A useful practice routine is deliberately plain: define one reversal hypothesis, record every eligible signal, apply the actual timing and payout assumptions, then review an untouched set of observations. Keep a chart’s eventual return toward its mean separate from the contract’s result. They answer different questions, and confusing them is an expensive way to be almost right.
This article was last updated on: October 22, 2026