Range trading strategies look for price reversals near the upper and lower edges of an established trading range. The basic idea is to favour upward moves near support and downward moves near resistance, rather than chase price through the middle. For binary options, that idea needs another condition: the reversal must put the contract on the correct side of its strike at settlement.
Australian retail restriction: ASIC’s prohibition on issuing and distributing binary options to retail clients took effect on 3 May 2021 and extends until 1 October 2031. The examples below are for education and paper testing, not instructions to access offshore platforms. See ASIC’s binary options prohibition announcement.
What a Range Trading Strategy Actually Predicts
A range strategy makes a conditional forecast: after price approaches a previously identified boundary, it may turn back into the range. It does not require price to travel all the way to the opposite boundary. Nor does it assume the range will survive indefinitely.
Consider a hypothetical AUD/USD range between 0.6600 and 0.6640. An upward reversal near 0.6600 could support a bullish paper entry. A downward reversal near 0.6640 could support a bearish one. At 0.6620, the same model has no boundary setup, so it does nothing.
Binary options add a timing problem. A standard directional contract settles against a stated price condition at a stated time; touching a favourable price earlier does not necessarily produce a winning settlement. This distinction follows the contract structure covered in the SEC and CFTC investor alert on binary options.
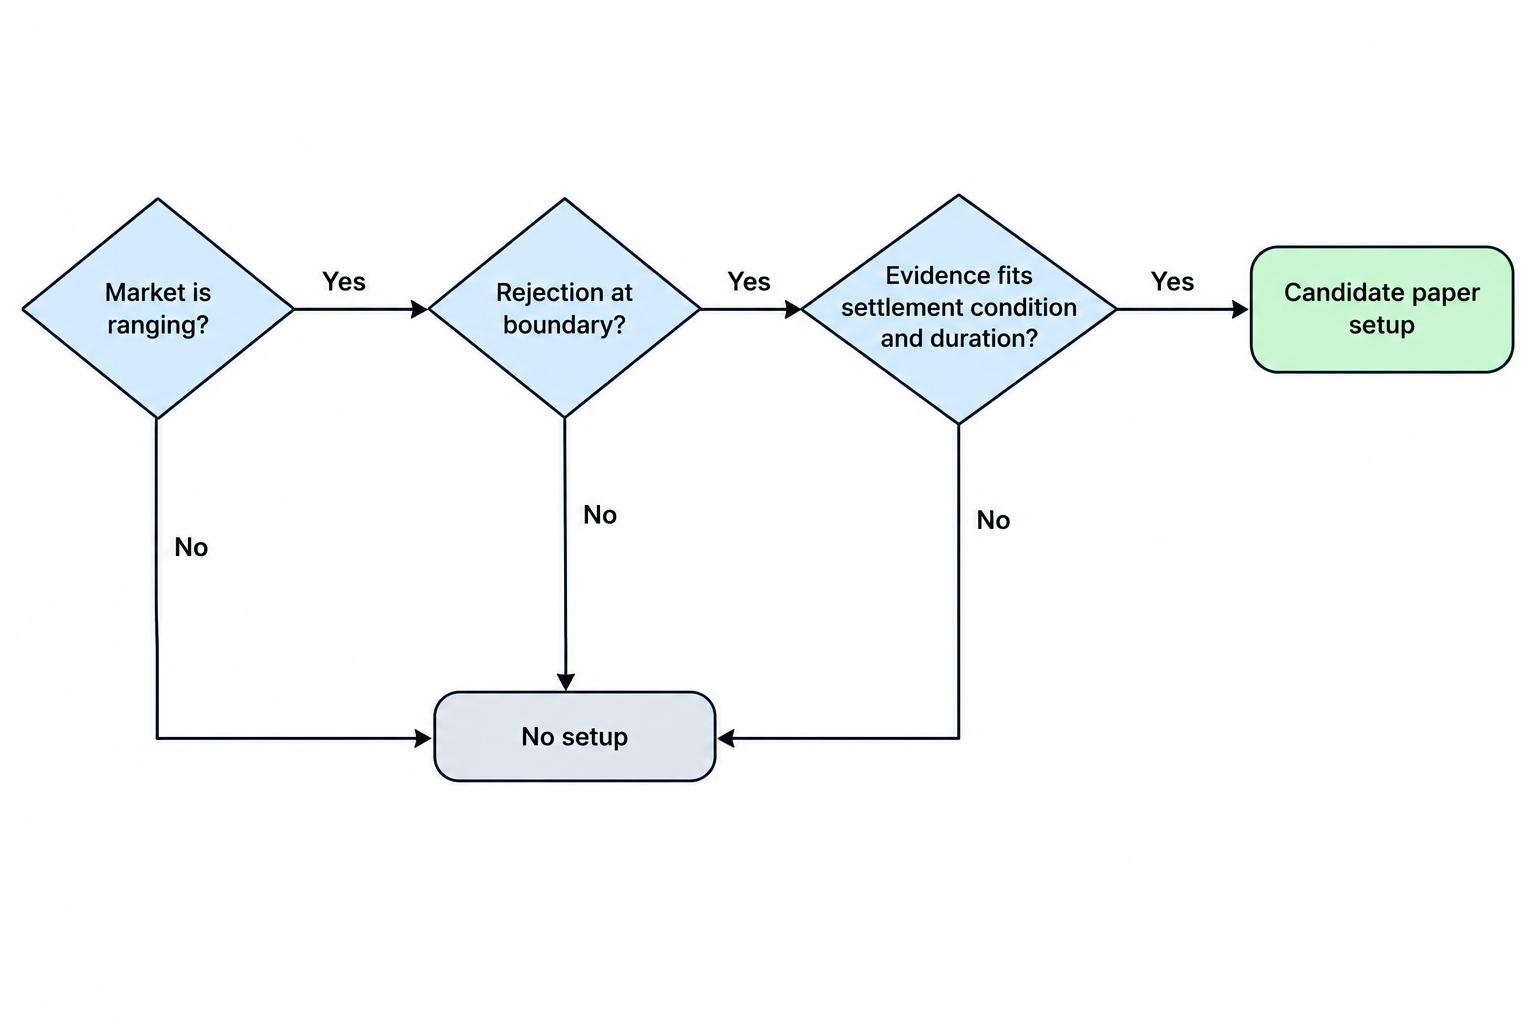
That leaves three separate questions. Is the market ranging? Is there evidence of rejection at the boundary? Does that evidence support the contract’s settlement condition over the chosen duration? A chart pattern answers none of these automatically.
How to Identify a Usable Trading Range
Mark Repeated Reactions, Not Convenient Lines
Start with visible turning areas that existed before the proposed entry. Look for price returning to broadly similar lows and highs, with movement between them. A single low and high define an observed price span, but they provide little evidence of repeated boundary behaviour.
Treat those boundaries as zones rather than exact prices. Several reversals around 0.6600–0.6604 can form a lower zone even if no two candle lows match. Previous highs and lows are common reference points, and support and resistance need not hold to the smallest price increment; CME Group’s support and resistance material covers both principles.
For a paper test, define a minimum formation rule. You might require two separate reactions near each boundary, with price moving away between visits. That is a testable starting condition, not a proven optimum. Five adjacent candles touching the same area should not automatically count as five independent tests.
Write down the zones before reviewing what happens next. Moving a boundary after every breach makes the chart look more orderly, but it also changes the strategy after seeing the answer.
Separate a Horizontal Range From a Drifting Market
A market can look sideways while its lows steadily rise toward resistance. Its highs might instead fall toward support. Those patterns differ from a roughly horizontal range: one side is advancing, even though the other boundary remains intact.
Rectangular consolidation and narrowing triangle patterns have different structures. CME Group’s material on consolidation patterns distinguishes consistent highs and lows from converging boundaries. Neither pattern guarantees its next direction.
For a horizontal range model, make progressive drift an exclusion rule. Also compare the range’s width with recent candle sizes. If ordinary candles repeatedly cover most of the box, a boundary rejection may be difficult to separate from routine movement. A tidy rectangle on a zoomed out chart can hide a rather untidy entry.
Two Range Entry Models to Paper Test
Boundary Rejection
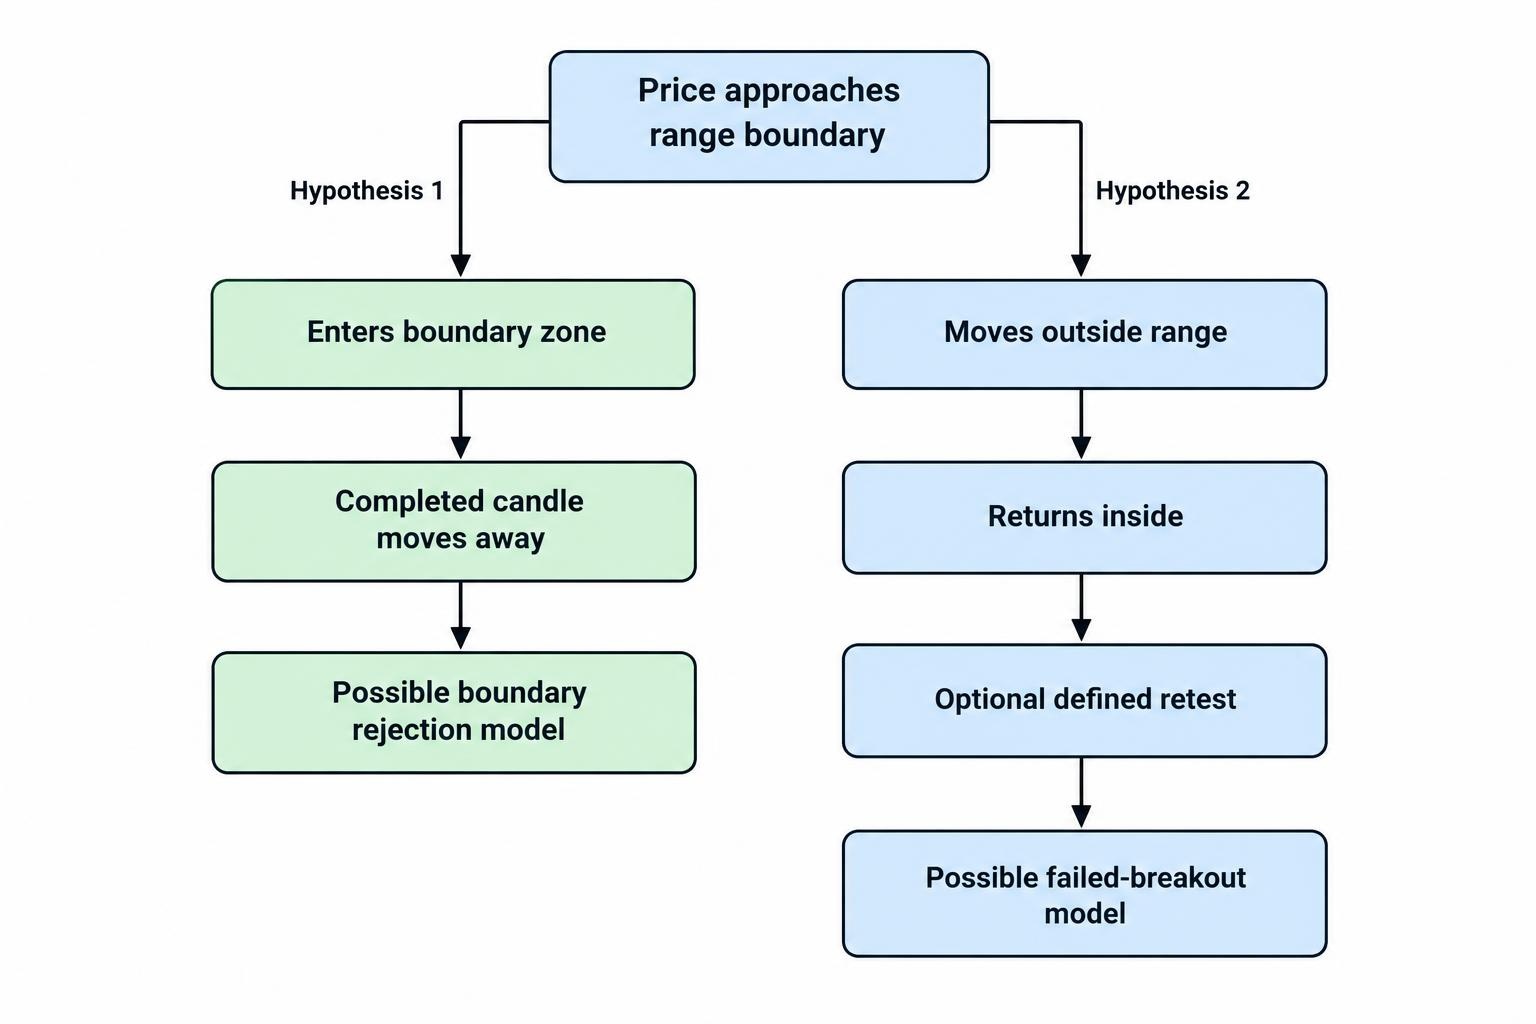
The simplest model waits for price to enter a boundary zone and then show movement away from it. At lower support, a test rule might require a completed candle that trades into the zone but closes above it. At upper resistance, use the opposite condition.
The completed candle matters because an unfinished candle can change shape before it closes. A brief upward move from support may disappear within the same bar. Waiting avoids treating that temporary shape as a confirmed signal, although it also means accepting a later entry.
Record the next available paper entry price rather than assuming entry at the candle’s low or high. If the confirmation candle has already carried price toward the midpoint, reject the entry under a predefined location rule. Otherwise, a strategy intended to act at the edge becomes a strategy that arrives halfway through the move.
Use one clear confirmation rule before adding more conditions. The support and resistance guide covers level selection in more detail; the range model should focus on what happens when price revisits those levels.
Failed Breakout and Return
A second model waits for price to move outside the range and then return inside. A hypothetical bearish setup could involve price trading above resistance, closing back below the zone, and failing to regain it on a later test.
This model asks a different question from the boundary rejection entry. It looks for evidence that an attempted escape has failed. However, a return inside the box is not proof that the breakout is finished. Price can cross the boundary again.
Keep the two models separate in your records. Define how far outside the zone price must move, what counts as a return, and whether a retest is required. Do not call every losing boundary entry a failed breakout after the event.
A sustained move outside the range belongs to a different hypothesis. The separate breakout trading strategies guide addresses that approach; switching between the two without written rules makes results difficult to interpret.
Use Indicators as Filters, Not Permission Slips
Indicators can make a range model easier to describe, but extra readings do not automatically improve it. Begin with the boundary behaviour, then decide whether one indicator answers a question the price rules leave open.
For example, average true range measures recent price movement rather than forecasting direction. A model could compare range width with ATR to reject boxes that are small relative to recent movement. The ATR and volatility guide covers that measurement.
Any cutoff would need testing. A rule such as “range width must exceed three times ATR” is a proposed filter, not an established source of profit. Record which timeframe supplies the ATR value and use only the value available before entry.
Test the price model without the filter first. Then compare it with the filtered version on separate observations. If the extra condition improves only the period used to select it, there is little reason to trust the improvement.
Match the Range Setup to the Contract and Expiry
A directional binary option near support asks whether settlement will finish above its strike. A range or boundary contract might instead ask whether price finishes between two levels, or whether a boundary is crossed during the contract. These are different propositions, even when they use the same chart.
Do not treat evidence of a short upward reversal as evidence that price will remain inside a box for an entire period. Equally, a brief excursion outside a chart range might be irrelevant to one contract but decisive for another. The written settlement condition controls the result.
Expiry must also be part of the strategy before testing begins. A five minute rejection candle does not establish that a one minute contract will win. Nor does it establish that the reversal will remain intact an hour later. The binary options expiry times guide explains the distinction between chart intervals and contract duration.
For research, choose a small set of candidate durations and evaluate them separately. Avoid trying dozens of expiries, keeping the best historical result, then presenting that selection as a general rule.
Record elapsed time from entry to settlement, too. A contract that expires on a fixed clock time may have a different remaining duration depending on when the entry occurs. “Three candles” is not a complete timing rule unless the entry and settlement conventions are also fixed.
A Worked Range Trading Example
Assume a hypothetical AUD/USD chart has lower support at 0.6600–0.6604 and upper resistance at 0.6636–0.6640. A completed five minute candle trades down to 0.6602 and closes at 0.6606. The paper model records an upward contract at a strike of 0.6606, settling 15 minutes later.
Use a notional A$20 stake and an 80% net winning return. A win earns A$16 profit and returns the stake. A loss forfeits A$20. For this example only, an exact tie refunds the stake. Fees are excluded.
| Settlement price | Chart interpretation | Contract result | Net result |
|---|---|---|---|
| 0.6614 | Price moves upward within the range | Win | +A$16 |
| 0.6605 | Support remains intact, but settlement is below the strike | Loss | −A$20 |
| 0.6606 | Settlement equals the strike | Refund under the assumed terms | A$0 |
| 0.6594 | Price settles below the lower support zone | Loss | −A$20 |
The second outcome is the useful warning. The chart’s support zone survives, yet the contract loses. The model needed settlement above 0.6606, not simply an intact range.
The reverse also matters: a small move above the strike produces the assumed winning return without reaching the midpoint. Distance travelled and contract profitability are not interchangeable.
Check the Payout Mathematics Before Judging the Strategy
A high proportion of correct forecasts is not enough on its own. Under the example’s terms, each win earns A$16 while each loss costs A$20. The wins must compensate for that imbalance.
The break even win probability is the amount lost divided by the combined winning profit and losing stake: A$20 ÷ (A$16 + A$20), or approximately 55.56%. This calculation assumes no ties, fees, rebates or changes in payout.
Across 100 hypothetical contracts, 50 wins and 50 losses would produce an A$200 loss. Even 56 wins against 44 losses would produce just A$16 profit before costs. That is a narrow margin, not much room for less favourable entries or a lower payout.
Evaluate results using the return available at each paper entry, rather than applying one attractive payout to every historical signal. The probability and expected value guide develops this calculation and its assumptions.
Also separate a profitable sample from a reliable estimate. A short run above break even can occur without a lasting advantage. Report the number of observations, the period covered and the result after costs rather than advertising the win rate alone.
Know When the Range Hypothesis Has Failed
The main danger is continuing to trade reversals after the market has stopped behaving like a range. A previous sequence of bounces does not oblige the next boundary visit to behave the same way.
Historical research on currency orders found that stop orders clustered around round numbers and could intensify trends once levels were crossed. The New York Fed research on currency orders and price behaviour offers a possible explanation for acceleration through familiar levels. It does not validate a current binary options strategy or supply its win probability.
For a paper model, define suspension conditions in advance. These might include:
- A completed candle closes beyond the outer boundary by a predefined amount.
- Price remains outside the range for the model’s chosen confirmation period.
- Recent highs or lows begin drifting consistently toward one boundary.
- A scheduled announcement falls inside the proposed contract period.
These are research rules, not guarantees against losses. Their value is consistency: they prevent the decision to stop from depending on whether the latest contract happened to win.
Set a notional session loss budget separately from the entry rules. Do not increase the next stake to recover a failed reversal. A larger stake changes the size of the outcome, not the quality of the forecast.
How to Test a Range Strategy Without Rewriting History
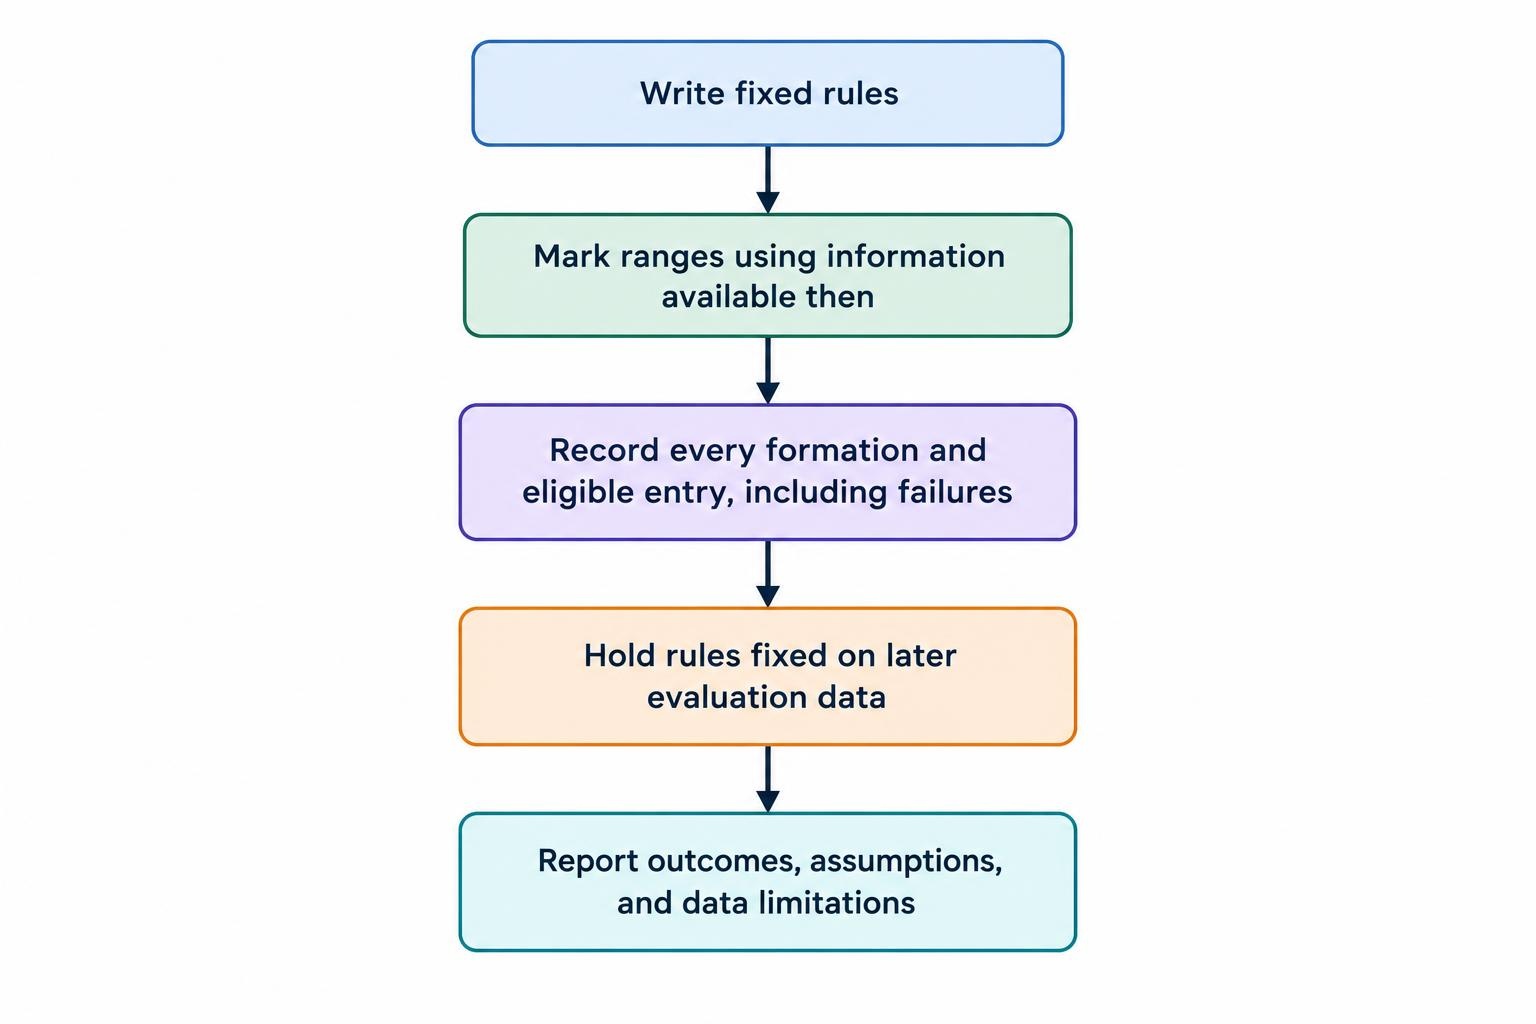
Start with a rule sheet another person could apply. It should identify the market, data feed, chart interval, boundary method, confirmation condition, entry timing, settlement duration and exclusion rules.
Mark ranges using only information available at that moment. A turning point that becomes obvious several candles later cannot be used immediately unless the model explicitly waits for those candles. Likewise, record the entry after confirmation rather than at an earlier, more favourable price.
Keep unsuccessful formations in the dataset. Deleting boxes that break before producing a winning signal creates a misleading picture of how the strategy behaves. A usable test includes ranges that fail, entries that arrive too late and sessions with no eligible setup.
Separate development data from evaluation data. Use the earlier portion to choose rules, then hold those rules fixed during the later portion. The binary options backtesting guide covers that process beyond the range model itself.
Inspect results by session and market period, not only as one combined total. Several entries during one range episode share the same market conditions, so the contract count alone can overstate how broadly the rules have been tested.
Finally, distinguish a chart simulation from a contract test. If historical settlement prices, entry acceptance or payouts are unavailable, label the result as a chart signal study. Do not present assumed execution as observed trading performance.
A Practical Range Trading Standard
A defensible range strategy needs more than two horizontal lines. It needs a repeatable way to identify the range, a clear entry condition, an expiry rule, payout mathematics and a point at which the model stops participating.
Use a trading journal to preserve those decisions before the outcome is known. Record rejected setups as well as accepted ones; both help reveal whether the rules are being followed.
The useful question is not whether a chart can be made to show repeated bounces. It is whether fixed rules identify those opportunities in advance and produce favourable results under realistic contract assumptions. Until that is demonstrated, a range setup remains a hypothesis for paper research, not evidence of a profitable method.
This article was last updated on: October 22, 2026