Moving averages smooth a price chart by turning a sequence of prices into an average that updates with each new observation. They help separate the direction of recent trading from the smaller fluctuations around it. For binary options analysis, their most useful role is to describe market conditions, not to predict where a contract will settle.
The distinction matters. Price can sit above a rising moving average and still finish below a binary option’s strike at expiry. Reading the trend correctly does not automatically mean reading the contract correctly.
Australian restriction: The issue and distribution of binary options to retail clients is banned in Australia until 1 October 2031 under ASIC’s extended binary options product intervention order. The examples below are for education and paper testing, not instructions for bypassing that restriction.
How Moving Averages Are Calculated
A moving average needs a price input, a calculation method and a period length. Closing prices are a straightforward input, although charting software may offer opening prices, highs, lows or combinations of them. Changing the input changes the indicator, even when its name and period remain the same.
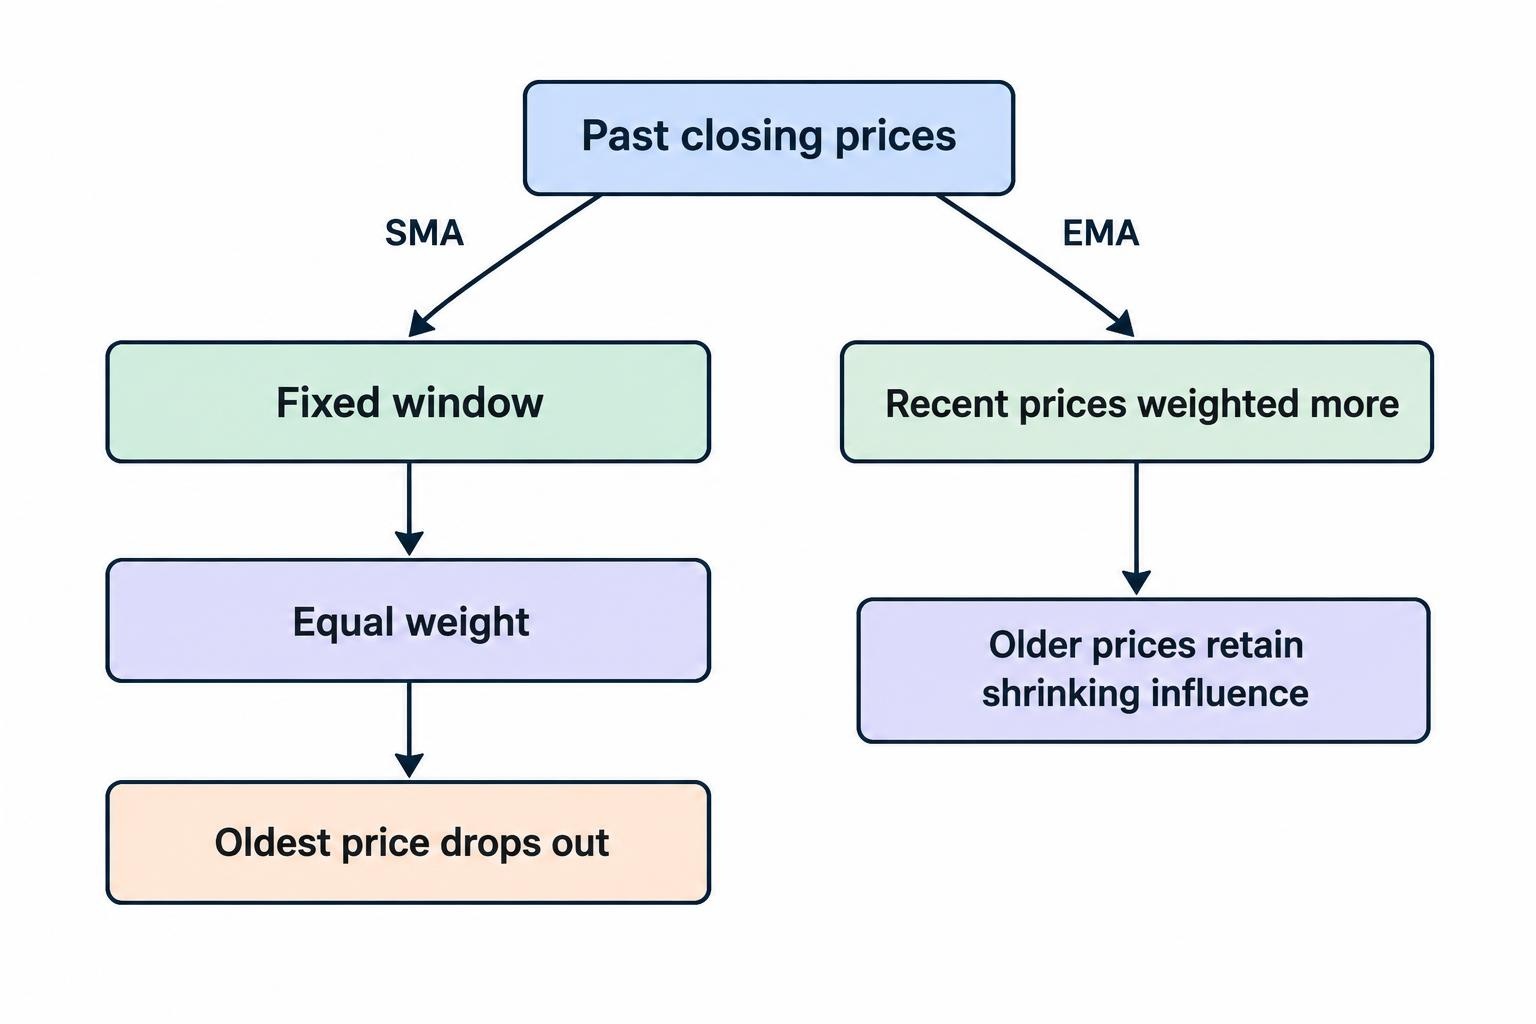
Simple Moving Average: Equal Weight for Each Observation
A simple moving average, or SMA, adds the prices in its calculation window and divides the total by the number of observations.
SMA = Sum of the selected prices ÷ Number of observations
Suppose five consecutive closing prices are 100, 102, 101, 103 and 104. Their total is 510, so the five-period SMA is 102. If the next close is 105, the oldest price, 100, drops out. The new average becomes 103.
Each observation carries equal weight while it remains in the window. That also means an SMA can change because an old price leaves, not just because the latest price moves sharply.
Check the calculation settings before comparing charts. Length, price source and any display offset can affect what appears on screen. TradingView’s SMA calculation and input documentation identifies these settings. For a basic study, use closing prices and zero offset so the line stays aligned with the observations used to calculate it.
Exponential Moving Average: More Weight on Recent Prices
An exponential moving average, or EMA, gives greater weight to recent prices. Its standard smoothing factor is:
Smoothing factor = 2 ÷ (Period length + 1)
The updated value is calculated as:
New EMA = Previous EMA + Smoothing factor × (Latest price − Previous EMA)
For a nine-period EMA, the smoothing factor is 0.2. If the previous EMA is 100 and the latest close is 102, the updated EMA is 100.4.
An EMA also needs a starting value. Different initialization methods can produce differences near the beginning of a dataset, so allow enough earlier observations before evaluating signals. CME Group’s moving average calculation lesson covers both the weighting formula and the starting-value choice.
SMA or EMA?
| Feature | SMA | EMA |
|---|---|---|
| Weighting | Equal weight within a fixed window | Greater weight on recent observations |
| Older prices | Drop out when they leave the window | Retain a progressively smaller influence |
| Useful comparison | A transparent rolling average | An average that responds more strongly to recent changes |
Neither calculation contains information about future prices. Choosing an EMA instead of an SMA changes how past prices are weighted; it does not turn the line into a probability forecast.
Period Length Is Not the Same as Contract Expiry
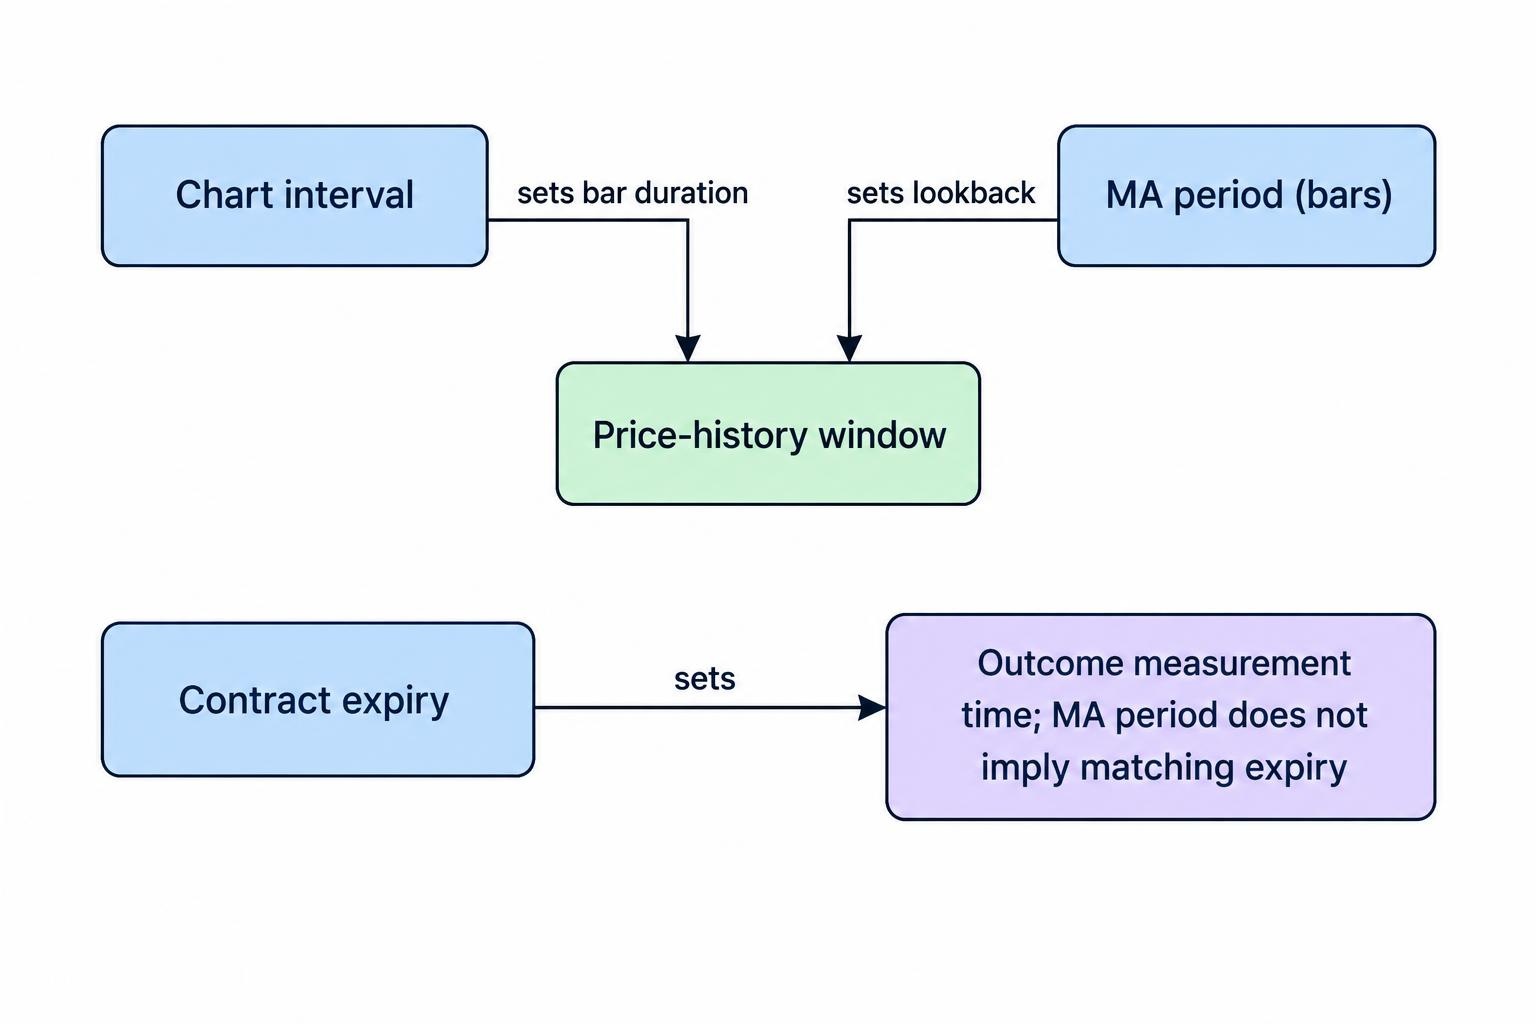
A moving average period usually counts chart bars, not minutes. A 20-period SMA on a one-minute chart uses 20 closing prices. The same setting on a five-minute chart uses 20 five-minute closes.
With uninterrupted bars, those windows cover roughly 20 minutes and 100 minutes respectively. Market closures or missing bars can make the elapsed clock time longer. An EMA needs another qualification: older observations continue to influence it beyond the named period, although their weight keeps shrinking.
Contract expiry is a separate choice. A 20-period average does not imply a 20-minute contract, and a crossover on a five-minute chart does not establish that price will remain on the same side of a strike five minutes later. The binary options expiry times guide covers that distinction in more detail.
For paper testing, record the chart interval, average type, average length and expiry separately. “Nine-period EMA strategy” is not a complete rule. It leaves unanswered which market, which chart interval, what triggers an observation and when the outcome is measured.
Pairs such as 9/21 or 20/50 can serve as research candidates. They should not be treated as validated settings simply because they produce an attractive historical chart.
What Moving Average Signals Actually Show
Three readings are worth separating: the average’s slope, price relative to the average, and one average relative to another. They answer different questions.
Slope and Price Position
A rising average shows that its calculated value is increasing. Price above that average means the current price exceeds the weighted or unweighted reference value. Neither statement, by itself, tells you how far the next price movement will travel.
Consider a price of 100.50 above an average of 100.00. Price could fall to 100.20 and remain above the line. A chart might still look broadly positive, yet a higher contract struck at 100.50 would lose if it settled at 100.20.
Price Crossovers and Average Crossovers
A price crossover occurs when price moves from one side of an average to the other. A moving average crossover occurs when a shorter average crosses a longer one. The latter compares two summaries of the same price history rather than price against one summary.
Both are reactive signals. A shorter average crossing above a longer average is conventionally read as bullish, but the price movement needed to create the cross has already occurred. TradingView’s moving average reference covers these interpretations and the lag built into them.
Define crossovers precisely when testing. One possible bullish rule requires the fast average to be at or below the slow average on the previous completed bar, then above it on the latest completed bar. That is more reproducible than marking whichever crossing looks persuasive afterward.
A signal based on a completed candle also differs from one observed during a live candle. If your rule requires the close, do not count a temporary crossing that disappears before that close.
Using an Average as a Trend Filter
A practical research approach is to use the moving average as a filter rather than an automatic entry instruction. The filter classifies conditions; a separate rule defines the event being tested.
For example, a paper study might classify conditions as upward only when price is above a rising 50-period average. It could then examine what happens after a defined pullback. The average supplies context, while the pullback rule supplies the observation point.
This separation helps identify what each rule contributes. Compare the pullback observations with and without the filter. If the filter removes many observations but does not improve results on later, unused data, the extra condition has not demonstrated a benefit.
Do not assume the average must act as a floor or ceiling. A touch of the line is a location, not proof that buyers or sellers will defend it. Any proposed reaction should be assessed alongside price structure and nearby support and resistance levels, rather than treating the average as a barrier price cannot cross.
Worked Example: A Bullish Chart Can Still Produce a Losing Contract
The following prices are hypothetical.
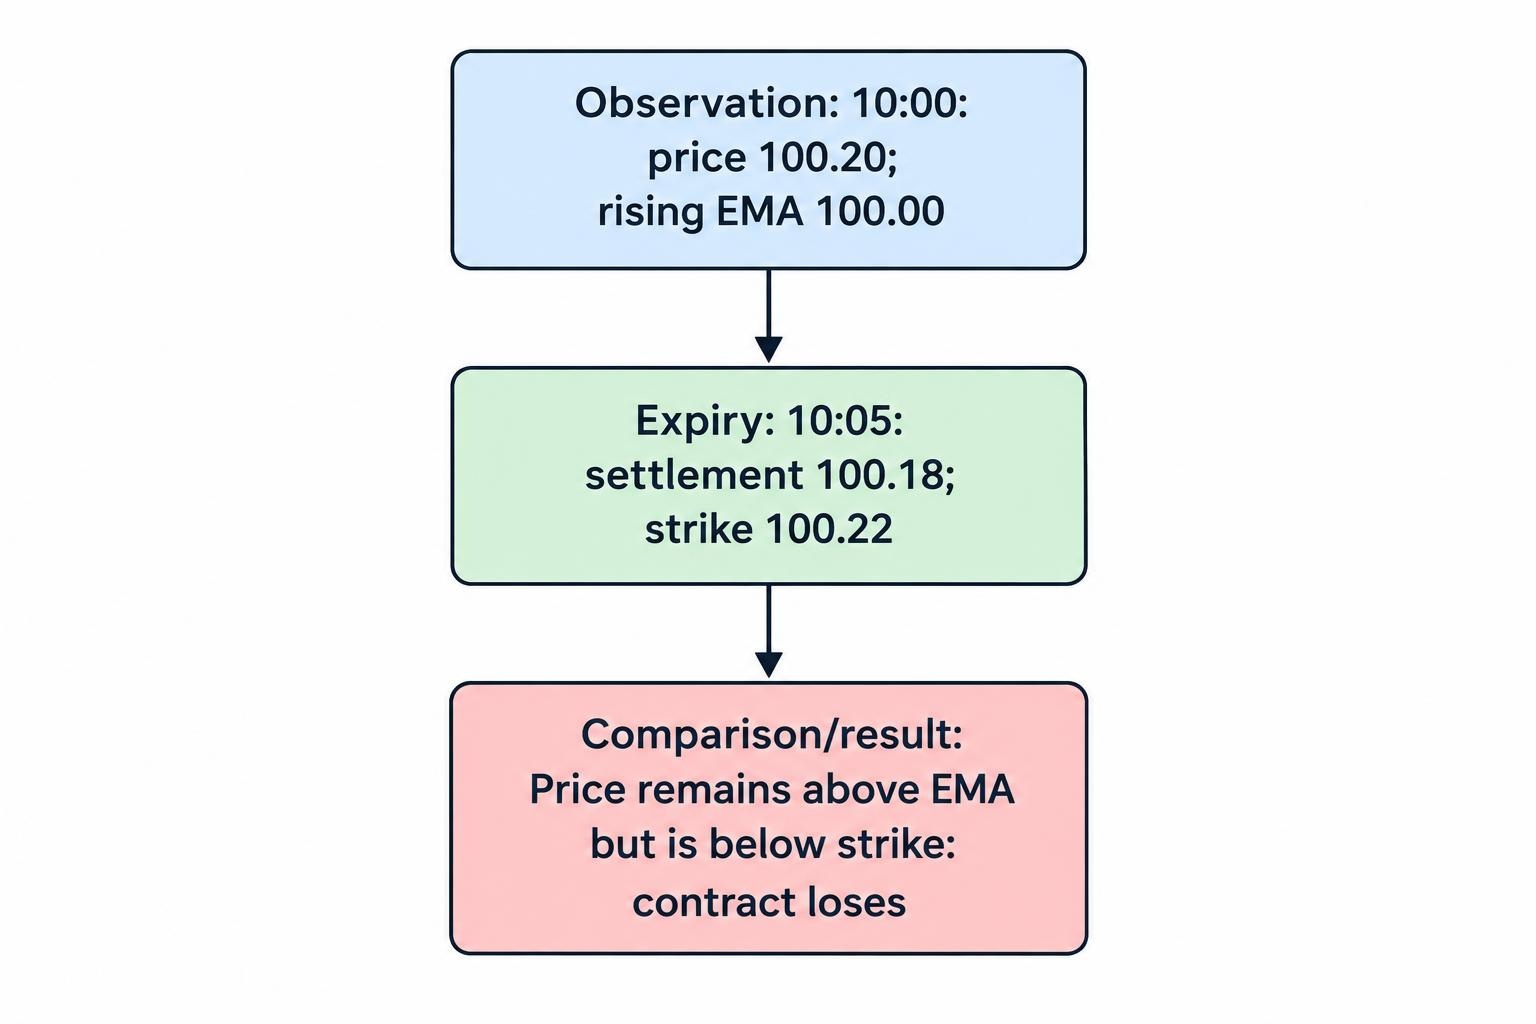
At 10:00, a five-minute candle closes at 100.20, above a rising 20-period EMA of 100.00. A paper record made immediately afterward shows a higher contract with a strike of 100.22 and an expiry of 10:05.
At expiry, the settlement price is 100.18. Price remains above the EMA, but it is below the strike. Under terms requiring settlement strictly above the strike, the contract loses.
At 10:15, price reaches 100.40. That later rise does not change the earlier result. The bullish interpretation and the losing contract are not contradictory: one described the chart, while the other depended on a price threshold at a deadline.
This is why screenshots of successful crossovers are weak evidence. A useful record needs the observation time, available quote, accepted strike, expiry, settlement price and payout terms. Without those details, it cannot show whether the apparent signal would have produced a winning contract.
Win Rate Must Be Read Alongside Payout
Even an accurately recorded moving average signal is not enough to assess profitability. The amount gained on a winning contract must be compared with the amount lost on a losing one. The SEC’s binary options risk guidance illustrates how unequal gains and losses can produce negative expected returns despite an assumed equal chance of either outcome.
Consider a hypothetical fixed stake contract that returns the stake plus an 80% profit when it wins, but loses the entire stake when it loses. Ignoring fees, ties and refunds, the break-even win rate is:
Break-even win rate = 1 ÷ (1 + 0.80) = 55.56%
With a $100 stake, 55 wins produce $4,400 in profit. The other 45 contracts lose $4,500, leaving a $100 loss across 100 observations.
A moving average rule therefore needs more than a win rate above 50% under these assumptions. It needs results that exceed the payout-adjusted threshold, with enough evidence to distinguish a repeatable effect from a favourable sample. The broader calculations belong in probability and expected value in binary options.
How to Paper Test a Moving Average Rule
Begin with a written rule that another person could apply without asking what you meant. “Buy when the lines look bullish” leaves too much room for hindsight.
A compact research specification should record:
- The instrument, price feed, chart interval and session.
- The average type, length, price input and starting-data allowance.
- The exact signal condition and whether it requires a completed candle.
- The observation time, strike, expiry, payout and treatment of ties.
- The observations excluded under rules written before testing begins.
Keep the initial study narrow. Testing every combination of fast average, slow average, market and expiry creates plenty of opportunities to find an attractive historical result. That result becomes less persuasive if it was selected from hundreds of alternatives.
Separate rule development from evaluation. Use one chronological segment to formulate the rule, then assess it on later data without changing the settings. The guide to backtesting binary options strategies covers the broader testing process; the moving average task is to keep the indicator definition and signal timing consistent.
Check what was knowable at the observation time. A rule triggered by a candle’s final close cannot also assume access to an earlier price within that candle. Likewise, a higher-timeframe filter should use only information available at that moment, not the final value of a candle that had not finished.
Compare a small number of nearby settings without repeatedly selecting the best performer. If a 20-period rule looks strong but 19 and 21 produce very different outcomes, investigate why before treating 20 as a meaningful discovery.
Record losses and rejected signals as carefully as wins. A useful study explains where the rule fails, not just where the chart makes it look clever.
Keep the Indicator’s Job Narrow
Moving averages provide a consistent way to summarize past prices. They can classify trend conditions, define repeatable crossover events and give a paper study a reference line.
They do not establish the probability of finishing beyond a strike, select the correct expiry or remove the effect of an unfavourable payout. Keep those questions separate within a wider technical analysis framework. The useful question is not whether a moving average looks convincing, but whether a clearly defined rule adds value when tested without hindsight.
This article was last updated on: October 22, 2026