Binary options research should test claims, not repeat them. A useful report shows where its data came from, what the figures measure and which assumptions could change the result. A winning percentage without payouts, timestamps or a complete trade record tells only part of the story.
For Australian readers, the regulatory position comes first. ASIC’s ban on issuing and distributing binary options to retail clients took effect on 3 May 2021 and has been extended until 1 October 2031. Historical trading results do not change that restriction. See the ASIC announcement extending the binary options ban.
This research hub separates published regulatory findings, payout calculations and methods for assessing performance claims. The numerical examples below are hypothetical. They are not findings from platform testing, customer account access or an independent trading audit.
What Binary Options Research Can Establish
Different evidence answers different questions. Regulatory account data can show how a defined group of customers performed during a stated period. Contract mathematics can establish the winning percentage needed to cover losses. A timestamped signal record can show whether a prediction existed before its outcome became known.
None of those findings automatically answers the next question. Customer losses do not reveal why every individual lost. A mathematically profitable example does not establish that its assumed accuracy is achievable. A correct prediction does not prove that a matching contract was available at the recorded payout.
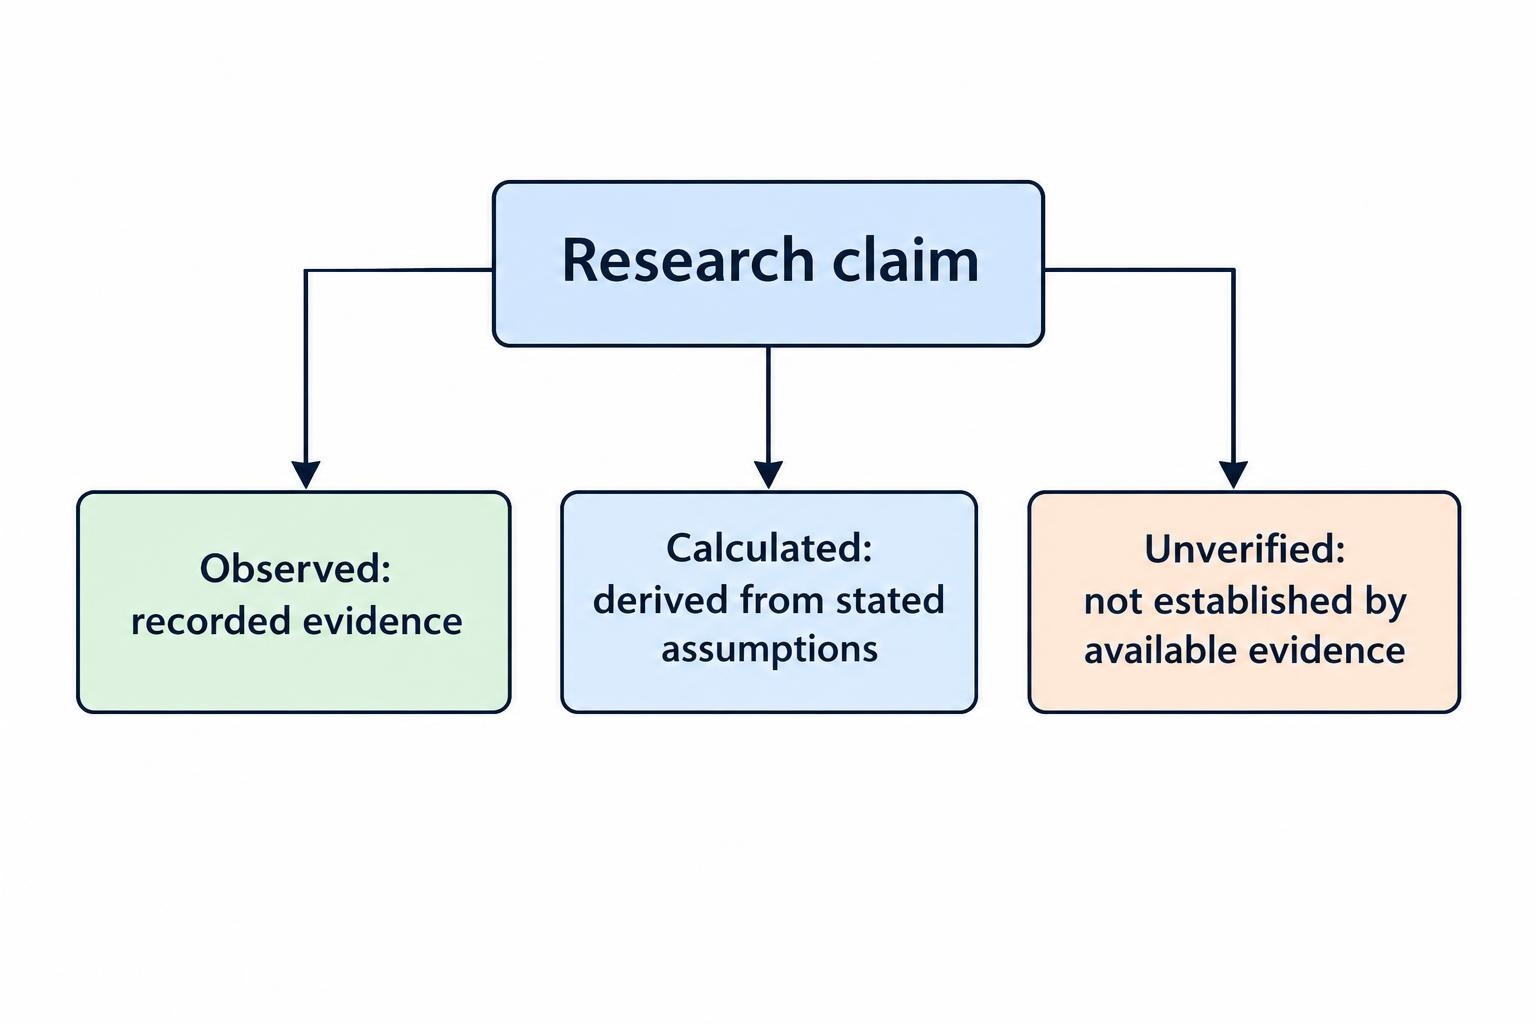
Keep three categories separate: what was observed, what was calculated and what remains unverified. That distinction is the difference between research and a sales pitch with a spreadsheet attached.
Retail Loss Statistics: Check What the Percentage Measures
ASIC examined data obtained from five Australian financial services licensees over a period covering approximately 13 months before its ban and eight months afterwards. One licensee issued no binary options during that period. Between April 2020 and the ban’s effective date, 74–77% of active retail clients lost money in each quarter. Retail client accounts recorded aggregate net losses of approximately A$14 million during the pre-ban period. These findings appear in ASIC Report 736 on the binary options intervention.
The quarterly measurement matters. It is not a lifetime failure rate, a percentage of losing contracts or a forecast for every future participant. Nor should quarterly percentages be added together: the same customer may appear in more than one quarter.
Before comparing loss figures, check the population, observation period and unit being counted. Clients, accounts and transactions are not interchangeable. Also distinguish aggregate net losses from losses among losing accounts alone, because profits elsewhere in the sample can offset part of the latter figure.
The binary options loss statistics guide examines these definitions and the limits of comparisons between datasets.
Payout Research: Accuracy Is Only Half the Calculation
A performance claim needs both a winning percentage and the return on each winning contract. Consider a hypothetical contract that pays 80% profit on a successful stake and loses the full stake otherwise. A A$10 win produces A$8 profit; a loss costs A$10.
With equal stakes, no refunds, no ties and no other costs, the break-even winning percentage is:
Break-even win rate = 1 ÷ (1 + profit payout rate)
| Profit on a winning stake | Winning percentage needed to break even |
|---|---|
| 70% | 58.82% |
| 80% | 55.56% |
| 90% | 52.63% |
Under the 80% example, 55 wins and 45 losses across 100 contracts at A$10 each produce A$440 in winning profits and A$450 in losses. The result is a A$10 loss before other costs, despite winning more often than losing.
These calculations do not establish that any winning percentage is attainable. They identify the hurdle a performance claim must clear. If payouts or stakes vary, calculate the money result contract by contract rather than relying on a headline accuracy figure.
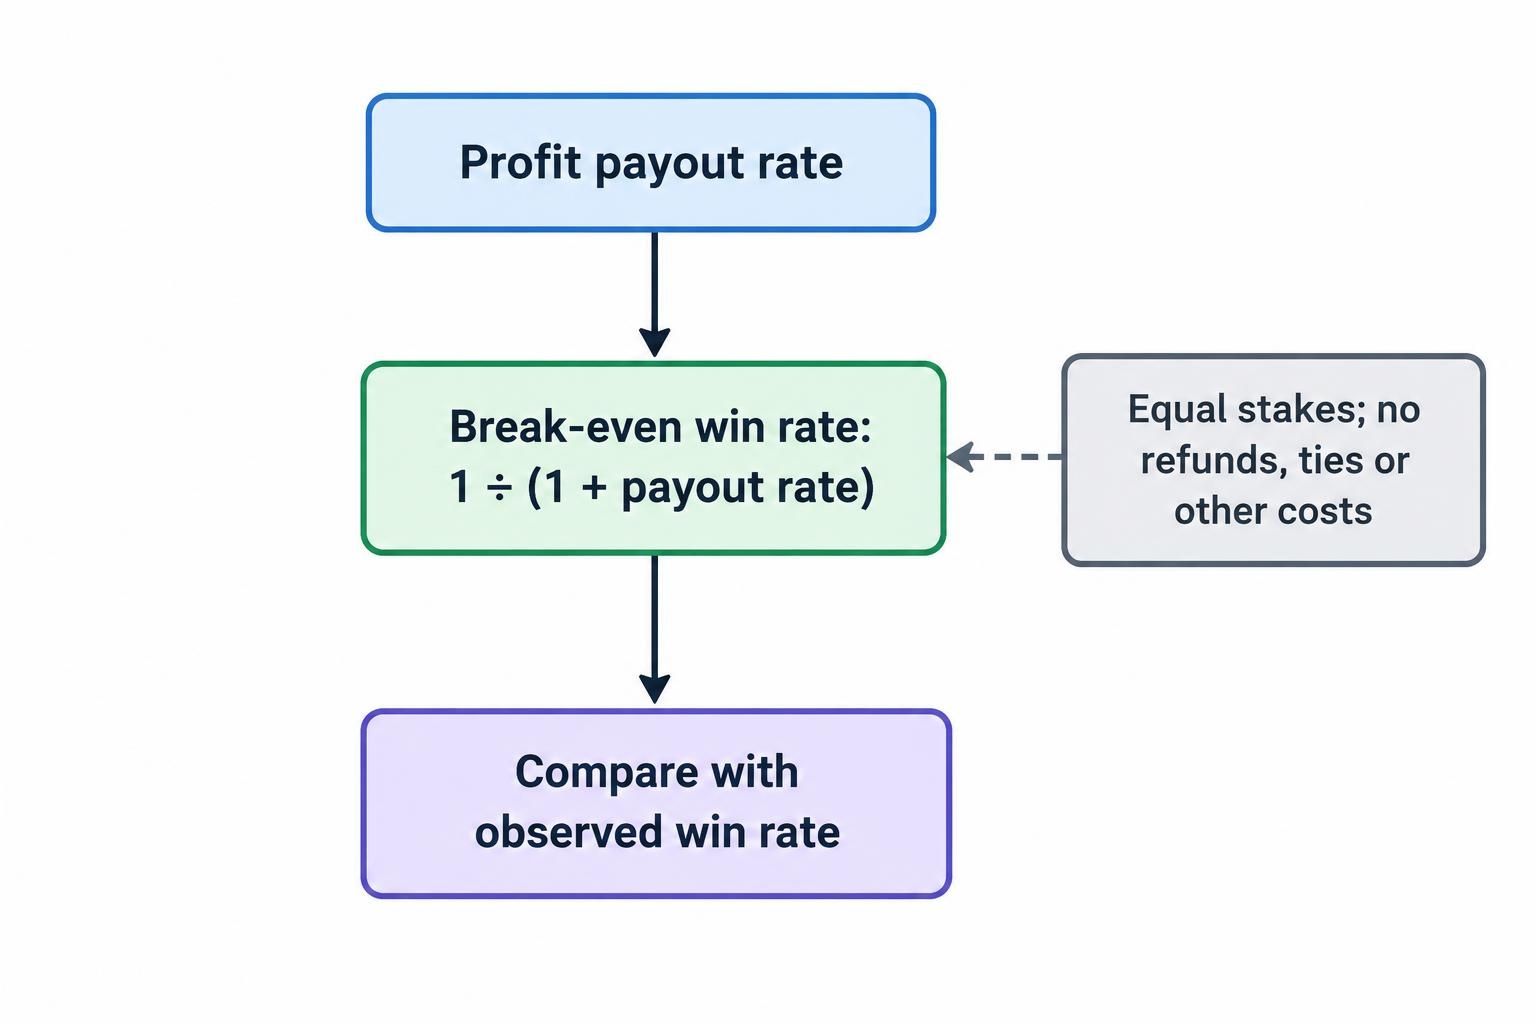
The payout and break-even study covers the relationship between contract terms, accuracy and net results without treating a mathematical example as observed performance.
Demo Versus Live Results: Compare the Assumptions
A demo record shows what happened inside a simulation under that simulation’s rules. It does not establish that the same orders, payouts and settlements would have been available in a funded account.
A useful comparison should document the instrument, contract duration, quoted payout, requested entry time, accepted entry time and settlement rule. It should also identify rejected orders and missing observations. Comparing a carefully selected demo session with an unrelated live session leaves too many possible explanations for any difference.
Account behaviour needs a separate check. If a participant changes stake size after losses in one account but not the other, the comparison mixes account conditions with decision making. A clean design should distinguish those questions rather than assign every difference to the platform.
The demo versus live trading differences study sets out the evidence needed for a fair comparison. Without paired records, claims about the size or direction of any performance gap should remain unverified.
Price Feeds and Settlement: Match the Contract
A chart comparison needs more than two screenshots showing different prices. Research should identify exactly what each price represents: a bid, an ask, a last trade, a midpoint or another published value. It should also establish whether the two records refer to the same instrument and timestamp.
For a settlement review, preserve the strike price, accepted contract details, expiry time and stated settlement benchmark. Record the time zone and available timestamp precision. A minute candle cannot by itself reconstruct every price within that minute.
The question is whether settlement followed the contract’s stated rule, not simply whether another chart displayed a different number. A discrepancy can justify further investigation without proving misconduct. Missing benchmark records can also prevent a firm answer.
The price feed and settlement study focuses on these comparisons, including how to distinguish a documented mismatch from a difference between unlike price records.
Trading Signal Audits: Count the Whole Record
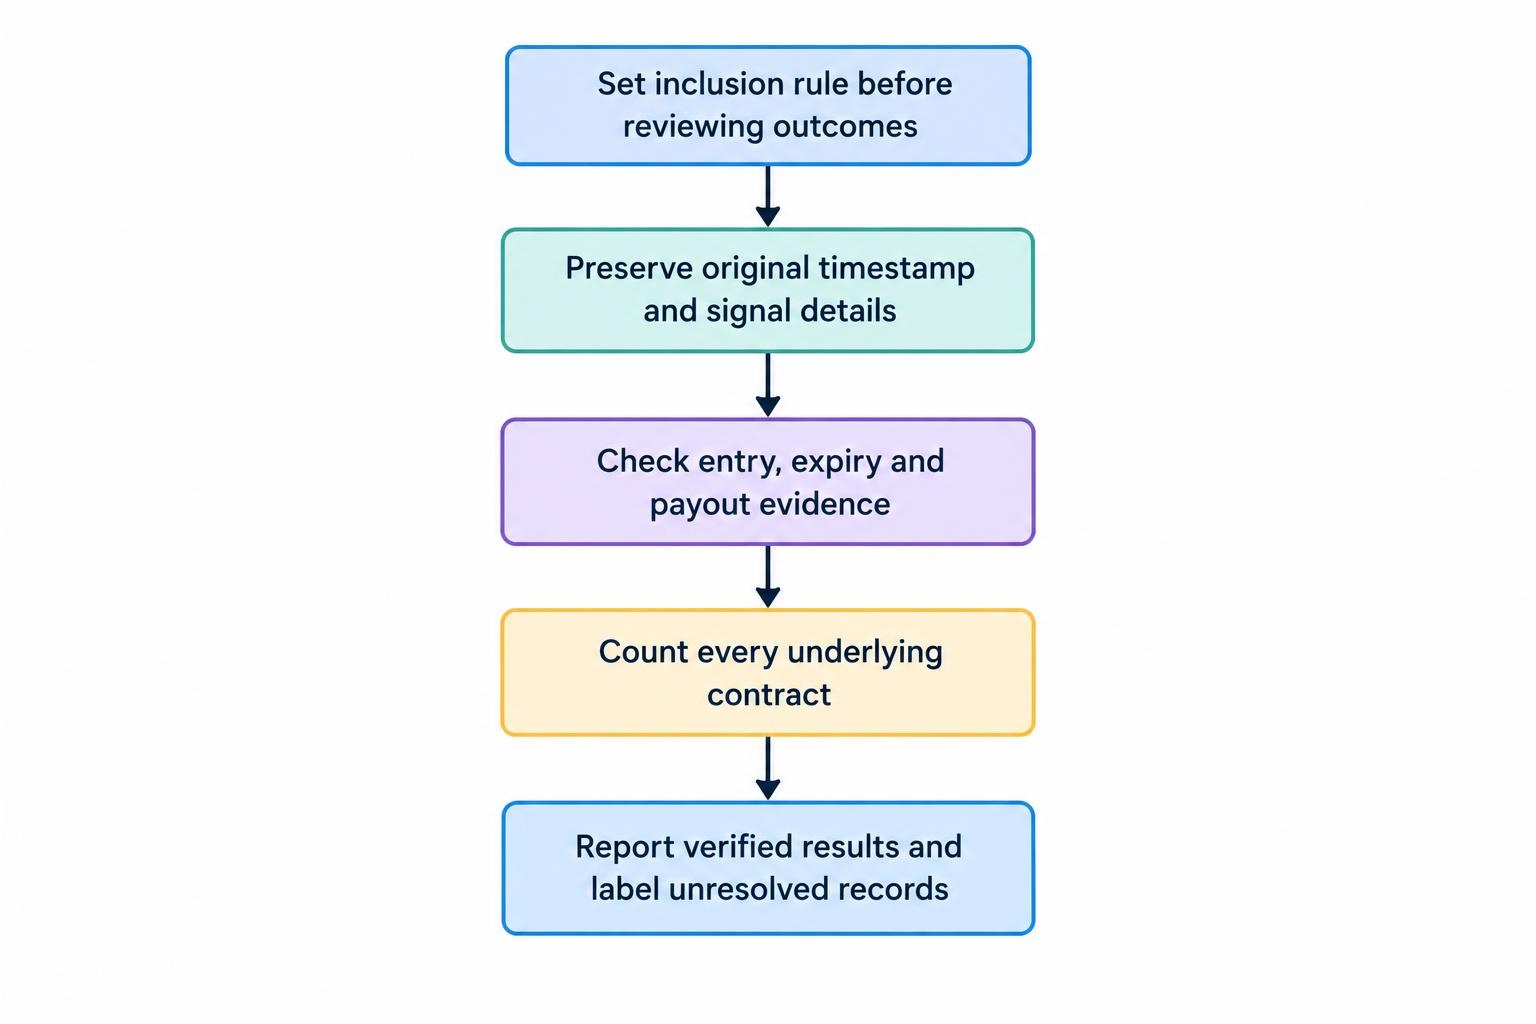
A signal audit should begin with a rule for including observations, established before outcomes are reviewed. Each signal needs an original publication time, instrument, direction, entry condition and expiry instruction. Preserve edits and deletions where records allow, rather than accepting only the version visible afterwards.
Separate prediction accuracy from executable performance. A signal might correctly predict direction but arrive after its stated entry time. It might also rely on a payout that the recipient’s records do not show. Neither issue should disappear from the report.
Recovery sequences need careful treatment. If a service describes several escalating stakes as one successful cycle, show both the cycle result and every underlying contract. Otherwise, the headline can hide how much money was exposed before the final win.
The trading signal performance audit provides a framework for checking complete records, payout assumptions and reproducibility. Where an entry or outcome cannot be verified, label it unresolved rather than assigning whichever result makes the record look better.
Report Statistical Uncertainty
Even a complete record needs an uncertainty measure. In a hypothetical sample of 100 independent observations with the same underlying success probability, 60 wins produce an observed win rate of 60%. A 95% Wilson confidence interval is approximately 50–69%, calculated using the method in the NIST guidance on confidence intervals for proportions.
That range crosses the 55.56% break-even threshold in the earlier 80% payout example. The sample therefore does not justify treating 60% as an established success probability. The interval also does not correct missing trades, selective publication or a test whose assumptions do not fit the observations.
Backtests: Account for the Search Behind the Winner
A backtest becomes harder to assess when the researcher tries many variations but reports only the best. The published result then reflects both the proposed rule and the search used to select it. Research on statistical overfitting and backtest performance examines how historical testing can produce persuasive results that fail outside the selected data.
For binary options research, keep a record of every tested variation: instrument, entry rule, expiry, payout assumption and filter. Preserve failed versions too. A winning result chosen from hundreds of attempts should not be presented as though it came from one test specified in advance.
Reserve later observations for evaluation and disclose whether researchers changed the rules after seeing them. This is a research safeguard, not a promise of future profitability. A tidy backtest remains a historical simulation.
Broker Research: Identify the Entity Behind the Brand
A broker research record should distinguish the public brand, contracting company, domain and claimed licence. Record the date of each check and preserve the document connecting those details. A registration claim without a matching entity and activity does not answer the research question.
Performance research must also separate a displayed account balance from money actually returned to a customer. The SEC and CFTC have documented complaints involving refused reimbursements, identity theft and alleged software manipulation in their joint investor alert on binary options fraud. Those complaints explain why a trading dashboard alone is insufficient evidence; they do not establish misconduct by every operator.
The broker legal entities and operating status research addresses identity checks and dated status records. Historical authorisation, present authorisation and permission to offer a particular product should be investigated separately, not compressed into a “regulated” badge.
What a Useful Research Report Should Disclose
A readable report does not need pages of technical language. It needs enough detail for another person to follow the calculation and identify where judgment entered the process. At minimum, look for:
- Scope and dates: the question, population, instruments and observation period.
- Data and exclusions: the origin of the records, missing observations and reasons for removing entries.
- Method and assumptions: payout treatment, stake sizing, ties, costs and any rule changes.
- Results and limits: money outcomes, uncertainty, unresolved records and what the evidence cannot establish.
Commercial interests belong in that disclosure too. Readers should be able to tell whether a publisher receives referral payments or sells the service being assessed. A disclosure does not replace evidence, but it helps readers evaluate the incentives surrounding a claim.
Research should leave room for an incomplete answer. “Not verified” is different from “false”; “profitable in this sample” is different from “reliably profitable”. The most useful binary options research makes those boundaries visible instead of smoothing them away.
This article was last updated on: October 22, 2026